Gartley

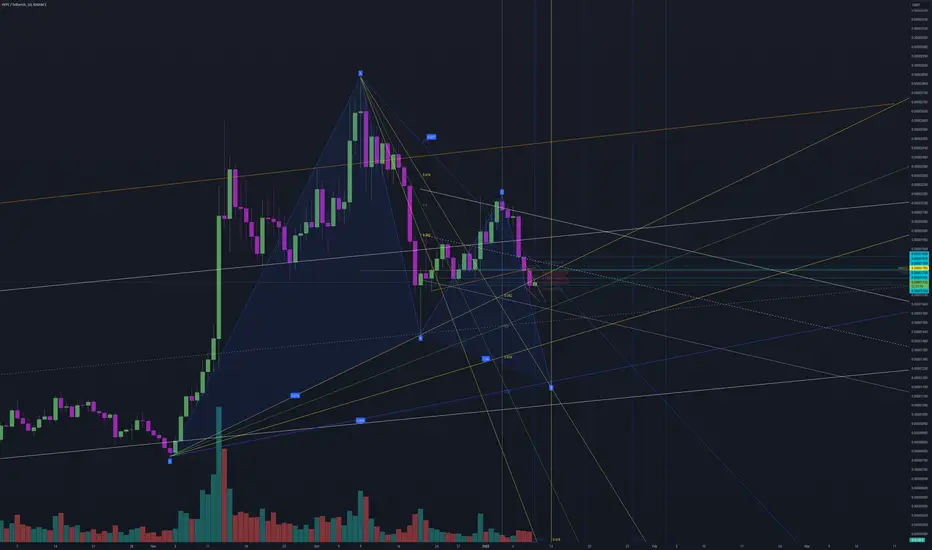
Pepe - Zoomed in ABC (123)Gartley Harmonic into Wave 3 grand cycle. Gartrley Harmonic then from D. Massive Wave 3?!

#CCAP Egyptian stock#CCAP time frame 1 DAY
Created a bearish Gartley pattern
Sell point at 2.57
Stop loss / reentry 2.63 ( estimated loss -2.15% )
First target at 2.44 ( estimated profit 5% )
Second target 2.32 up to 2.24 ( estimated profit up to 13% )
and may prices still going down to around 2.00 .
the profit in this case is saving your invest from losses up to 13% .
in case the prices still rises then re entry for targets 2.75 , 2.83 , 2.93 up to 3.11.
NOTE : this data according to time frame 1 DAY
Its not an advice for investing only my vision according to the data on chart
Please consult your account manager before investing
Thanks and good luck

Pepe Gartley PhaseHey guys, Gartley Harmonic formation ultimately playing out. I was trying to depict in previous charts how the outer and inner Gartleys all correlate.
This just an idea lets see how it plays out.
JCIG!

#ABUK Egyptian stock - great opportunity - great fundamental.#ABUK time frame 1 DAY
created 2 Bullish pattern ( Gartley and AB=CD ) , so we can see action price in this point but in anther hand we are in a downtrend targeted 41.00 to 35.00 especially EGX30 is negative .
Entry level at 48.00 to 48.30
Stop loss 47.50 ( loss may go to up -1.7% ) or 46.80 the last stand with loss -4%
First target at 51.75 ( with profit around 7% )
Second target 54.25 ( with profit around 12% )
Third target 56.00 ( with profit 15% )
NOTE : this data according to time frame I DAY , it`s may take period up to 3 months to achieve targets , you must study well the Alternative opportunities before invest in this stock .
In addition EGX30 is negative.
Its not an advice for investing only my vision according to the data on chart
Please consult your account manager before investing
Thanks and good luck

USDCAD focuses on bullish GartleyOn the 4-hour chart, USDCAD is currently running at a high level, and the overall trend is oscillating. At present, we can pay attention to the potential bullish Gartley pattern, and the buying position is around 1.4316. At the same time, this position is in the previous demand area.

#NIO - USA - so exciting opportunity ,#NIO time frame 1 DAY
Created bullish Gartley pattern , in addition there is anther bullish Gartley pattern will be done if prices reached to stop loss of the first pattern ( so exciting ) .
First bullish Gartley pattern as follow :
Entry level 4.14 to 3.90 ,
Stop loss 3.65 ( estimated loss -12.36% ),
First target at 5.25 ( estimated profit around 26.40% ),
Second target 6.17 ( estimated profit around 48% ),
Third target 6.84 ( estimated profit around 64% ),
Second bullish Gartley pattern is assumption ,it's not done yet . pattern in yellow
So if prices reached to 3.65 ( stop loss of first Gartley pattern ) the numbers will be as follow :
Entry level 3.65 ,
Stop loss 3.20 ( estimated loss -12% ),
First target at 4.31 ( estimated profit around 19% ),
Second target 4.71 ( estimated profit around 29.85% ),
Third target 5.00 ( estimated profit around 37% ),
IN ADDETION , if prices didn't close under 3.65 the fist bullish Gartley pattern still Active !!
There is positive diversion on MACD , that may support our idea .
NOTE : this data according to time frame I DAY.
Its not an advice for investing only my vision according to the data on chart
Please consult your account manager before investing.
Thanks and good luck.

#EEM USA#EEM time frame 1 DAY
Created a bullish Gartley pattern ,
Entry level around 41.00 ,
Stop loss 40.80 ( estimated loss -1.7% ),
First target at 43.00 ( estimated profit around 3.70% ),
Second target 44.44 ( estimated profit around 6.70% ),
Third target 45.44 ( estimated profit around 9.40% ),
There is positive diversion on MACD , that may support our idea .
NOTE : this data according to time frame I DAY.
Its not an advice for investing only my vision according to the data on chart
Please consult your account manager before investing.
Thanks and good luck.

#IWM USA#IWM time frame 1 DAY
created a bullish Gartley pattern
entry level at 219 TO 217
stop loss 216
first target at 226.30
second target 232.36 up to 236.67
NOTE : this data according to time frame I DAY
Its not an advice for investing only my vision according to the data on chart
Please consult your account manager before investing
Thanks and good luck

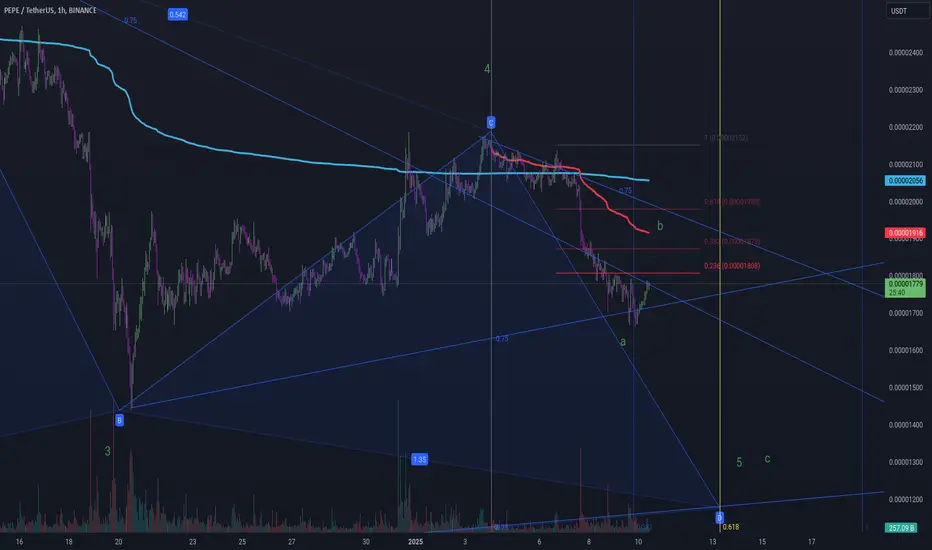
Pepe 4 to 5 Wave Zoomed Be careful with the corrective ABC pattern leading to Wave 5. Red line resistance Anchored VWAP from high of wave start.
Fibs drawn from C minor of 4 major Wave and not (4) to c minor.. to get resistance levels. Be careful because Wave 3 (C) is the longest wave. Nice long ride
Pepe Gartley and Elliot WavesLast Wave GOT ME! and now I see!
Sorry such a short description but highly recommend book: ELLITT WAVE FIBONACCI HIGH PROBABILITY TRADING by Jarrod Sanders
HIGHLY RECOMMEND - Chart Champions!

BTC Bullish Gartley Harmonic I'd like to dedicate this to my friend Phillpe .. Who suggested larger time frames. Gartley Harmonic

Pepe ig Time Frame GarleyIve been studying Elliot Wave and lost in all the waves. This is my big picture.
ADA/USDT Bullish Setup Gartley Bullish Harmonic Pattern1. Market Analysis:
Asset: ADA/USDT (Cardano vs. USDT)
Pattern: Bullish Gartley harmonic pattern detected on the daily timeframe.
Key Levels: Price is approaching the D-point, which is at the 78.6% Fibonacci retracement of the XA leg, near a strong support zone, signaling a potential bullish reversal.
2. Gartley Pattern Details:
XA Leg: Strong initial move upward.
AB Leg: Retraces approximately 61.8% of XA.
BC Leg: Extends between 38.2% and 88.6% of AB.
CD Leg: Completes at 78.6% retracement of XA (D-point).
D Completion Zone: A critical area to monitor for bullish price action.
3. Trade Setup:
Entry Point:
Enter a long position at or near the D-point when a bullish reversal signal is confirmed (e.g., bullish engulfing, hammer candlestick, or a pin bar).
Stop-Loss:
Place the stop-loss slightly below the D-point or the nearest support level to protect against pattern invalidation.
Take-Profit Levels:
TP1: 38.2% Fibonacci retracement of the CD leg.
TP2: 61.8% Fibonacci retracement of the CD leg.
TP3 (Optional): Full retracement to the XA high.
4. Risk Management:
Position Size: Use proper risk management, risking no more than 1-2% of your trading capital.
Risk-Reward Ratio: Aim for at least a 1:2 risk-reward ratio.
5. Additional Confirmation:
Volume Analysis: Look for an increase in volume as the price reaches the D-point, which indicates strong buying interest.
Oscillator Signals: Use RSI or MACD to confirm oversold conditions or bullish divergence near the D-point.
6. Trade Execution:
Order Placement:
Set a buy limit order near the D-point if confident in the pattern.
Alternatively, wait for a confirmed bullish signal before entering the trade.
Trail Stops: Adjust stop-loss as the trade progresses to secure profits and reduce risk.

XRP/USDT Bullish Setup Gartley Bullish Harmonic Pattern
TradingView Trade Plan: XRP/USDT Bullish Setup
Gartley Bullish Harmonic Pattern (Daily Timeframe)
1. Market Analysis:
Asset: XRP/USDT (Ripple vs. USDT)
Pattern: Bullish Gartley harmonic pattern identified on the daily timeframe.
Key Levels: The price is approaching the D-point, which aligns with the 78.6% Fibonacci retracement of the XA leg and a critical support zone, suggesting a potential bullish reversal.
2. Gartley Pattern Details:
XA Leg: Initial strong upward move.
AB Leg: Retraces 61.8% of XA.
BC Leg: Extends between 38.2% and 88.6% of AB.
CD Leg: Completes at 78.6% retracement of XA, the D-point.
Completion Zone (D-Point): Look for bullish reversal signals around this level.
3. Trade Setup:
Entry Point:
Enter a long position when price action confirms a reversal at or near the D-point (e.g., bullish engulfing, hammer candle, or pin bar).
Stop-Loss:
Place the stop-loss slightly below the D-point or a nearby support zone to account for pattern invalidation.
Take-Profit Levels:
TP1: 38.2% retracement of the CD leg.
TP2: 61.8% retracement of the CD leg.
TP3 (optional): Full retracement to the XA high.
4. Risk Management:
Position Size: Use proper risk management, risking no more than 1-2% of total trading capital.
Risk-Reward Ratio: Ensure the setup offers a favorable risk-reward ratio (minimum 1:2).
5. Additional Confirmation:
Volume Analysis: Look for increasing volume near the D-point, signaling buying interest.
Oscillator Support: Look for RSI or MACD divergence or oversold conditions around the D-point for added confidence.
6. Trade Execution:
Place Orders:
Use a buy limit order near the D-point if confident in the pattern completion.
Alternatively, wait for bullish candlestick confirmation before entering.
Adjust Stops: Trail the stop-loss as the trade progresses to secure profits and minimize risk.

ETH/USDT Bullish Setup1. Market Analysis:
Asset: ETH/USDT (Ethereum vs. USDT)
Pattern: Bullish Gartley harmonic pattern identified on the daily timeframe.
Key Levels: Price is approaching the completion point (D), which aligns with strong support zones, indicating a potential bullish reversal.
2. Gartley Pattern Details:
Pattern Structure:
XA: Initial impulse leg.
AB: Retraces 61.8% of XA.
BC: Extends between 38.2% and 88.6% of AB.
CD: Completes at 78.6% retracement of XA.
D Completion Zone: This is the key area to watch for bullish price action confirmation.
3. Trade Setup:
Entry Point:
Enter a long position when price action confirms a reversal at or near the D-point (e.g., bullish engulfing, hammer candle).
Stop-Loss:
Place the stop-loss below the D-point or a nearby support zone to protect against invalidation of the pattern.
Take-Profit Levels:
First Target (TP1): 38.2% retracement of the CD leg.
Second Target (TP2): 61.8% retracement of the CD leg.
Optional Target (TP3): Full retracement to the XA high.
4. Risk Management:
Position Size: Base the position size on the risk tolerance and distance between entry and stop-loss, ensuring no more than 1-2% of trading capital is at risk.
Risk-Reward Ratio: Aim for at least a 1:2 risk-reward ratio.
5. Additional Confirmation:
Volume Analysis: Look for increasing volume as price reverses from the D-point, signaling strong buying interest.
Oscillator Support: Check RSI/MACD for oversold conditions or bullish divergence near the D-point for additional confirmation.
6. Trade Execution:
Place Orders:
Set a buy limit order near the D-point if confident in the pattern’s completion.
Alternatively, wait for bullish confirmation before entering.
Adjust Stops: Trail the stop-loss to lock in profits as price moves toward take-profit levels.

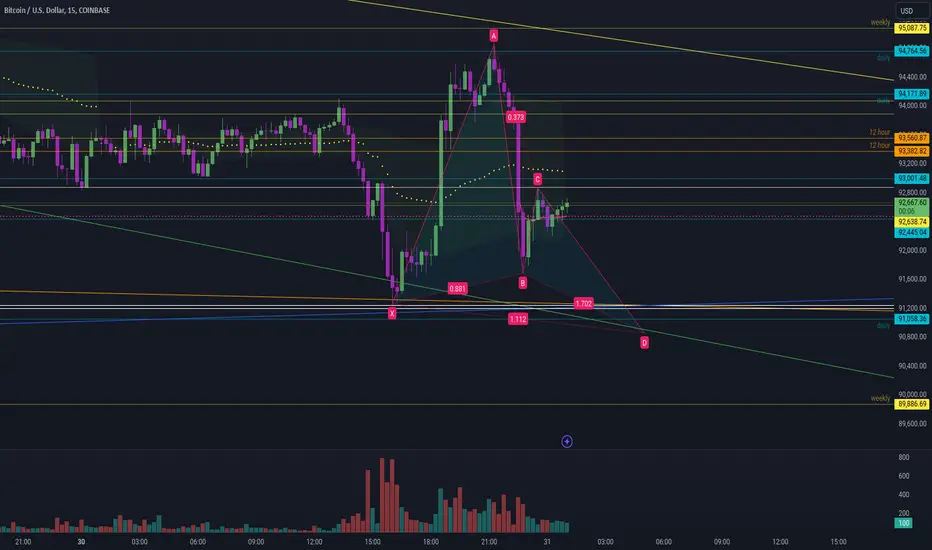
BTC Short Term Time Frame GartleyBlue line resistance Anchored VWAP from Monday 30 low
Red line resistanceAnchored VWAP from all time high
0.382 resistance to seesion VWAP resistance
Fib resistance levels for Gartley on left
Possible retrace from fib resistance back down to Gartley Harmonic D 0.782 IF momentum doesn't favor the uptrend.

ICP (Insane Clown Posse) Crypto SetupType 1 Bullish Gartley on ICP looking for the Type 2 return where there is a potential Bullish Butterfly forming in the PRZ


Pepe big picture Gartley I am concious but unsure of this happening now. Timing wise. Mini Gartley posted earlier bullish but to put on your radar theres a bigger picture. Nee more data to confirm. Unbias until receive more data. Now is the time based on Fib Based time for a dump. Unsure so play it safe until then.

BTC Short Term Time Frame Shark Harmonic - Bottom RangeHey guys, short term time frame BTC bottom of range Shark Harmonic .. lets see how it plays out
Pepe Gartley Harmonic BullishHey guys, have to call this one in real time. Gartley Harmonic classic. Short time frame . classic. Lets see how it plays out
