What you think about Ng(natrual gas)? as per my analysis. 7.351 is resistance for ng and target 4.136 (support for reverse)
GAS

Oil Prices might be heading up!On the chart, we're seeing that bounce towards the resistance above.
On the news, we see Russia and the OPEC thinking about reducing oil production to keep prices high.
We saw Qatar selling all that gas to China (a massive amount).
We are hearing more and more about blackouts in Europe.

NGAS BULLISH OUTLOOKNGAS prices started rising on Monday after a cold wave engulfed the European continent, testing its ability to coupe with the cold weather without its main natural gas supplier Russia.
The instrument broke the resistance levels of the triangle chart pattern entering into a bullish movement. RSI indicator is above the 50 neutral line and MACD histogram is above 0, both confirming the potential bullish movement.
If the trend continues the price might try to test levels of 7.649 In the opposite scenario, the price might try its previous support of 6.554
Risk Disclosure: Trading Foreign Exchange (Forex) and Contracts of Difference (CFD's) carries a high level of risk. By registering and signing up, any client affirms their understanding of their own personal accountability for all transactions performed within their account and recognizes the risks associated with trading on such markets and on such sites. Furthermore, one understands that the company carries zero influence over transactions, markets, and trading signals, therefore, cannot be held liable nor guarantee any profits or losses.


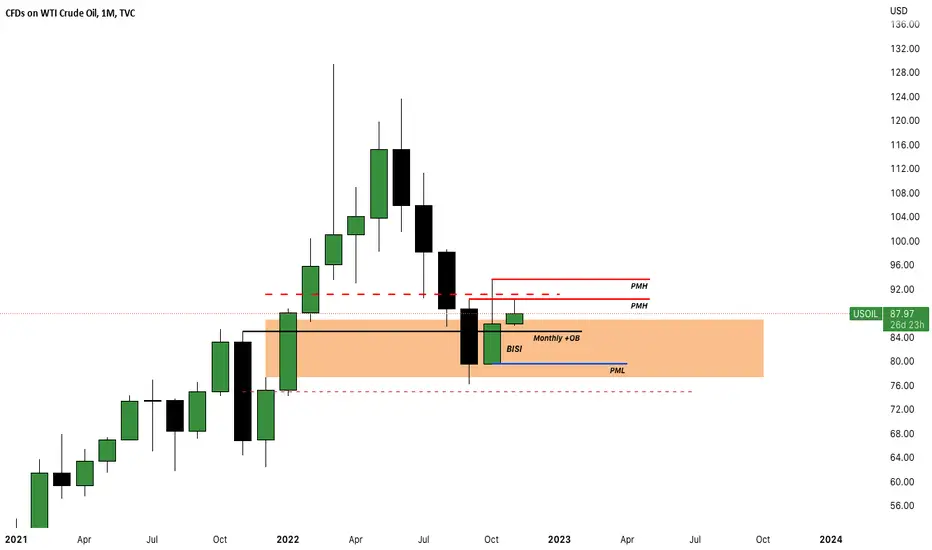
If oil prices close below $84-$79 it creates a sell opportunityIf oil prices close below $84 - $79 it creates a sell opportunity for us into the $72 zone

The reasons why going long oil is the best trade you can take!In my opinion, the global energy crisis isn't over; hence there are many reasons why being bullish on oil makes sense, and in this idea, I will try to analyze most of them one by one.
First of all situation between Russia-Ukraine doesn't look any good, and it also heavily affects Europe, which is essentially directly involved in this war. Currently, gas from Russia to Europe is lost and can't be replaced because Russia has cut flows while someone sabotaged the gas pipelines. At the same time, Europe is about to ban Russian oil from being sold to Europe while also trying to apply price caps on oil and natural gas. All these essentially increase the oil demand (to replace natural gas) while also decreasing production in case Russia cannot sell that oil to somebody else. As if these aren't enough, as many foreign oil companies managing the production have left Russia, its oil production could drop even more as they don't have the knowledge and ability to control the oil fields themselves.
The oil prices remain under control simply because the US keeps releasing oil from its SPR while China keeps pursuing its zero Covid policies. The US eventually will have to stop releasing oil from its SPR because the SPR was created for an emergency, not to keep prices low to buy votes. Not only will the US have to stop emptying its SPR, but it will also have to refill it. Also, China will eventually realize its futile attempt to contain omicron and stop its lockdowns. Essentially just the combination of the two would be an incredibly bullish development for the price of oil, as a lot of supply would come off the market. At the same time, demand will increase massively as Chinese citizens want to travel and consume more.
Unfortunately, the US and the world are pursuing catastrophic policies regarding the energy sector instead of pushing investments into it. The windfall taxes on the energy companies will discourage investors from putting money in while starving companies of cash they could have used to invest in more energy production. At the same time, many rules against the extraction of fossil fuels and nuclear energy production are making things even worse. As if these haven't been enough, the US is also talking about an export ban, which, if implemented, would have catastrophic consequences for the world and the US. It would create a massive imbalance in the oil market, which would already have severe issues due to the European embargo on Russian oil.
Recently OPEC+ announced oil production cuts, and the tensions between the US and Saudi Arabia have increased significantly. While the US refuses to increase its oil output, OPEC+ cut production by 2 million barrels daily. However, here is the thing... OPEC+ agreed to reduce output that it was not achieving. The truth is that OPEC+ has reached its production limits, and most countries are failing to meet their quotas. There is no spare capacity, and it is tough for them to increase their output. Essentially the cut so far was mostly an admission that they can't produce more.
Saudi Arabia and OPEC+ want to keep the price of oil around 80$ and are ready to cut production to counteract the Fed's actions to reduce demand by hiking interest rates. There is an ongoing war been energy producers and Central banks, and the more central banks hike interest rates, the more energy producers will have to cut. Of course, with all the rate hikes and the global economy in a silent depression, we are slowly moving into a brutal recession in the next 6-12 months, which could knock oil prices much lower for a while. However, as central banks are already being forced to pivot, dumping reserves and resuming QE, we could see them and governments trying to stimulate an energy shortage, which could increase oil prices. Finally, the US has talked about refilling its SPR when prices are below 60-80$, while the Saudis talked about cutting production if the prices are below 80$. This means that the price area between 50$ and 80$ is worth going long, as the US and OPEC+ are creating a price floor by reducing supply and increasing demand.
So what's the trade? Accumulate oil in the 50-90 area. No stops. Target 250-300$. Time horizon - 2 years.

OXY: 3 Line Strike If The Week Closes Like ThisWe have 2 instances of MACD Bearish Divergence along with some RSI Divergence and a potential for there week to confirm a Bullish 3 Line Strike if the weekly can close below the last 3 bullish candle bodies. Based off of this i think Occidental Petroleum will be coming back down to $35.00

Natural gas one more low then we explode to the upside We've been tracking this C wave for some time now and it finally looks like we're getting the wave 5 of C which should finish somewhere around the $5 area. Once we reach this price point we will be going long with an ultimate target of $15 which is a HUGE trade.

sell on usoilrocky week for oil as China has made the decision to keeo the COVID zero policy. The lockdown in China is causing demand fears for oil along with recession fears as the Fed did yet another interest rate hike and the Dollar oars.
USOil is creating a double Top you can continue to hold long turn. The last leg formed took only 10 days to form. Or do shorter term hold taking a TP at 86.00, 84.50

$USOIL $97 short-term target 👁🗨*This is not financial advice, so trade at your own risks*
*My team digs deep and finds stocks that are expected to perform well based off multiple confluences*
*Experienced traders understand the uphill battle in timing the market, so instead my team focuses mainly on risk management*
Hello fellow traders and investors! My team isn't expecting oil/gas demand to slow down anytime soon. A long-term target of $132 and beyond is on the horizon. Ever since the war in Ukraine began the Biden administration has been trying their hardest to keep prices down by releasing war-time oil reserves periodically. This is a temporary solution, and my team believes that it will eventually lead to a blow off top. Raising interest rates seems to be the feds only solution to combating the situation, yet it has become evidently clear that they have no idea what to do and whether or not this will actually solve the issue.
These are just our thoughts surrounding the situation and things could change quickly with the emergence of new information. We hope that this helps!
!! This chart analysis is for reference purposes only !!
If you want to see more, please like and follow us @SimplyShowMeTheMoney

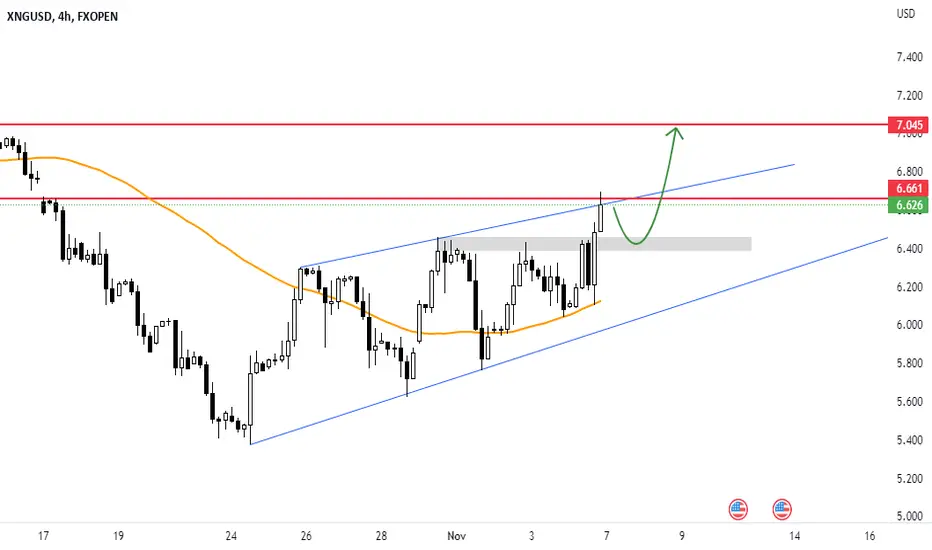
XNGUSD - NGAS NEXT WEEK MOVEGas this week had a strong bullish movement, and I expect it to complete this movement next week, with a correction that may target 6.40 levels, from which it may launch towards 7.0 levels.The gas has been in an ascending channel for 11 days, but will it breach it and rise towards the 7.0 levels? We wait next week to see what it has in store.
🔥💥 Like, Shared and subscription 💥🔥
Note: If you are a beginner trader, you should be aware of these rules:
1: Do not covet
2: Don't trade too much
3: Secure your positions after entering the profit
4: Enter contracts that fit your portfolio
5: Adhere to all recommendations
✅NATGAS BREAKOUT|LONG🚀
✅NATGAS broke the key structure level
While trading in an local uptrend
Which makes me bullish
And I think that after the retest of the broken level is complete
A rebound and bullish continuation will follow
LONG🚀
✅Like and subscribe to never miss a new idea!✅

NATGAS Looks Bullish! Buy!
Hello,Traders!
NATGAS was trading below
A key horizontal level but now
We are seeing a bullish breakout
So I am bullish biased locally
And I think that after the retest
We will see more growth
Buy!
Like, comment and subscribe to boost your trading!
See other ideas below too!

USOIL October IPDA ResultsHello Traders!
We can see how larger setups can play out if you know what you are looking at.
IPDA will give you key levels to concern yourself with going into each new month.

USOILHello Traders!
My stance on bullish USOIL still stands.
Oil is in a discounted market on the monthly time frame.
Trade setups like this do not come often or is overlooked.
I enjoy looking and trading based off of the higher time frames. I want to be on the right side long term.
NGThe possibility of increasing the price of natural gas up to the desired range where the corrective movement of time is higher is very high.

✅NATGAS SHORT FROM RESISTANCE🔥
✅NATGAS is going up now
But a strong resistance cluster level is ahead
Thus I am expecting a pullback
And a move down towards the target
SHORT🔥
✅Like and subscribe to never miss a new idea!✅

breaking out from bull flag into another bulllish cypher patterlooking for oil to breakout from the 1st bullish cypher into the next from D leg to X leg and start another uptrend.. target #130


✅NATGAS SWING SHORT🔥
✅NATGAS violated the rising support recently
And went down just as I predicted
In my previous analysis but the price
Went up in a bullish correction
To retest the resistance from where
We are already seeing a bearish reaction
So a bearish continuation is to be expected
SHORT🔥
✅Like and subscribe to never miss a new idea!✅

$DXYDXY deviated range high on lower timeframes.
CPI data came out at 8.3% so seen the last flush (maybe ) into the doller. I think its topped short term and will cool off.
But charts will lead the way here.
If it cant reclaim the range High il look for long in BTC also for a short term trade.

NATGAS Risky Short! Sell!
Hello,Traders!
NATGAS is retesting a broken horizontal level
So I am bearish biased
And I think that we are likely
To see a move down
Sell!
Like, comment and subscribe to boost your trading!
See other ideas below too!

GAS... and step on it!I need gas...everyone needs gas. That's why I look up for this guy here 🤑
I think it has a nice momentum and RSI 1D > 50
I take 20% up from here. If it goes deeper it will be buy opportunity with with minimum the same increase each stake.
Let's see...
Regards
