GAS

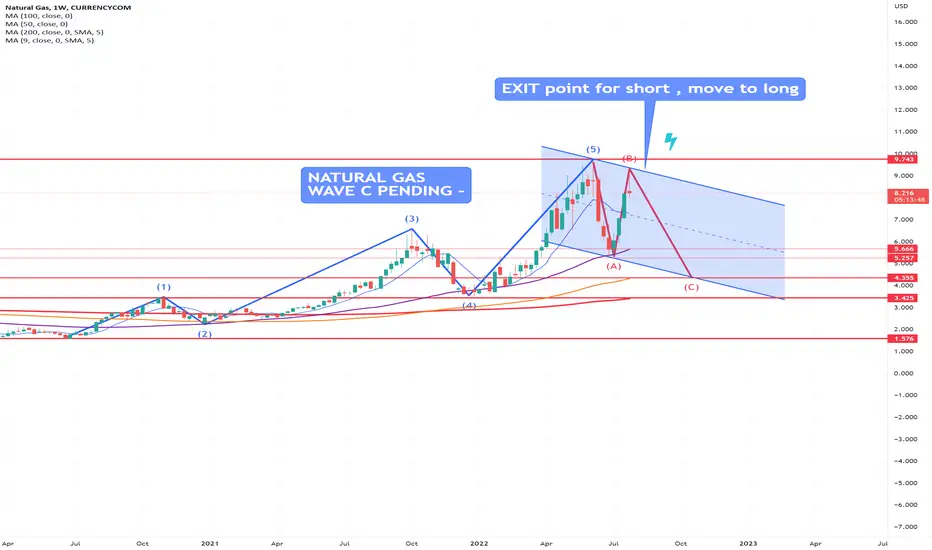
Natural Gas NATGAS wave C is pending - Elliot Wave AnalysisNatural Gas NATGAS wave C is pending - Elliot Wave Analysis
NATURAL GAS - BAT PATTERN IN MAKINGNATURAL GAS is printing a bullish bat pattern. It is still in early stage as point C has defined its place. Pattern will complete at point D which is projected at 4.
The price has already been rejected at the key resistance on the daily chart, and RSI is headed downwards. There has also been a continuous decrease in volume from the first time the price tested the key resistance.
This may confirm that the price doesn’t have enough momentum to break through the resistance and is now set for a correction. There are a lot of contributing factors pointing to a bearish scenario for natural gas. Although the price might be bearish, watch out for relief pumps, especially on the support levels.
What do you think of the idea?

Natural Gas from 3 technical perspectives The current overall trend for Natural Gas is bearish, as seen from the monthly chart. The commodity has possibly just completed the 5th wave of the Elliot Impulse Wave, this means that the next movement is possibly a correction. There is also a divergence as seen in the price action and the RSI Indicator which signals the trend weakening. However, the RSI could still possibly reach the 70 level before the price initiates that 5th wave correction.
Natural Gas, from the weekly perspective, has recently met the key resistance of 8.87 to 9.707, which could mean possible downside pressure is building. The price is also in a double top formation which is a bearish pattern. If the price fails to break the key resistance, it could possibly revisit support areas of 5.507, 3.631. On the other hand, if the price does break the resistance, it could possibly go up and test another key resistance around 13.539 to 15.78 which is the all-time high for the commodity.
On the daily graph for Natural gas, the price has already seemed to reject at the key resistance and RSI is headed downwards. The price might fall between 6.392 to 5.507 as the 200 MA acts as a strong support confluence. There has also been a continuous decrease in volume from the first time the price tested the key resistance. This may confirm that the price doesn’t have enough momentum to break through the resistance and is now set for a correction. There are a lot of contributing factors pointing to a bearish scenario for Natural Gas
Although the price might be heading towards a bearish direction, watch out for relief pumps especially on the support levels.

$USOIL charting in advance 👁🗨*This is not financial advice, so trade at your own risks*
*My team digs deep and finds stocks that are expected to perform well based off multiple confluences*
*Experienced traders understand the uphill battle in timing the market, so instead my team focuses mainly on risk management
!! This chart analysis is for reference purposes only !!
My team was able to accurately predict support holding up for oil in our post down below, but we do not think that support will hold on much longer. My team still believes that energy will get its time to shine, but we're seeing a buy zone somewhere in the 80 range. We can't predict the future, but we believe that this chart will be useful in predicting $USOIL going forward no matter if its bullish or bearish.
If you want to see more, please like and follow us @SimplyShowMeTheMoney

$PDN Paladin Energy PDN Formed a nice macro Bull Flag that broke out and trapped a lot of traders as it turned out to be a fakeout. These Breakout traders have since puked their positions on the fake breakout.
PDN then broke support and ranged under the OCT 2004 ATH. This looked like PDN was breaking down and about to go lower.. Exactly whaty a big Hedge fund would want you to think if they were building a position. they are hunting for liquitity imo.
Im bullish here for the following reason.
1.Reclaim of 2004 ATH acting as resistance.
2.Stoch in an area that tends to have a high probability for long setup
3.Small but Bullish Divergence on MACD.
A nice clean break and hold above 720 may start the next leg up on this stock

NATURAL GAS FUTURESNatural gas has reached a very strong peak. If you trade above it, you will continue to climb strongly if God willing, which is also a showcase area from which we must be wary and thanks.
✅NATGAS SHORT FROM RESISTANCE🔥
✅NATGAS has been growing recently
And the pair seems locally overbought
So as the pair is approaching a horizontal resistance
Price decline is to be expected
SHORT🔥
✅Like and subscribe to never miss a new idea!✅

NATURAL GAS expected move Elliot Wave - NATGAS NATURALGASNATURAL GAS expected move Elliot Wave - NATGAS NATURALGAS
WAVE C PENDING - expected heading towards $4-$4.3

ETHETH ran too fast too quick,
Breakout traders are trapped here and if the prices trades lower they will be forced to liquidate their positions this in line with the FED meeting one the 27th and another rate hike this could easily playout.
Above and hold above 1600 i will cut and change go long..
for now short with target marked with circle.

$NVXwould like to see NVX come back and backtest the 2020 year high in blue,.
I will be looking for a retest and reversal at this level. At present it may be another liquidity hunt of lower timeframes.
Below and hold below 2020 year high and im not interested.

PGASTechnical Analysis is the forecasting of future financial price movements based on an examination of past price movements. Like weather forecasting, technical analysis does not result in absolute predictions about the future

Natural Gas time to easy Rally To evaluate the trend of Natural Gas we must take into account 2 factors:
1) The international macro political scenarios:
Russia, which is the world's leading producer, will export less to its main customer the European Union.
Winter in Europe is upon us and there is a serious risk of an energy blockade, Europe will find GAS but the cost from September onwards will be very high with the main natural gas producer out of the market.
2) Graphically we can deduce a strongly bullish graphic structure where increasing minimums and maximums constantly lean on well-defined supports, the price above the moving averages 100, 200 and the fibonacci extension speaks clearly the price should orbit soon at the price of $ 15.
GAS export data:
In 2020, the 5 largest gas exporters in the world were Russia (199,928 mcm), United States (149,538 mcm), Qatar (143,700 mcm), Norway (112,951 mcm), Australia (102,562 mcm).
Winter is coming (Cit 'GOT)
LPI.sa

SYA Sayona MiningSYA deviate mid range with ST target March low.
Pops and holds March low looking for March High as T1 and 2021 High as T2..
Reevaluate as the weeks play out.

$TECS market hedge 👁🗨*This is not financial advice, so trade at your own risks*
*My team digs deep and finds stocks that are expected to perform well based off multiple confluences*
*Experienced traders understand the uphill battle in timing the market, so instead my team focuses mainly on risk management
My team will be using $TECS to secure gains from the possible upcoming market downturn.
Our portfolio as of 7/11/22: $TECS $CRK $MIRM
OUR ENTRY: $45.50
TAKE PROFIT: $60
STOP LOSS: $43.50
If you want to see more, please like and follow us @SimplyShowMeTheMoney

$UVXY we've been here before lol 👁🗨*This is not financial advice, so trade at your own risks*
*My team digs deep and finds stocks that are expected to perform well based off multiple confluences*
*Experienced traders understand the uphill battle in timing the market, so instead my team focuses mainly on risk management
Recap: Bitcoin along with the US market should take a decent hit soon due to the continuation of strength in the dollar. Bear-Index's and the dollar appear to be where the money will be flowing during this period if this does play out.
My team will be using $UVXY to make profit from this scenario next week. We've literally been here before and walked out with a 38% gain. Check the links down below for details.
entry: $12.47
take profit: $17
stop loss: $11
If you want to see more, please like and follow us @SimplyShowMeTheMoney

Russian Gas monopolist is facing it's downfall?☝️What happened?
After taking decision not to pay dividents this year, Gazprom stock dropped almost 40% in the moment.
☝️Why they didn't pay dividents?
Also, prices on gas soared up high, company still decided that it needs spare money in case of unpredictable future problems. There is a theory that one of such problems could be complete stop of gas supply to europe that russian government can take in the near future.
☝️What's next?
From technical point of view we formed triangle and as volatility gets lower, it more likely that we will break it down and fall more.
I want to remind you that currently Gazprom doesn't supply gas to Europe as they are completing planned technical services until 22.07.
I expect further fall to the closest strong level at 160.00
What do you think of this idea? What is your opinion? Share it in the comments📄🖌
If you like the idea, please give it a like. This is the best "Thank you!" for the author 😊
P.S. Always do your own analysis before a trade. Put a stop loss. Fix profit in parts. Withdraw profits in fiat and reward yourself and your loved ones

UNG Reversal time?Nice breakout so far.
Waiting for confirmation above 21, above that level could test previous highs.

Long Crude! - Trading with the COT ReportThis is a great example of how to trade the COT Index and Net positioning - Commercials for crude oil are almost always net short (Think of all the big oil companies hedging their product) but in this instance, they are less net-long than they have been in quite some time (Not since November 2016). Look on the daily chart for an entry - be patient - remember your stops. I also like that the macro trend is positive. Added bonus - a great way to hedge your prices at the pump.
Note: Trading the COT simply tells you when we're in a bullish/bearish environment. An entry still needs to be made based on price behavior.
Additional Note: Look how accurate the COT Index has been on Crude (Red and Green highlighting on the lower chart)
Notes on My Trading Methodology and What I'm Even Talking About
COT Definitions:
- COT: Commitments of Traders Reports - A weekly report published by the government (CFTC) that shows long and short positions of the below 3 groups (As well as much more data I don't look at). We look at the NET positions of these 3 groups and compare them to historical levels to signal trade opportunities
1- Commercials: Hedgers - We want to trade with them when they're at extreme levels (Think Tyson, Cargill, General Mills, etc)
2- Large Speculators: Hedge funds and large institutions - We want to fade them when they are at max positions (Think suits in NYC and commodity funds)
3- Small Speculators: People/institutions trading small lot sizes not big enough to report to CFTC - We want to fade their max positions as well since they represent the public (Think dude in his PJs trading and small trading firms)
Indicators on Chart:
- The first indicator shows the net positions of the 3 groups above plotted over time
- The second indicator is an index of the relative buying/selling of commercials over a certain lookback period. Anything above 95 is looking for buy, look to sell when it hits 0
- Note: Just because the Commercial's net position is negative doesn't mean it can't be relatively net long and signal a buy (same in the opposite scenario)
Trade Setup - Both Must Happen:
- When commercials are at max levels we are alerted to buy or sell (Depending on the criteria above)
- On a daily chart, use technical indicators, candlestick patterns, news, etc to enter the trade (not shown here)
- Added bonus when the trend is your friend (I use a Multiple Moving Averages indicator to visualize)

oil weekly outlook Continuous downtrend on oil. Currently around the area of 97.75. Waiting for retrace to trend line before continuing down. Crude has tested this current minor structure demand area three times since july 5th. Formed a double bottom on the Weekly timeframe. Waiting for a break and close below current support around $97.00.
With continued recession fears, and demand stopping has been causing oil to fall for the past few weeks. If current support and demand structure broken it will be a confirmation of continued selloff and possible to $60 price range.Waiting to see how it reacts to retracement to the trend line. If it respects the trend line confirmation of continued sell, if it breaks the trend line then wait for pull back confirmation for buy.
China having rising COVID cases and possibly going backdown on lockdown cause cause a continued selloff for oil, making demand a worry for oil. China is one of the nation's top oil importer. China was already on lockdowns earlier this year. On Friday, July 15th President Biden took a trip to discuss oil production in hopes to get gas prices down. He visited Saudi and the market reacted friday to the meeting, expecting very little progress for oil production. Oil rose. On Sunday July 17th a Senior U.S. state department advisor stated middle east nations would being taking extra steps to increase oil production. With the increase from some middle east nations, OPEC + 650,000 increase set for July and August already would be enough to keep oil prices down.

$OIL bet on support holding 👁🗨*This is not financial advice, so trade at your own risks*
*My team digs deep and finds stocks that are expected to perform well based off multiple confluences*
*Experienced traders understand the uphill battle in timing the market, so instead my team focuses mainly on risk management
Oil is in a really good buy zone right now. Crude is trading at $96 a barrel and could head to $93 before reversing. It has been under pressure due to recession fears, omicron concerns, and dollar pressure. Gas prices around the country have dipped, but my team believes that this will be short-lived. We may get a larger oil spike to $130-$140 soon.
Our portfolio as of 7/12/22: $TECS $CRK
If you want to see more, please like and follow us @SimplyShowMeTheMoney

$CRK oil hedge 2.0 👁🗨*This is not financial advice, so trade at your own risks*
*My team digs deep and finds stocks that are expected to perform well based off multiple confluences*
*Experienced traders understand the uphill battle in timing the market, so instead my team focuses mainly on risk management
Recap: Our last time entering this thing was at $20 on 6/9/22! We carefully avoided taking a big hit on this trade by exiting on 6/15/22 at $17.42 per share.
Today my team entered oil company Comstock $CRK again, but this time dirt cheap at $12 per share. Take profit is unknown but the set-up looks extremely bullish!
OUR ENTRY: $12
STOP LOSS: $11
If you want to see more, please like and follow us @SimplyShowMeTheMoney

EURUSD - reopening of the Nord Stream 1 - a major vol event?Talk of an unfolding energy crisis in Europe is well known, but we now come to a more defining and almost binary point in the proceedings – one EUR, commodity and EU equity traders should be aware of as a major event risk.
On 21 July, the Russians will need to make the call to resume the flow of natural gas (NG) through the Nord Stream 1 pipeline – the pipeline, which supplies c.10% of Europe’s consumption was closed this week for maintenance and is due to re-open on 21 July – or at least that is the plan.
Supply through the pipeline that transports NG from Russia to Germany has fallen some 60% since June, due to a mix of sanctions and because a key turbine used to pump the gas was removed and sent back to Canada for maintenance and has remained there due to global sanctions. The Europeans, notably, the Germans and Italians, are concerned the Russians may use the unavailability of the turbine as a pawn to halt the restarting of flow on 21 July.
Various news wires have suggested the Canadians, under some pressure from Germany, have agreed to export the turbine back to Germany, but Gazprom has suggested they’ve not yet seen any documents providing evidence the turbine will be allowed to return. Naturally, the concern is if Russia does not restart the flow, we could see European NG inventories fast depleted, and any hope they could build them through the July to September period, and ahead of the winter, reduced. Talk of gas rationing is certainly elevated and it could significantly impact EU inflation and lower growth. It would make the job of the ECB, which is largely expected to hike rates by 25bp on 21 September, far more challenging.
The Europeans would look to the LNG market as an alternative, but that market is already very tight, with sizeable demand out of Asia.
Current inventory levels are manageable and can supply European demands through the winter period, but much now relies on the future flow from Russia. Russia seemingly holds the cards and will be acutely aware that if they don’t restart the flow then EU NG prices could push from current levels of E180 per MWh and above E200 MWh. In a world where most commodities are trending lower, EU NG prices are appreciating rapidly and with falling growth and consumer sentiment, this is a toxic mix for Europe.
While we can look at relative excepted interest rate settings, terms of trade or other traditional metrics that showcase the relative attractiveness as an investment destination – the simple fact is that EURUSD and EU NG prices are incredibly negative correlated and seem to have the strongest statistical relationship. The 21-day rolling correlation between the two variables is -0.88.
Taking that into account, it almost seems binary that EURUSD will move in anticipation of the outcome of Russia’s decision on 21 July. We can argue that EURUSD is already pricing in a large degree that Nord Stream 1 won't restart immediately, so that needs to be considered.
Of course, in the near-term, the pair will move on other factors but it’s time to put the 21 July and Russia's call on flow on the radar, because FX traders will be watching closely and reacting to headlines – any view that the flow will resume, even at a lower rate than before the recent halt, could lead to relief that Germany (and other nations) may not have to ration gas through the winter period, in turn, driving a market short of EURUSD into 1.0150/1.0200 and pushing the GER40 higher. Of course, if they hold off then it could set a new leg lower in EU assets.
An event risk to put on the radar.
