GAS confirmed breakout!GAS confrimed a nice 4h breakout with high targets. The price is aiming for the 5.50 dollar mark. The war is getting more dangerous and the European President Christine Lagarde is seeking for a import ban of GAS out of Russia.
Take profit: 5.50
stop loss: 4.90
As always, this is no financial advice! Do your own research.
Have a nice Monday!
GAS

GAS: THE Target is 2.26 $After respected to the resistance of EMA 20, Gas continued a downtrend. The target area is 2.26$

NATURALGAS LONGS 📉📉📉📉 As i told you in the last posts, i expect NATURALGAS to reach 5.0 as price didnt closed below 4.5 an improtant psychological barrier.
We are bullish on this asset from a fundamental perspective as we are in a bullish seasonal tendency + military conflict in Ukraine + Russian sanctions that will push price.
Market structure bullish H4/D1 with clear higher highs and higher lows.
What do you think ?

BTU own tennis balls not eggsBTU nice run here although recent offering news caused a quick sell off that was bought right up .
Technically was just a retrace to the 20MA and bounce, forming a cup and handle like pattern
$19.8 zone has been heavy resistance if you're not already in this trade, watch for a short opportunity (rejection) or long (breakout) at this pivot point.
Own tennis balls not eggs - I'm long APR $19 calls and shares

30 Million Shares of BP Post Russian Withdrawal BP is still a macro energy play despite the weeks long sell off. For all you options traders out there looking out for a bottom in commodities markets this might be it. DISCLAIMER No bags, everything was sold two weeks ago, please look at macro & geo-political events before making ANY decisions.

Wait with your new energy contractsGas prices are at an all-time high, in the warmest winter in the Netherlands i can remember, the impact on every day life is starting to become problematic for lots of people, especially the ones that need to renew their energy contracts now. Stay where you are with variable rates. This huge support is about to break on every time frame, if we are lucky we can renew our contracts in May with a price of 0.30ct and a duration of 3 years.

PXJ LONGAMEX:PXJ
The Invesco Dynamic Oil & Gas Services ETF (Fund) is based on the Dynamic Oil Services Intellidex℠ Index (Index). The Fund will normally invest at least 90% of its total assets in common stocks that comprise the Index. The Index thoroughly evaluates companies based on a variety of investment merit criteria, including: price momentum, earnings momentum, quality, management action, and value. The Index is composed of stocks of 30 U.S. companies that assist in the production, processing and distribution of oil and gas. The Index may include companies that are engaged in the drilling of oil and gas wells; manufacturing oil and gas field machinery and equipment; or providing services to the oil and gas industry, such as well analysis, platform and pipeline engineering and construction, logistics and transportation services, oil and gas well emergency management and geophysical data acquisition and processing. The Fund and the Index are rebalanced and reconstituted quarterly in February, May, August and November.

$XOPCup waiting to form handle. With that said I would look for upside to this gas & oil etf until April/May then we should see a dip into the handle into the summer. So in my opinion gas & oil prices rise until the summer and drop until August if this pattern holds true.
CHART LEGEND:
white dashed lines = bull/bear takeovers
blue lines = call targets
yellow lines = put targets
red line = danger zone
orange lines = trend lines
green lines = safe zone
any other lines add will be discussed with the ticker
AMEX:XOP

$BKROn the bigger picture I want to say this is an inverse head and shoulders. Pay attention for this to break further to the upside. With oil prices rising $BKR supplies rig companies with the equipment to operate.
CHART LEGEND:
white dashed lines = bull/bear takeovers
blue lines = call targets
yellow lines = put targets
red line = danger zone
orange lines = trend lines
green lines = safe zone
any other lines add will be discussed with the ticker
NASDAQ:BKR

Europe Looks Beyond Russia for Natural Gas. LNGIt takes a brave investor to bet on the outcome of Vladimir Putin’s saber rattling around his neighbor Ukraine. One result of the Ukraine crisis seems more predictable: The European Union will look to cut its dependence on Russian natural gas, which currently accounts for 40% of consumption. Companies from Norway to Texas might benefit.
The simplest way to replace Russian flows, if you were sitting over a game of Risk on a rainy afternoon, would be U.S. liquefied natural gas. America has more gas in the ground than it can use domestically. LNG output jumped 42% year on year in the first half of 2021.
It could climb another 80% over the next five years, says Randy Giveans, head of energy maritime equity research at Jefferies. Top producer Cheniere Energy LNG+0.12% is earning $100 million on every shipload right now, Giveans estimates. Its stock has risen by two-thirds over the past year.
The first position was bought last Friday at 116$. Long-term deal.

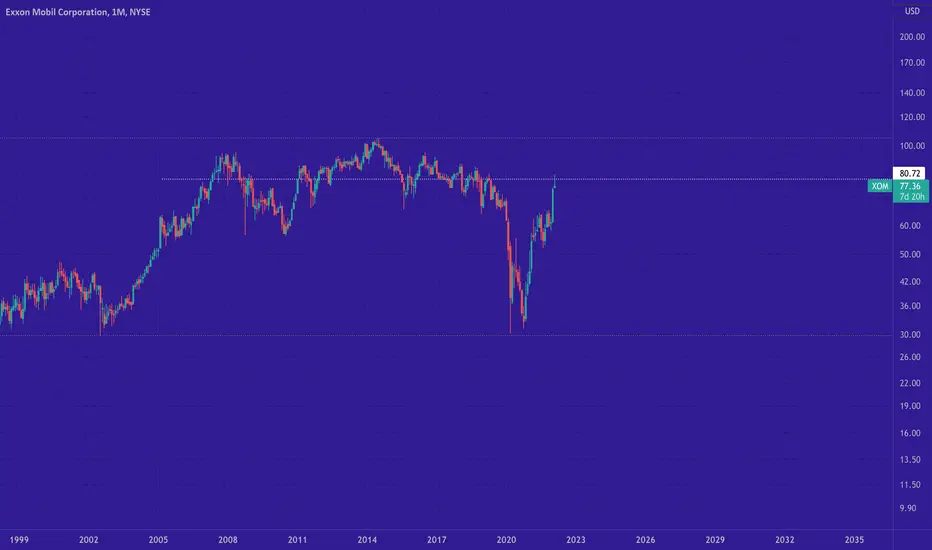
Exxon ~ XOMExxon let's watch for a short with a LIS at 81.
This one has lots of resistance around 80.
Oil Weekly OverviewHello Traders,
For the commodities, I generally look at price action starting from high time intervals to low.
To follow energy commodities, WTI always comes first for me.
My analysis about commodities is not only technical but also fundamental.
After the lockdowns Oil demand indeed accelerated and that directly affected Oil price.
In the mean time US used its national reserves to set the price in a level but that wasn't really successful.
Palliative actions does not create stable solutions.
Hard winter for Northern Hemisphere increased the demand of energy commodities.
And other aspect that effects Oil price is politics.
Russia is a major player in the field and as a playmaker role, Russia can directly effect prices.
Europe needs Russian natural gas so bad and Russia is decisive about its pipeline because they don't want to pay commission to Ukraine while sending gas to Europe by North Stream.
That's why they built North Stream 2 which sends Russian gas directly to Europe.
BUT
US does not want Russia send gas through North Stream 2 without Ukraine to be paid. Meanwhile US supported Europe by sending tens of LNS vessels which also increased Henry Hub gas prices.
With all that conflicts,
US wants energy prices lower because of inflation,
Russia wants to send gas through NorthStream 2
Europe need cheap gas
bla bla..
The most important aspect is that, USD is not valuable enough for the world right now comparing to the commodities, metals, energy, housings, for each item that people need to have.
and that means inflation...
Thanks and have a nice weekend.

Long NATGAS short term optionNatural has been on a decline ever since their recent high of 5.3.
Price is heavily oversold here.
We can see that the trend has recently left the falling flag and most recently breaking out of the descending triangle, recording a positive RSI divergence there too.
Currently on a important resistance level and my first target is the resistance up in a area around 4.5.

✅GAS WILL KEEP GROWING|LONG🚀
✅GAS is trading along the rising support
And as the pair is retesting it
I am expecting the price to go up
To retest the supply levels above
LONG🚀
✅Like and subscribe to never miss a new idea!✅

NATURAL GAS Potential Long! Buy!
Hello,Traders!
NATURAL GAS is trading in an uptrend
Along the rising support line
And as the gas will soon retest it
I think its a good long trade opportinity
Buy!
Like, comment and subscribe to boost your trading!
See other ideas below too!

all depends on today for the GAZPROM stocks Today, despite the absence of volume, is a very important day in the GAZPROM market as it is expected that there will be a very strong indication of what will happen in this market in the coming days because the candle approaches VWAP when it bounces, it will be a signal to buy, but if it breaks down, it will be a real signal to sell.
so don't sleep today...
good evening.

sell on natural gasslight pause in the market from sell off yesterday morning after pullback from hidden bearish divergence on the 1hr. hidden bearish means continuation of the sell. going for about 2oo pips down to the demand area. around price 4.0100. the price varies with your broker, if you enter on meta trader app ngas does have a different price spread.

USDGAS LONGS 📉📉📉📉 Expecting bullish price action on this assset as price get out of the range, making higher lows and higher highs meaning that bulls are in power in this area. Price could retrace back into 4.0 as psychological area + discount market area fiboncai that sets perfect long opportunities.
What do you think ? Comment below..


SM Energy Looking Great for Moves HigherSM Energy continues to look very bullish with a longer-term cup & handle-like pattern and recent ascending wedge that should move to the upside.
Target around 60$

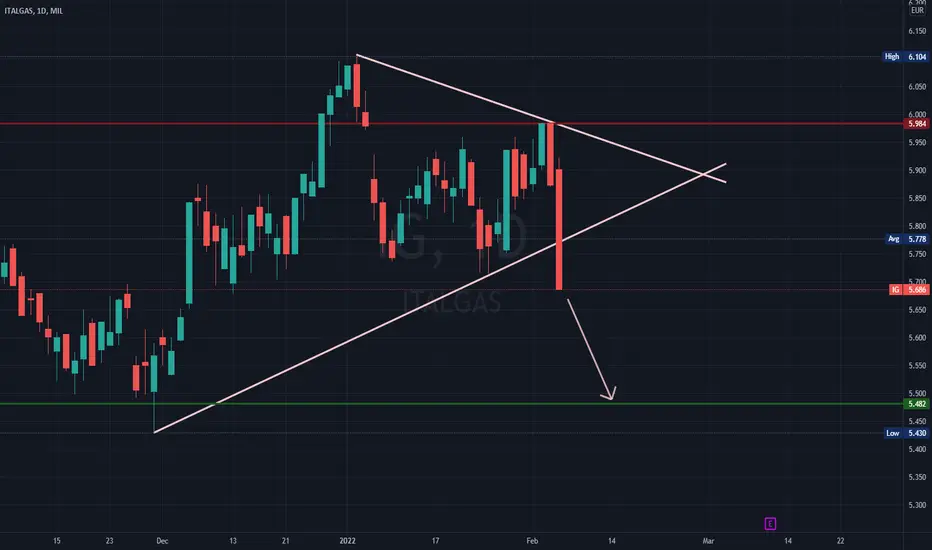
Italgas (IG.mi) bearish scenario:The technical figure Triangle can be found in the Italian company Italgas S.p.A. (IG.mi) at daily chart. Italgas S.p.A. is an Italian company specialised in the distribution of natural gas. It is listed on the Milan Stock Exchange and included in the FTSE MIB index. The Triangle has broken through the support line on 04/02/2022, if the price holds below this level you can have a possible bearish price movement with a forecast for the next 15 days towards 5.482 EUR. Your stop loss order according to experts should be placed at 5.984 EUR if you decide to enter this position.
Italgas and Buzzi Unicem have signed an agreement for the development of a feasibility study on the implementation of Power to Gas plants in combination with Carbon Capture Systems at Buzzi Unicem's production plants. The implementation of these technologies is aimed at promoting the decarbonization of cement and concrete production processes in order to increase environmental sustainability and facilitate the energy transition.
Risk Disclosure: Trading Foreign Exchange (Forex) and Contracts of Difference (CFD's) carries a high level of risk. By registering and signing up, any client affirms their understanding of their own personal accountability for all transactions performed within their account and recognizes the risks associated with trading on such markets and on such sites. Furthermore, one understands that the company carries zero influence over transactions, markets, and trading signals, therefore, cannot be held liable nor guarantee any profits or losses.
US Oil - Long term short positionOn the weekly RSI you can see clearly the negative RSI divergence which took place 4 times on the trott. Each time it followed a relativelly controller correction. This IMO has a huge change of occuring again and hence the short position.
I've noted some of the important long term trendlines and resistances which support my case.

NG Natural Gas Bullishafter last trade i was waiting for the gap to be filled and then i longed again. extremely Bullish it seems
