Natural gas - trend resumptionLast assumption re triangle proved wrong.
Correction in the wave 4 (circled) of a larger third wave seems to take the form of a double zigzag.
Note the channel for the wxy, as well as the channel for the wave y (abc structure) - on the right-side chart.
I wait for the impulse and a correction in the waves 1-2 to take a long.
Good luck!
GAS

GAS/BTC GAS will to start moooove to the moon... all of us do not trust fo it but it will be in a short time ...

Natural gasBuy only if candlestick cross up yellow line and stay above yellow line.
TP Goals 5815 and 5900

KMI - Kinder Morgan Swing Trade
Kinder Morgan, is one of the largest energy infrastructure companies in North America. The company specializes in owning and controlling oil and gas pipelines and terminals. Kinder Morgan owns an interest in or operates approximately 85,000 miles of pipelines and 152 terminals.
As winter approaches, supply chain issues begin to resolve, holiday season is near, expect major energy usage and KMI to go up from this more than fair price.
RSI is showing now is an ideal entry, and Squeeze Indicator is showing good upward momentum

Oil Finds Strong Support at $80Oil dipped, breaking a key support level at 80.70. We saw further support (confirmed by a green triangle on the KRI) from 80.00, however, and have rebounded back to the 81 handle. We appear to be making a run for the next level at 82.13. The Kovach OBV has dipped sharply, but has since picked up to reflect the support. If we can break past 82.13, we will return to a previous value area, and 83.21 would be the next target after that. Further momentum would bring us to the vacuum zone back to highs at 85.55.


Oil Continuing to RangeOil has retraced from just below highs at 85.55 to seek support at 82.13. This is exactly what we anticipated would happen. We are just past the 50% retracement between highs and the lower bound of the range at 80.70. Several green triangles on the KRI suggest that support will continue, and we will level off. If not, expect further support at 81.30, then 80.70. The Kovach OBV is oscillatory, which is to be expected as oil appears to be exhibiting a broad sideways corrective wave to the overall bull impulse wave which brought us to the 80's in the first place. Anticipate another run for 85.55 if the bull trend picks up again.

OIL- WTItis is clearly the impulsive elliott wave count on OIL
i will only invest in OIL under one condition which is waiting for a pullback to long again. 78.30-76.50 is the area im looking for
wich represents previous wave 4.

ng buyThe world is demanding energy for an economic recovery and a winter in Europe.
Natural gas prices have been rising in recent months, due to the great demand for various factors, including the search for and implementation of cleaner energies, in this process some countries such as China are entering a stage of de-carbonization, In China's attempt to gradually reduce the use of coal, natural gas is becoming more in demand, the key factor behind the rise in natural gas prices is its demand, the European Union is also stopping the use of coal and needs to supply This energy need with other means, until generating a dependence on natural gas, this benefits Russia a lot since they are one of the largest gas producers and as in OPEC they can manipulate the supply, in some geopolitical scenarios it would benefit them to pressure the European Union in certain gas pipeline projects.

XOM XOM may pop on earnings today. Oil and Gas, still a hot sector.
Not investment advice. Educational purposes only.

PXD - Pioneer Natural ResourcesStarted half-sized position. Gapped up over anchored VWAP and inside pivot point. Looking for oil and gas stocks to come back alive after strong runs and holding up well. Crude oil still very strong. Stop loss below Monday's low & anchored VWAP.

Bitcoin and Oil - Your gas prices are not going to get Lower.Today a small lesson in the harsh reality of this world.
Gas prices are on the rise as you know, same with oil, coffee, lumber, and many other things.
This may seem like "Not a big deal" however, oil prices could go parabolic over the next 8 years.
When Bitcoin broke out of its falling wedge it shot all the way up to $20,000 (starting at around $250)
Oil should see a similar move as bitcoin.
OIl moves slower than Bitcoin (much slower) but this move will still catch the world by surprise!
You must counter hyper inflation with proper investing.
If you don't play their game you get left behind in the dust.
Stay profitable.
- Dalin

natural gas short directiion
natural gas expected to reach : 5.327
its not buy or sell signal CAPITALCOM:NATURALGAS

Gas looking for another dump and then blastin that chart i have shown my opinion that gas will form a HS and looking for 80 % rise

Gas Long SetupGAS Long Setup
🔵 Entry Level: $5.673
🟢 Take Profit: $6.094
⛔ Stop Loss: $5.441
Reasons:
- So far the price is respecting the ascending channel;
- I believe the price may bounce off the lower trendline in the area between $5.535 and $5.670.
Game Plan: If the price goes through the lower trendline (yellow), which at the moment acts as a support level, then I will be looking to open a short position on a retracement unless the 2nd trendline (white) acts as another support level.

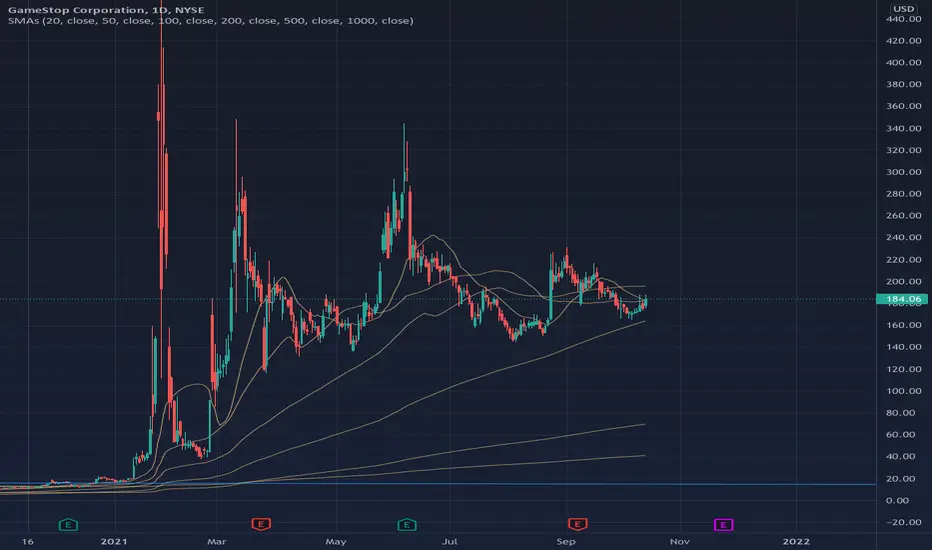
$GME: "Weaponized Commodity Markets" Could Mean Another SqueezeAs crude oil sits in a very vulnerable position, Putin has come out declaring it could head to $100 and while China contemplates the scale of a potential Evergrande bailout, there's a serious potential risk here that the inflation trade will continue thus leading to another squeeze out of GME which has been an efficient barometer for inflation since it's grand squeeze in January. However, it isn't just the movement of liquidity that could benefit the prospects of GME. If sky-high gas prices are here to stay, another stay-at-home windfall could push GME back into the 200 pivot or even beyond as reopening vacation plans get shelved.
✅NATURAL GAS LOCAL SHORT🔥
✅NATGAS broke the local horizontal key level
And is now retesting it form below
I think that a local bearish reaction is possible
Because gas is relatively overbought
So a correction is viewed as healthy
SHORT🔥
✅Like and subscribe to never miss a new idea!✅

Gas (GAS) - October 13Hello?
Welcome, traders.
By "following", you can always get new information quickly.
Please also click "Like".
Have a nice day.
-------------------------------------
If you are not investing in NEO coin, it is recommended to trade from a short-term perspective.
(GASUSD 1W Chart) - Mid-Long-Term Perspective
Above the 2.7958587-4.5773071 section: The upward trend is expected to continue
(1D chart)
First resistance zone: near the 9.3918546 point
Second resistance section: 12.2783948-13.7215147 section
Support section: 5.0621946-6.505416
We need to see if we can break out of the downtrend line by holding the price in the 9.3918546-12.2783948 zone.
If it rises in the second resistance section, the uptrend is expected to accelerate.
If it falls from the support zone, it may enter the mid- to long-term investment zone, so careful trading is required.
However, it is necessary to touch the 2.7958587-4.5773071 section and check whether it rises to the support section with a sharp rise.
I think this is a move that shows that it is forming a strong support zone.
------------------------------------------
(GASBTC 1W chart)
(Enlarge: )
Above 0.0004990 point: Expected to create a new wave.
(1D chart)
It is important to have support in the 0.0001440-0.0001753 zone.
------------------------------------------
We recommend that you trade with your average unit price.
This is because, if the price is below your average unit price, whether it is in an uptrend or in a downtrend, there is a high possibility that you will not be able to get a big profit due to the psychological burden.
The center of all trading starts with the average unit price at which you start trading.
If you ignore this, you may be trading in the wrong direction.
Therefore, it is important to find a way to lower the average unit price and adjust the proportion of the investment, ultimately allowing the funds corresponding to the profits to regenerate themselves.
------------------------------------------------------------ -----------------------------------------------------
** All indicators are lagging indicators.
Therefore, it is important to be aware that the indicator moves accordingly as price and volume move.
However, for the sake of convenience, we are talking in reverse for the interpretation of the indicator.
** The MRHAB-O and MRHAB-B indicators used in the chart are indicators of our channel that have not yet been released.
(Because it is not public, you can use this chart without any restrictions by sharing this chart and copying and pasting the indicators.)
** The wRSI_SR indicator is an indicator created by adding settings and options to the existing Stochastic RSI indicator.
Therefore, the interpretation is the same as the traditional Stochastic RSI indicator. (K, D line -> R, S line)
** The OBV indicator was re-created by applying a formula to the DepthHouse Trading indicator, an indicator disclosed by oh92. (Thanks for this.)
** Support or resistance is based on the closing price of the 1D chart.
** All descriptions are for reference only and do not guarantee a profit or loss in investment.
(Short-term Stop Loss can be said to be a point where profit and loss can be preserved or additional entry can be made through split trading. It is a short-term investment perspective.)

GUSH pullback then retest recent highsGUSH (2x BULL Oil/Gas ETF) Macro events are evident and rising that would suggest a further rise in gas/oil prices. Looking at the chart GUSH appears to be consolidating nicely headed to the $107.70 s/t support area. If the $107.70 is broken I would be looking for a bounce from the $103.66 area. This could be a great long term play but I would recommend taking profits quickly, due to the high volatility of leveraged ETF's. This is not financial advice, if you have any insights they are welcome in the comments. Happy trading :)

NATURAL GAS Will Go UP! Buy!
Hello,Traders!
NATGAS is wildly bullish lately
And the price is retesting a horizontal support
I don't think that the rally is over
So I am betting it will go up
To retest the recent high
Perhaps it will go on to break it too
And go even higher
Buy!
Like, comment and subscribe to boost your trading!
See other ideas below too!

✅NATURAL GAS BULLISH PENNANT|LONG🚀
✅NATURAL GAS is trading in a massive uptrend
Due to the fundamental reasons
Pushed even higher by a massive short squeeze
In the options market to make matters worse
And now the price seems to be forming
A bullish pennant pattern on the 5H timeframe
So If we see a bullish breakout
That means that the price
Will keep going higher
LONG🚀
✅Like and subscribe to never miss a new idea!✅

No One Should Be Surprised That Energy Prices Are ExplodingMark Fisher was a presence in the natural gas futures arena in the days before electronic trading, racking up profits that made him very wealthy.
On Wednesday, September 29, Mr. Fisher told CNBC that he does not see the November natural gas futures contract coming off the board below the October contract, making the $5.50 to $5.80 level a bottom. He warned that an early cold winter could take the price to $12 as consumers in the US follow European and Japanese consumers, “freaking out” about the supply situation in the natural gas arena.
When it comes to crude oil, Mark Fisher said that NYMEX crude oil demand remains robust, and the weather is cold, the price could move from $75 to over $100 per barrel level. He went on to say that “people have been spoiled by low energy prices.” They could be in for a shocking surprise. Meanwhile, no one should be shocked as the seeds for a bull market in the energy sector were planted on January 20, 2021.
It took decades to achieve energy independence in the US
It took months to surrender it to OPEC+
Green is the future; fossil fuels are the present
Crude oil is trending towards the triple digits
Natural gas is a wild beast
It took decades to achieve energy independence in the US
For those of us old enough to remember the gasoline lines in the 1970s and the odd and even plate days where you could only fill your tank on certain days, that period marked the beginning of the US’s quest for energy independence. Over the past half-century, the country made great strides.
US ingenuity and technology allowed the nation to process corn into biofuel. The government mandates that support energy and agriculture reduces Middle Eastern crude oil imports. In the late 1970s, many young people headed for Alaska for high-paying jobs to extract petroleum from the earth’s crust and construct pipelines that carried the energy commodity to the lower forty-eight states.
Over the recent years, the US not only achieved energy independence but became a leading energy exporter. Technological advances in fracking and drilling increased output while lowering production costs. Discoveries of quadrillions of cubic feet of natural gas in the Marcellus and Utica shale regions increased reserves. Since necessity is the mother of invention, technology allowed for processing natural gas into liquid form to travel beyond the pipeline network. Today, LNG moves from the US via ocean vessels to regions worldwide where the price is substantially higher.
In March 2020, the US became the world’s leading crude oil producer with output of 13.1 million barrels per day, surpassing Russia and Saudi Arabia and pushing OPEC, the international oil cartel, into an abyss. Pricing power was in the hands of US producers with the ability to turn on production when prices rose and turn it off and turn to imports when it fell.
It took decades, but the US achieved the goal.
It took months to surrender it to OPEC+
On the campaign trail in 2020, President Biden pledged to address climate change by enforcing an energy policy that would favor alternative energy sources. Calling climate change an existential threat to humanity was a critical focus of the Democrat’s platform.
On his first day in the Oval Office, the new President issued an executive order canceling the Keystone XL pipeline project that carried petroleum from the Canadian oil sands in Alberta to Steele City, Nebraska, and beyond to the NYMEX crude oil delivery hub in Cushing, Oklahoma.
In May, amid rising energy demand, the administration banned fracking and drilling for oil and gas in Alaska. By August, the administration asked OPEC and Russia to increase production from current levels. The cartel summarily rejected the request.
In March 2020, the US was an energy powerhouse. In September 2021, it surrendered control to other worldwide producers. After suffering under the weight of shale oil and output over the past years, OPEC+ is now positioned to squeeze higher prices from US and other consumers. It took less than one year and one-half for the balance of power to shift.
Last week, US generals and military leaders told Congress the US lost the twenty-year war in Afghanistan. It took less than eighteen months to lose control of energy.
Green is the future; fossil fuels are the present
There is no doubt that alternative energy is the future. It will take decades to fund and build wind, solar, nuclear, and other alternative energy sources to the point where fossil fuels are obsolete. Crude oil and natural gas may eventually go the way of whale oil. However, most cars in the US and worldwide continue to run on fossil fuels, which is not changing any time soon.
There are roughly 250 million vehicles in the US. The number has been stable over the past years. According to the US Energy Information Administration, 78% of the vehicles sold in the US will continue to run on gasoline twenty-five years from now.
Crude oil and natural gas continue to power the world. Fossil fuels are essential for industry and individuals. Increased regulations and policies to curb output will only serve to push prices higher, as we have seen over the past months. Moreover, no rational company is going to invest in US hydrocarbon production given the regulatory environment. OPEC and Russia are in the driver’s seat with their hands on the pricing wheel.
Anyone shocked by the price action in crude oil and natural gas futures markets likely thought that political promises to address climate change would never occur. This time, they were dead wrong.
Crude oil is trending towards the triple digits
US production put the former President in a position to ask OPEC+ to cut production when the price of crude oil fell like a stone at the beginning of the 2020 global pandemic. OPEC and Russia reduced output by an unprecedented 7.7 million barrels per day. NYMEX crude oil fell to a record low at negative $40.32 per barrel briefly before turning higher.
The monthly chart of nearby NYMEX crude oil futures highlights the explosive move from negative $40.32 in April 2020 to the most recent high at $76.98 in early July 2021. After correcting, crude oil has been moving towards a test of the recent high, trading to $76.67 per barrel last week and closing near the $76 level. The recent high was marginally above the peak from 2018 at $76.90, a technical gateway to the next resistance level from 2014 at over $100 per barrel.
NYMEX WTI crude oil futures are the pricing benchmark for around one-third of the world’s petroleum producers and consumers. The other two-thirds, including the Middle East, use the Brent futures benchmark.
The chart of nearby Brent crude oil futures shows the price reached the lowest price of this century at $16 per barrel in April 2020. Last week, it probed above $80 for the first time since October 2018. Technical resistance stands at the 2018 $86.74 high, a gateway to a triple-digit price for Brent crude oil.
OPEC+ would rather sell one barrel of crude oil at $100 than two at $40 per gallon. It would be comical if it weren’t tragically ironic that when the US administration asked the cartel to cut production, it rejected a request to increase output by the next administration after cooperating with the previous administration’s request for a production cut.
Natural gas is a wild beast
Crude oil has rallied substantially since April 2020 and was sitting at the highest price since 2018 at the end of last week. Natural gas, the other energy commodity the US had dominated, has gone ballistic on the upside.
In June 2020, natural gas fell to its lowest price in a quarter of a century when it traded at $1.432 per MMBtu.
At the low, the ultimate value investor put $10 billion into the natural gas market. Warren Buffett’s Berkshire Hathaway bought the transmission and pipeline assets from Dominion Energy for $6 billion in assumed debt and $4 billion in cash. The deal was announced in early July 2020. Mr. Buffett bought the low.
The monthly chart shows the parabolic rally that has taken natural gas from $1.432 in June 2020 to a high of $6.318 per MMBtu last week. While natural gas pulled back to around the $5.50 level, the price was still nearly quadruple the level when Warren Buffett increased Berkshire’s exposure to all interstate natural gas transmission in the US from 8% to 18%.
In an interview on CNBC on Wednesday, September 28, Mark Fisher said that, given the demand situation in Europe and Asia, a cold winter in the US could push natural gas futures as high as $12 per MMBtu, a level not seen since 2005 and 2008. Mark Fisher knows the natural gas market as he was the most successful energy floor trader on the NYMEX exchange before electronic trading.
Are you surprised that crude oil and natural gas prices are exploding and are likely to move much higher over the coming months and years? You shouldn’t be; it is just the elected US government fulfilling its promises at the top of the 2020 platform. We expect higher lows and higher highs to continue as US energy policy is the most significant factor for the coming years. OPEC+ is back in control, and the cartel’s mission is to provide its members with the highest price possible while “balancing” supply and demand in the energy market. With the US production declining as it takes a greener path, many will be walking rather than driving on the road to shortages and higher prices.
Join us for the next Monday Night Call using the link below. You can also gain early access to these articles by following the other link below.
Trading advice given in this communication, if any, is based on information taken from trades and statistical services and other sources that we believe are reliable. The author does not guarantee that such information is accurate or complete and it should not be relied upon as such. Trading advice reflects the author’s good faith judgment at a specific time and is subject to change without notice. There is no guarantee that the advice the author provides will result in profitable trades. There is risk of loss in all futures and options trading. Any investment involves substantial risks, including, but not limited to, pricing volatility , inadequate liquidity, and the potential complete loss of principal. This article does not in any way constitute an offer or solicitation of an offer to buy or sell any investment, security, or commodity discussed herein, or any security in any jurisdiction in which such an offer would be unlawful under the securities laws of such jurisdiction.

Could Crude at $100 per Barrel Be a Reality?The question of the U.S. Debt limit is off the agenda at least for two months after President Joe Biden signed a funding bill to prevent government shutdown and allow funding through to December 3. Investors held their breath last week to see where stock indexes would land, and the answer is they rebounded by 0.82-1.43%.
The new week starts with the OPEC+ meeting amid expectations that the oil cartel and its allies would rise crude production above the scheduled 400,000 barrels per day limit. OPEC+ may revise quotas for November as the demand for crude rose unexpectedly high. Western countries are the most worried about rising crude prices and consider that the additional volumes of crude production may bring prices down sharply. Brent crude benchmark prices recently spiked to $80.75 per barrel.
However, some believe that the gas crisis and soaring gas prices may instigate crude prices to jump to $100 per barrel, and this may spur a global economic crisis, according to the Bank of America cited by Bloomberg.
The price for gas in Europe is already an equivalent to the price of crude at $190 per barrel. Several European gas-consuming companies have filed for bankruptcy. Crude prices have only 10% left from the peaks of 2018. If Brent crude prices would hold above $86-87 per barrel technically such targets could be achieved, and may move Brent crude prices even above $115-117 per barrel.
However, it is too early to dive into wishful thinking as we have the situation now, and now we are at the important crossroads as the resistance line that started in 2008 and is crossing peaks in 2012 and 2014 is crossing the level of $79-80 per barrel, where the current Brent crude price is located. So, price is testing this resistance for the fourth time now, while the last time was in 2014, which makes a huge gap of 7 years. So, we may not consider as certain that this time this test would finally lead to a breakthrough. So, we may not also exclude the possibility that the price would fail to hold above $80 per barrel and would follow the 13-year downward trend. In this case Brent crude prices may plunge to $70 per barrel, at the support line of the trend that started in March 2020.
