GAS

$GAS/BTC (Binance Spot) Descending channel near breakoutGas (also known as NeoGas) downtrend seems to have ended, let's swing that!
Current Price= 0.0000581
Buy Entry= 0.0000584 - 0.0000544
Take Profit= 0.0000936 | 0.0001379 | 0.0001754
Stop Loss= 0.0000415
Risk/Reward= 1:2.5 | 1:5.47 | 1:7.99
Expected Profit= +65.96 | +144.50% | +210.99%
Possible Loss= -26.42%
Fib. Retracement= 0.382 | 0.618 | 0.786
Margin Leverage= 1x
Estimated Gain-time= 1440h

NATURAL GAS : Price Action on Daily TMF , Price GROWTH ! 🔔Welcome back Traders, Investors, and Community!
If you LIKE this analysis, Please support our page by hitting the LIKE 👍 button
Feel free to request any pair/instrument analysis or ask any questions in the comment section below.
Good trading at everyone!

BP - Range BoundBP bounce off key support created a opportunity to buy on the pinbar candle off support. I waited for the pin off and retest of support for my entry, this is the most conservative entry on a pinbar setup. You can enter at close of pinbar to aggressively enter the market. I waited for confirmation of TRND Bot buy signal! Clean charts = Clean profits! Long calls to $25.
If you like this idea follow for more and hit that like button! Good luck! Trade smart! Cheers!


1inch - Just Buy the Dip1inch - Just Buy the Dip - 1inch has over 1/2 of the TVL as Uniswap - lower gas fees and trades at a quarter of the price.

Short Term Money MakerThis play has great potential. I LOVE it below $3.50 but I still like it below $4.00... Their last quarter earnings they performed great and on track. Income Statements are good, Balance sheet good, Cash Flow shows they are profitable, and debt to asset below 100 ... This is GOLDEN!!!!

BPH UPDATED POTENTIAL RALLY SOONPEP11 Approval still in play. I expect a clear breakout of this pattern anytime soon.
Entry: 12.5c
Exit: 40-80c

SELL NATURAL GAS BELOW 9 EMA FOR 200 EMASELL NATURAL GAS BELOW 9 EMA FOR 200 EMA CONSIDERING UPCOMING SHORTAGE IN DEMAND DUE TO DECRESING COLD IN UPCOMING WEEKS.

SELL NATURAL GAS BELOW 9 EMA FOR 200 EMANATURAL GAS PRICE HAS BOUNCED FROM 9 EMA ON DAILY CHART. THE BOUNCE WAS ALSO SUPPORTED BY COLD STORM STARTED ON THURSDAY. THE BOUNCE WAS NEUTRALISED BY THE DOUBLE HEAD FORMATION AND SELLING HAS ALREDY BEGUN. I MY VIEW SHORT POSITION CAN BE OPENED BELOW 9 EMA FOR 200 EMA TARGET CONSIDERING LESS DEMAND IN COMING WEEKS.

MMP is looking bullish NYSE:MMP is looking bullish, 200 MA and 50 MA are crossing and the stock is trading above 20 MA. The anticipated price movement is shown on the chart, buy now or wait for retest of the 50 MA with a trailing stop daily close below 50 MA, a break of 50$ confirms target around 60$.
Hit the like button please if you find this useful :)
This is only my own view and not financial advice, do your own analysis before buying or selling
Happy Trading!

Continuation of investment, NG cycle move.We went from 1.5$ which was called during the end of June to 3$, this move is far from over and I expect continuation to 4.4 by 2022 and maybe higher.

BPH Energy (BPH) Potential Big Move+ Support at .15
+ .618 Fib hold, next leg up unto 60c - 1$
+ Could reach 1.5$ by end of March
+ Holding short term moving averages
+ Candle Patterns looking very bullish, and likely for more significant uptrend continuation
* FUNDAMENTALS ARE LOOKING STRONG SHORT - LONG TERM
*Disclaimer: Not financial advice
* I took a position here at .15, looking to exit at 1$ - 1.5$ depending on what plays out, might hold or sell. below 13c may be a concern.


Gas is loooooing bullish ^_^ Guys get bags and e readY 1-748 sats
2-845 sats
3-954 sats
PS : I'm not a financial adviser, this is my own personal opinion that I do share with you guys for FrEe !!

YATEC (MOEX:YAKG) - THE POTENTIAL UNICORN AT THE LNG MARKETI`m always on the lookout for unicorn companies that can have significant capitalization growth. I`m particularly interested in the oil and gas sector, as it is currently undergoing a dramatic transition from oil to liquefied natural gas. Observing all the projects being implemented for the LNG, I found a company that is located in a rather interesting place relative to the key sales markets - Asian markets.
YATEC – is a leading Russian independent gas company that operating in the Republic of Sakha (Yakutia), Russian Federation.
YATEC engages in the exploration, extraction, processing, and sale of natural gas and gas condensate. Its products include stable gas condensate, heavy heating oil, gasoline, and diesel fuel. It also involves ingeneration and sale of electricity and heat. The company was founded in 1963 and is headquartered in Yakutsk, Russia
Currently YATEC implementing Yakutsky LNG project that is quiet similar to Novatek projects.
If we compare the dynamics of changes in the value of YATEC shares with Novatek shares, we can clearly see the correlation. YATEC is actively implementing the LNG project.
According to newsroom:
BRIEF-Russia's Yatek Increases Area Of Subsoil Use In Yakutia By 23 Times
Russia's Federal Agency for Subsoil Management Rosnedra says:
* ENERGY COMPANY YATEK WON 3 ROSNEDRA AUCTIONS AND INCREASED AREA OF SUBSOIL USE IN YAKUTIA BY 23 TIMES - ROSNEDRA
* YATEK OBTAINED RIGHT TO USE SUBSOIL IN NORTH, SOUTH AND MAYSKY BLOCKS WITH TOTAL AREA OF 43.5 THOUSAND SQUARE KM - ROSNEDRA
I suppose that its a good trigger for buying the shares. YATECs total resources with increased area of subsoil are more than 800 billion cubic meters of naatural gas.
I suppose its enough for LNG Project.
So, I`m in, buying for long.
My first target is 10x - 500 - 600 RUB/share

Warren Buffet Suncor Energy $SU taking off price target 30-40$ Crude oil said to rise to 65$ by the end of summer according to bloomberg analysts. Suncor Energy $SU taking off price target 30-40$. Warren Buffett currently owns this stock. Also check out ticker $XEG.CA for canadian energy oil gas etf.


SUNCORE ENERGY finished 30 years grandsuper cyclehello everyone,
as you can see Suncor energy has almost finished a 30 years elliott wave grand super cycle, (almost since i was born ^^) and the giant oil and gas company took a hit as many leading company in the oil industry, i think it is going to take a lot of time to recover, but i believe this company is too big to fall, also i believe it is a golden opportunity for investors who want to invest in the long term, you can buy for the cheap price and get a dividend and also benefit if the price goes up, for technical analysis the stock is in the last stages of huge correction and long term investors who wants to buy at these levels should not worry if the price drop deeper, i believe there will be no way in the future to replace oil or gas..
good luck , please leave a like

NG1! : NATURAL GAS ... LONG ... Don't miss itNICE 7-SWINGS DOWN, ... Perhaps its time to get back INTO GAS,
LOOKs like a BUYING opportunity.
Monitor price action and Volume CYCLE ... try using ticker UNG (ETF)

XOP Watch $72 level - making handle or taking off now?Like MJ sector two weeks ago, XOP is close to a breakout after a double bottom. The only question is will there be a handle or shoot straight up.


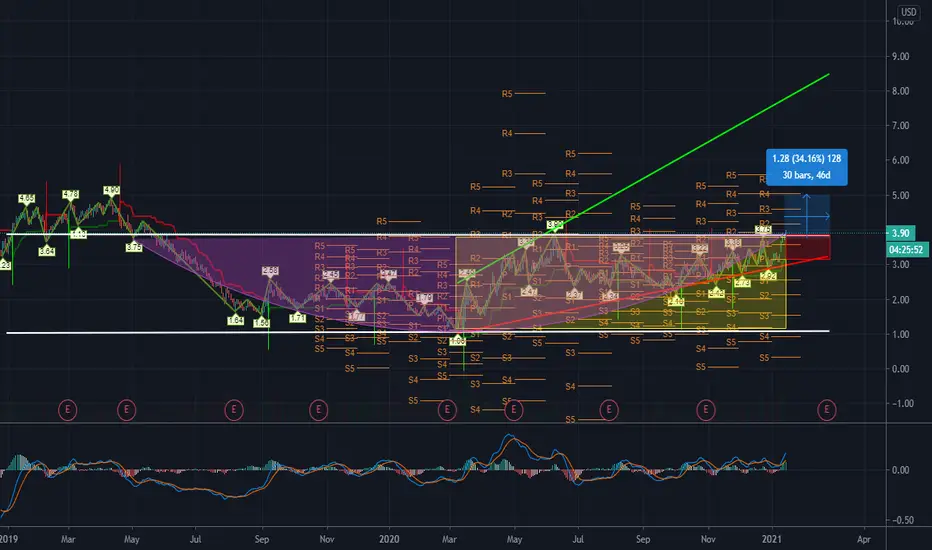
Trade Alert: SWNPromising swing trade here.
Cup formed. Reversal of trend since March 2020. This broke 3.75 so now heading towards a $1 price increase, so I believe about 25% upside here.
Falls below $3.3 and it exit time though.
*Please hit like if you find this post useful, thanks!*