XOP fractalOil prices have been on a tear lately, driven by a combination of travel recovery and inflation expectations. Oil and gas stocks have been rising along with them. (Other commodities prices are climbing as well, by the way, which bodes well for value stocks for the foreseeable future.)
Oil and gas companies still looks reasonably valued, with roughly 10-15% upside to median valuation of the last 4 years. The space still offers some of the best dividends available, even after a number of companies made dividend cuts last year. However, companies in the space are also still financially pretty weak. Free cash flow has plummeted toward zero even on some of the most secure oil majors. So there's definitely some risk.
In technical terms, I noticed that XOP looks to be making a repeating fractal pattern. If the fractal continues, then we ought to see the price rise more or less straight up from the current close of $72 to my target at about $80, before pulling back toward the trend line. Be aware that I've not traded fractals much, so I don't really know how likely this is to play out. Just posting the idea here for future reference.
GAS


GAS Testing Support Level - Long OrderGAS Testing Support Level - Long Position
Entry: $2.566
TP & RR: $2.673 (2.49)
Stop Loss: $2.523
REASONS FOR THE TRADE
This looks a lot like the infamous " market maker method ", so I am expecting the price to continue trending down even below my entry zone. The logical question is then why are we opening a long trade? Well, if this support holds and I believe it will, even for a short bounce, then the RR is pretty decent if the price reaches the upper trendline. We can then open a short order with a SL just above it.
My SL here is very tight and I do warn you that you may get stopped, so adjust it accordingly. I will use slightly less than my traditional trading size, thus limiting my loss, and be able to re-enter again if the setup turns out to be valid.

ENLink MidStream Homerun Long!Details in photo looks like a good buy right now after checking on a few things. My notes aren't 100% fact. Just understand that these are my personal notes and should not be taken as professional advice!

NATURAL GAS Breakout. Will FALL. SELL!
Hello, Traders!
Natural Gas has reached a strong resistance level
And broke out of the bear flag after hitting the resistance
I expect it to fall with the first target=minor support
But with the potential to fall further
Sell!
Like, comment and subscribe to boost your trading!
See other ideas below too!


NEXTIt appears this is a really good trade. With Oil and LNG prices on the rise this could earn good profit. It appears that RSI and MACD are reversing and its oversold on daily.

IGL ViewIGL given Breakout in long term chart. Volume is also supporting. Buy on dip. Key level is 488.75, that's already breaked.

Possible outbreak for natural gasThere might be a good long possibility for natural gas with the price trading just outside of the downwards channel. The downwards channel is traditionally seen as a bullish pattern reinforcing my prediction. I used blue for my support lines and red for resistance. With a three day close following January 1st, a big move at the opening might very well be the case. Keep an eye out for a small drop to get in on a lower price.
Target 1: 2.77
Target 2 3.0

GAS Getting Close To An Upwards Breakout Multibags Soon ?GAS Getting Close To An Upwards Breakout Multibags Soon ?
Gas Looking Ready To Move
EMA Ribbons are tightening
Probable u shaped bottom
Bullish overall
Target 1 0.0002706 sat
Target 2 0.0003466 sat
Target 3 0.0006785 sat
HOLDers Potential for higher targets

NG: UNG: BOIL: Natural Gas Rebounded on Feb 2021 RollNatural Gas prices rebounded after dropping earlier in the week from $2.5 to $2.25 on warm weather. Prices rebounded on tight balances, oversold technical conditions,
and roll into February 2021 contract. Support is expected to hold, as LNG flows are above 11 Bcf/d and balances are tight, with last draw at -152 Bcf.
Technical Analysis: 4 Hr chart shows oversold condition. Support is seen at $2.25. However, double bottom is still possible, before going higher around January 10.
Potential price target for the next leg up is $2.75 - $2.8. Upside potential for NG and BOIL may be limited due to roll into lower March 2021 contract on January 22 -27.
Fundamental Analysis: Bullish picture with tight balances and potential for a deficit is possible going into 2021. Lower 48 state production lost -4 Bcf/d vs. 2020,
while gas exports increased +4 Bcf/d, resulting in net increase in demand of 8 Bcf/d. Lower 48 production is expected to remain at 91 Bcf/d, while LNG flows and
Mexico exports will total 16 Bcf/d. HFIR energy believes, that forward curve is underpriced at avg. of $2.58/MMBtu. Should weather turn colder after January 11, 2021,
as projected by NatGasWeather, we may see NG prices bounce back to $2.7-$2.8 levels. Cash prices are likely to go much higher during winter. However, NG and BOIL,
will start rolling into lower March contract around January 22 -27, which may bring futures prices back to their current support level at $2.3-$2.5 at that time.
Overall picture for NG in 2021 is bullish, given lower production and higher LNG demand and exports remain in place. Traders are bullish EQT and BOIL (day trade).
Short sellers will still have their opportunities on selling 4 Hr tops. KOLD is an inverse daily ETF, that does well during March - April contract timeframe.


NATURAL GAS Going Higher!
NATGAS is trading in a rising opening wedge
And is almost at the support line of the wedge
Therefore, coupling fundamental and technical analysis
I think that NG1! will go Up from here
To retest the recent high
Like and subscribe to never miss a new idea!

NATURAL GAS - Monthly analysis NATURAL GAS is printing falling wedge pattern on the monthly timeframe.
Price bounced off the falling wedge support and is heading the resistance level.
Possible LONG price actions are indicated on the chart

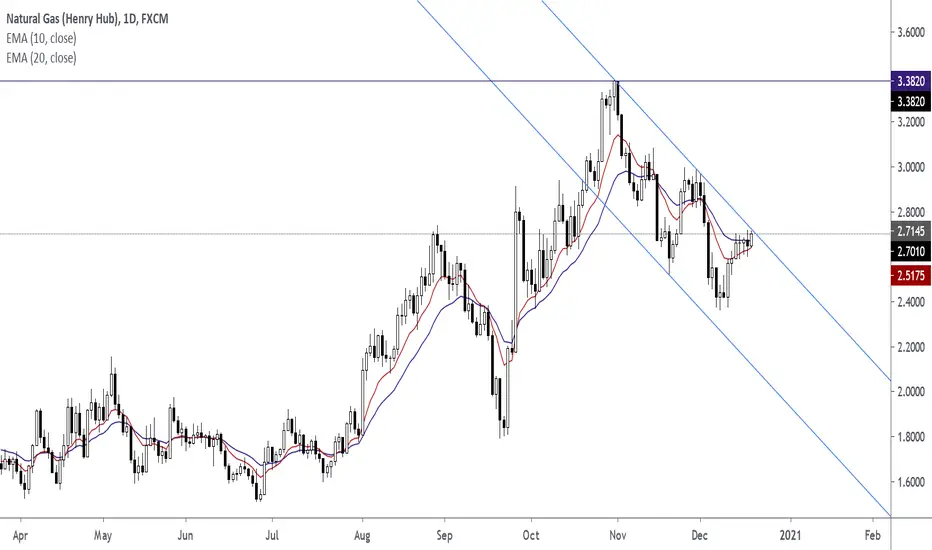
💡 NATGAS . Weekly Technical Analysis UpdateMidterm forecast:
While the price is below the resistance 3.000, beginning of downtrend is expected.
We make sure when the support at 2.250 breaks.
If the resistance at 3.000 is broken, the short-term forecast -beginning of downtrend- will be invalid.
Technical analysis:
While the RSI resistance #1 at 52 is not broken, the probability of price increase would be too low.
A trough is formed in daily chart at 2.378 on 12/08/2020, so more gains to resistance(s) 2.700 and maximum to Major Resistance (3.000) is expected.
Price is below WEMA21, if price rises more, this line can act as dynamic resistance against more gains.
Relative strength index (RSI) is 42.
❤️ If you find this helpful and want more FREE forecasts in TradingView
. . . . . Please show your support back,
. . . . . . . . Hit the 👍 LIKE button,
. . . . . . . . . . Drop some feedback below in the comment!
❤️ Your Support is very much 🙏 appreciated! ❤️
💎 Want us to help you become a better Forex trader ?
Now, It's your turn !
Be sure to leave a comment let us know how you see this opportunity and forecast.
Trade well, ❤️
ForecastCity English Support Team ❤️
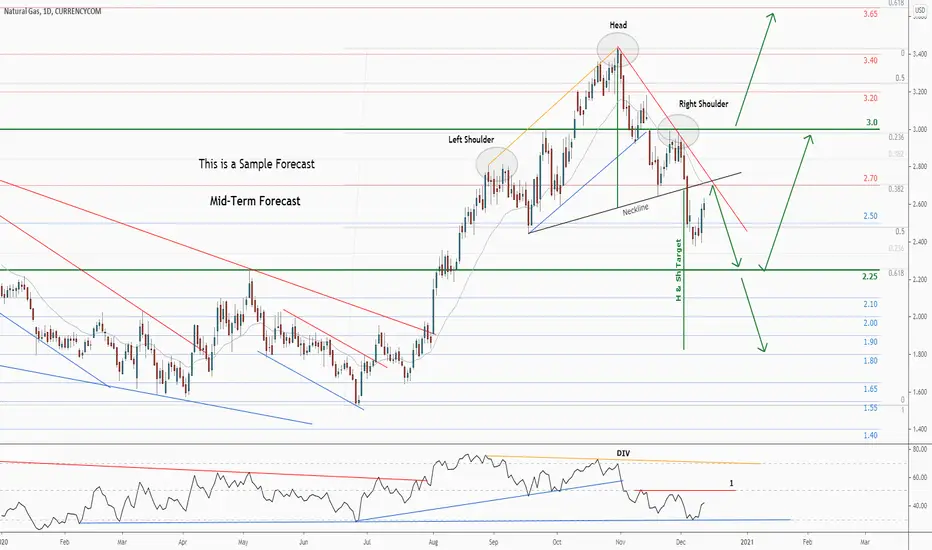
💡 NATGAS. Weekly Technical Analysis UpdateMidterm forecast:
While the price is below the resistance 3.000, beginning of downtrend is expected.
We make sure when the support at 2.250 breaks.
If the resistance at 3.000 is broken, the short-term forecast -beginning of downtrend- will be invalid.
Technical analysis:
While the RSI resistance #1 at 52 is not broken, the probability of price increase would be too low.
A trough is formed in daily chart at 2.378 on 12/08/2020, so more gains to resistance(s) 2.700 and maximum to Major Resistance (3.000) is expected.
Price is below WEMA21, if price rises more, this line can act as dynamic resistance against more gains.
Relative strength index (RSI) is 42.
❤️ If you find this helpful and want more FREE forecasts in TradingView
. . . . . Please show your support back,
. . . . . . . . Hit the 👍 LIKE button,
. . . . . . . . . . Drop some feedback below in the comment!
❤️ Your Support is very much 🙏 appreciated! ❤️
💎 Want us to help you become a better Forex trader ?
Now, It's your turn !
Be sure to leave a comment let us know how you see this opportunity and forecast.
Trade well, ❤️
ForecastCity English Support Team ❤️

IDX PGAS : ELLIOTT WAVE ANALYSIS EXPLANATION AND HOW TO USE IT.ELLIOTT WAVE HAVE 5 WAVE BEFORE DO HIS CORRECTIVE WAVE,
PGAS CURRENTLY IN WAVE 3 TO 4
ELLIOTT WAVE, WAVE 1 - 2 ALREADY VALID @0.618
ELLIOT WAVE, WAVE 2-3 VALID 1.618
WE HAVE TO WAIT THE SECONDARY REACTION OF WAVE 3 - 4 @0.382 AND WE CAN ENTER AT THAT POINT WITH BULLISH HARAMI CANDLESTICK (THE INSIDE BAR) OR HAMMER, ENGULFING WHATEVER IT IS FOR THE ENTRY
AND WAVE 4 - 5 LENGTH HAVE TO BE SAME WITH WAVE 1 - 2 (AB = CD)
WE CAN MEASURE WITH FIBONACCI EXTENSION (HARMONIC PRICE PROJECTION) FROM WAVE 0 = A - WAVE 1 = B , AND THE WAVE 4 = C WE CAN SEE THE PRICE WILL STOP AT 2185
AFTER REACHING THAT POINT SHOULD BE A CORRECTIVE WAVE
THIS IS A TUTORIAL OR A SIMPLE WAY TO KNOW OR USE ELLIOTT WAVE
NO POINT OF ENTRY!
JUST A LESSON FOR WAVE ANALYSIS

ridethepig | NatGas Finding a Floor📍 Natural Gas
The proud floor - such is the name sometimes given to support - is a useful weapon in the hand of buyers. And yet for a time, I toyed with the idea - a seasonality one, I must admit. We cannot simply dismiss the deep examination; namely the elements and the strategies involved in trapping our opponent. For example, the fake breakdown and slingshot restraint.
I have decided that the advantage is with buyers and can be seen in the elements:
Buyers are coming in and preventing the loss of 2.5 and slowing down the said decline. The reason is clear, demand is ticking up and cancelling out the artificial dollar devaluation. We will use the fake breakdown as our invalidation level, as long as we are ticking above 2.38x we can continue to work longs.
It is scarcely possible to set down on paper all the various maps in which the end game of a cycle can be unpleasant. But I will try to mention briefly all of the most important ones. A round of chart updates will continue over the coming sessions and days.
Thanks as usual for keeping the feedback coming 👍 or 👎

Long $USOIL $GUSH $XOPFrom the NYT : "Under the agreement, members of the Organization of the Petroleum Exporting Countries along with Russia and other countries will increase production by 500,000 barrels a day in January and, potentially, by a similar amount in the following months. The increase, less than 1 percent of the global oil market"
From WSJ : "The price rout has also laid low big, publicly traded oil companies like Exxon Mobil Corp. and Royal Dutch Shell PLC, triggering big losses and job cuts. Shell and BP PLC both recently cut their dividend for the first time in years to preserve cash. Chevron Corp. on Thursday said it was joining peers in slashing spending."
Oil companies are an important fixture in all of the most powerful countries in the world. While I fully recognize that the oil industry is a dying one, the financial stress that the majors are currently under is causing them to be undervalued relative to their integration, importance, and efficiency at this point in time.
Higher oil prices from where they currently are is in the best interest of every major economy. It is a perfect time to make this happen given the effectiveness of the almost-approved Covid-19 vaccines.
Just an idea!

NG: UNG: boil: Natural Gas Looking for a Bottom - Mid DecemberNatural Gas futures dropped disproportionately to fundamentals on lower national demand in the first half of December and slightly higher recent production.
However, NatGasWeather forecasts for the storage draw covering next three weeks are not as bearish as the drop in gas prices. LNG flows are consistently
bullish exceeding 10.5 bcf/d. The fundamentals are still strong. It seems that bullish traders are waiting for colder weather patterns to settle in before driving
prices higher.
If we get the forecasted warming next week, the prices may go lower. Expected trough at around December 9-12.
Technicals: The 4 Hr chart is oversold. Yet, this condition may persist for another week. The double bottom is more likely before going higher.
Per NatGasWeather Report:
EIA Weekly Nat Gas Storage Report Outlook: EIA Weekly Report
Week 1 – December 10 -70 to -80 Bcf Slightly Larger vs Normal Draw
(Nov 27-Dec 3)
Week 2 – December 17 -80 to -90 Bcf Slightly Smaller vs Normal Draw
(Dec 4-10)
Week 3 – December 23 -85 to -100 Bcf Slightly Smaller vs Normal Draw
(Dec 11-17)
NatGasWeather.com Forecast
5-Year Average -61 Bcf -105 Bcf -127 Bcf

ridethepig | Natural Gas Breaking Out!A nice swing cooking right on time for December seasonality flows to kick in.
This leg higher threatens the sacrifice of resistance and creates freedom to manoeuvre towards $4 and $5 in 2021. We have a similar sized move cooking in energy to the leg we traded in Oil, only this time round the swing we are tracking is to the topside. See for example the following breakdown we traded in Oil;
In the ST, play with the flow and continue ride the leg higher towards something like +/- 3.5 and 4.0 as the extension. Sellers are quite paralysed.
For the MT and LT as we know, the philosophy of transition towards a 'Green new Deal' or 'Build back better' in such a short period of time constitutes a pipe dream. Already power grids are coughing badly with so much activity from lockdowns and more people at home, the theory that we will all be driving electric cars and etc looks quite far... one cannot rebuild energy without great difficulties is important to understand.
Thanks as usual for keeping the feedback coming 👍 or 👎
