GBPAUD Close to RESISTANCE level.Hello friends. Here is our analysis on GBPAUD. For a lot of time the pair seems to be going on inside the channel. As we can see that after march its started getting consolidating very aggressively. There looks like a lot of buying pressure. In the image given in the comment section you can also see that there is a buying trend in D1 as well. So there is a good chance that the pair will soon break the resistance line and start going up.
Your views are welcome. Thank you.
Ryan.R.Lopes
Gbp-aud

GBPAUD For Short Side TradeGBPAUD Form a Symmetricle triangle top we might see some correction in GBPAUD towards mid of channel if that breaks we may see further downside toward meeting point of rising wedge resistance and channel line Support. as long term trend is on upside this trade is for shorter time frame.
Stay With Us For More Idea.

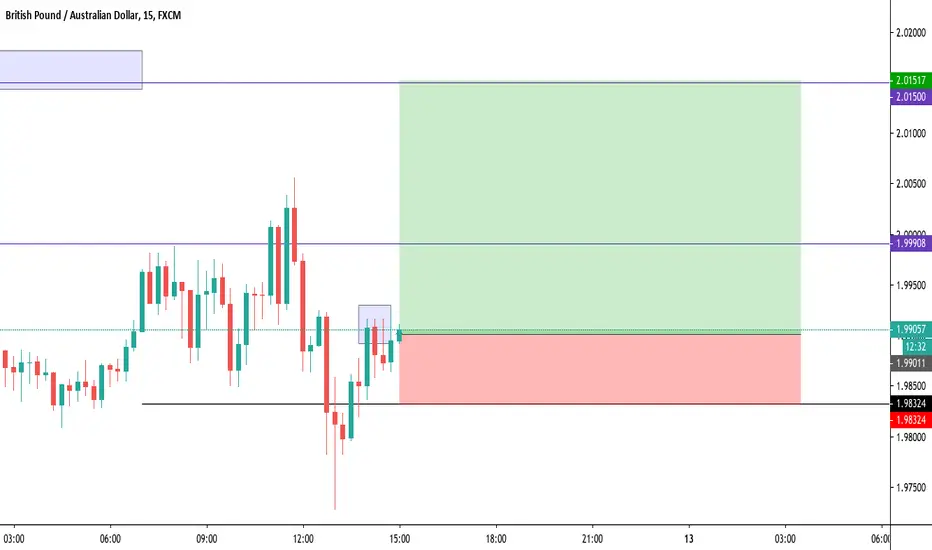
Long GBP AUD daily right on bolinger top band line
weekly rsi running bullish & daily running bullish 7 hour turning bullish
we see rising momentum and rsi on weekly time frame analysis
we are right on 4 hour trendline support for a low risk entry
15 minute ichimoku gives bullish green cloud ahead

GBPAUD LONG TRADEGBPAUD broke 50% Fibonacci of preceding bearish wave at level 2.0198 with strong bullish movement
Pair is in uptrend
Above SMA 100 on H1 frame
MACD shows start of bullish momentum
RSI is above level 50
Pair is above HVN at level 1.9867
It's expected going up towards supply zone at level 2.0755

GBPAUD expecting higher bearish continuation
ENTRY: 1.97850
TP: 1.97550
TP2: 1.97300
TP3: 1.97000
SL: 1.99100
Chart time frame - 4H
Time for reaching TP - 1-2D
Follow, Like, Share or Comment
Thanks on supporting!
All best!

gbp aud buy buy buyok so weekly and daily momentum are very bullish
ichi long signal soon or initiated
buy here and long massive potential

GBPAUD - Short opportunityPAIR IN FOCUS: GBPAUD
PLAN: SHORT
ENTRY: 1.98850
STOP LOSS: 1.99630
TP 1: 1.98230
TP 2: 1.97750
TP 3: 1.96940
REMEMBER TO MANAGE YOUR RISK!

GBPAUD SHORTTERM SELL SET UPgbpaud has risen very high but clearly rejected resistance (the rise also due to news) now there should be a push down as there is also big bearish divergence.

GBP AUD BUY (POUND STERLING - AUSTRALIAN DOLLAR)HI there. Price is forming a continuation pattern to the upside. Wait for the price to complete the pattern and watch strong price action for buy.

GBPAUD possible scenariosGBPAUD is at a very strong resistance intersection and i expect it will fall from here. However it could breakout and continue to rise to the 2nd resistance line and fall to retest.


GBP/AUD Trading Plan SELL - Counter Trend Riks Reward 1:3GBP/AUD Trading Plan SELL - Counter Trend Riks Reward 1:3


GBPAUD Live swing trade Caught this before a nice +60 pips move to the upside. Price rejected support and the overall bullish direction could gain momentum from this area to retest previous highs.

GBPAUD sell potential is off the charts *peep the pips* GBPAUD restested the strong key support/resistance area box. This will be a good re-entry/continuation trade for the pair. AUD news coming out in a couple hours which is looking positive which could push GBPAUD lower. Check out the 1h chart or the 2h chart and you'll see price reversing exactly at the key area box. Some good indications but if you place a fibonnaci from the last high to the low you'll see the 32.8% fib is just at the top of the key area box so this trade is rather risky. Overall, I'll check on the trade after the news settles and I get home tonight.


GBPAUD - FOREX - 02. MAR. 2020Welcome to our weekly trade setup ( GBPCAD )!
-
1 HOUR
Bearish break towards support zone.
4 HOUR
Overall bullish market with a pullback now.
DAILY
Great long entries and risk reward on this one.
-
FOREX SETUP
BUY GBPAUD
ENTRY LEVEL @ 1.95060
SL @ 1.93650
TP @ 1.97850
RR: 2.0
Use 0.5% risk!
(Remember to add a few pips to all levels - different Brokers!)
Leave us a comment or like to keep our content for free and alive.
Have a great week everyone!
ALAN

This time we gonna nail this gbpaud down !! mua hahaha :D on the 2nd of feb we managed to get a nice sell signal on gbpaud ., now we have another chance to sell gbpaud , our trade signal is for monday night 2nd march . we will look for selling opportunities. we can use a tight sl just above the top level around 1.99.
we also witnessed strong bear divergence on euraud chart , and we dont have any divergence on eurgbp so we believe that gbpaud will be great trade.
wish you good luck and happy profits .

GBPAUD wait n see for resistance level rejectionPlease user proper money management and adaptive profit taking. the trading plan clearly described. Join our community at telegram garudaforexclub. Thanks!

Don't miss the great sell opportunity in GBPAUDTrading suggestion:
. There is still a possibility of temporary retracement to suggested resistance line (1.9655). if so, traders can set orders based on Price Action and expect to reach short-term targets.
Technical analysis:
. GBPAUD is in a range bound and the beginning of downtrend is expected.
.The price is above the 21-Day WEMA which acts as a dynamic support.
. The RSI is at 60.
Take Profits:
TP1= @ 1.9522
TP2= @ 1.9343
TP3= @ 1.8765
SL: Break Above R2

GBPAUD SHORT TRADEFalse breakout occurred on GBPAUD pair after reaching supply zone at level 1.9754
MACD shows bearish momentum
RSI is in downtrend
We r waiting breaking support level at 1.9655 to open short position
First target will be at key level 1.9418
then second target will be at demand zone at level 1.9187
