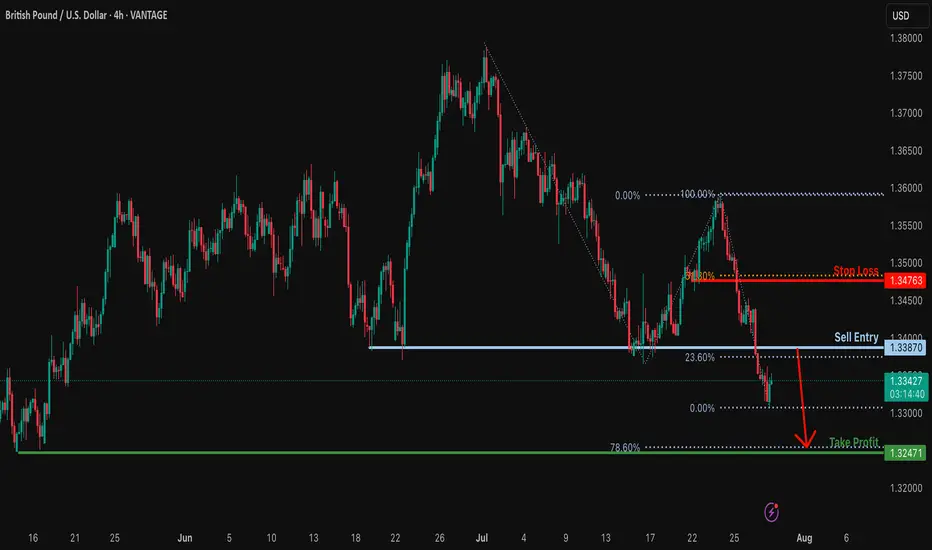
Bearish reversal for the Cable?The price is rising towards the resistance level, which is a pullback resistance that aligns with the 23.6% Fibonacci retracement and could potentially reverse from this level to our take-profit.
Entry: 1.3387
Why we like it:
There is a pullback resistance that lines up with the 23.6% Fibonacci retracement.
Stop loss: 1.3476
Why we like it:
There is a pullback resistance that aligns with the 61.8% Fibonacci retracement.
Take profit: 1.3247
Why we like it:
There is a multi-swing low support that aligns with the 78.6% Fibonacci projection.
Enjoying your TradingView experience? Review us!
TradingView (www.tradingview.com)
Please be advised that the information presented on TradingView is provided to Vantage (‘Vantage Global Limited’, ‘we’) by a third-party provider (‘Everest Fortune Group’). Please be reminded that you are solely responsible for the trading decisions on your account. There is a very high degree of risk involved in trading. Any information and/or content is intended entirely for research, educational and informational purposes only and does not constitute investment or consultation advice or investment strategy. The information is not tailored to the investment needs of any specific person and therefore does not involve a consideration of any of the investment objectives, financial situation or needs of any viewer that may receive it. Kindly also note that past performance is not a reliable indicator of future results. Actual results may differ materially from those anticipated in forward-looking or past performance statements. We assume no liability as to the accuracy or completeness of any of the information and/or content provided herein and the Company cannot be held responsible for any omission, mistake nor for any loss or damage including without limitation to any loss of profit which may arise from reliance on any information supplied by Everest Fortune Group.
GBP (British Pound)
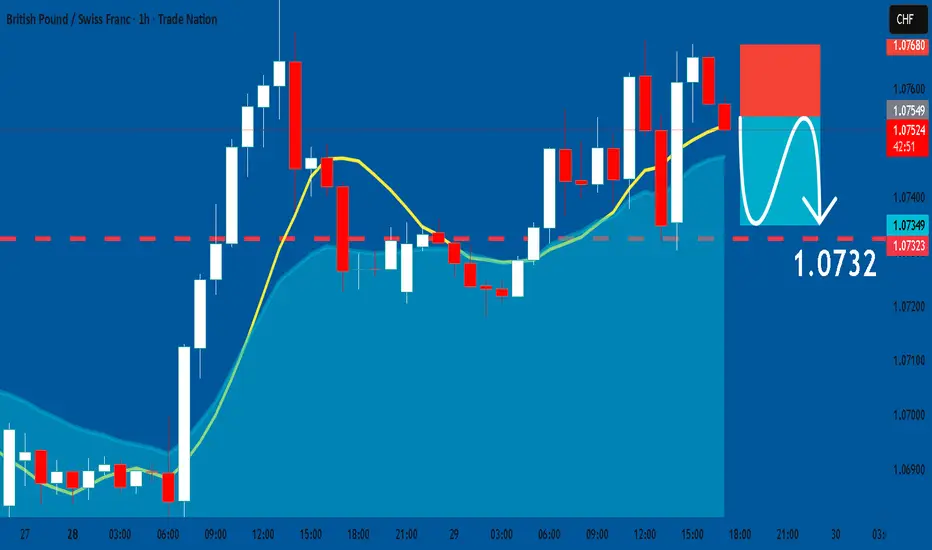
GBPCHF: Short Signal with Entry/SL/TP
GBPCHF
- Classic bearish setup
- Our team expects bearish continuation
SUGGESTED TRADE:
Swing Trade
Short GBPCHF
Entry Point - 1.0754
Stop Loss - 1.0768
Take Profit - 1.0732
Our Risk - 1%
Start protection of your profits from lower levels
Disclosure: I am part of Trade Nation's Influencer program and receive a monthly fee for using their TradingView charts in my analysis.
❤️ Please, support our work with like & comment! ❤️

GBPUSD – DAILY FORECAST Q3 | W31 | D29 | Y25📊 GBPUSD – DAILY FORECAST
Q3 | W31 | D29 | Y25
Daily Forecast 🔍📅
Here’s a short diagnosis of the current chart setup 🧠📈
Higher time frame order blocks have been identified — these are our patient points of interest 🎯🧭.
It’s crucial to wait for a confirmed break of structure 🧱✅ before forming a directional bias.
This keeps us disciplined and aligned with what price action is truly telling us.
📈 Risk Management Protocols
🔑 Core principles:
Max 1% risk per trade
Only execute at pre-identified levels
Use alerts, not emotion
Stick to your RR plan — minimum 1:2
🧠 You’re not paid for how many trades you take, you’re paid for how well you manage risk.
🧠 Weekly FRGNT Insight
"Trade what the market gives, not what your ego wants."
Stay mechanical. Stay focused. Let the probabilities work.
FX:GBPUSD

#011: Long Investment Opportunity on GBP/CAD
After weeks of compression, GBP/CAD is showing clear signs of institutional accumulation. The price recently released a false bearish breakout below 1.8400, followed by a reabsorption and spike with decreasing volumes: a typical "retail flush" structure.
Added to this are clear macro elements:
The pound is supported by a still-tight monetary policy, with the BoE maintaining a hawkish tone.
The Canadian dollar is suffering from declining oil expectations and the risk of a more rapid rate cut by the BoE.
📉 What happened?
The market attempted to "clear" the 1.838–1.840 zone with a rapid, unfollow-through bearish move. This behavior, combined with the Open Interest reading and retail positioning, suggests an institutional entry intention in the area between 1.8375 and 1.8365.
📈 Positioning
A Buy Limit was placed at 1.83740, with a wide Stop Loss at 1.82890, outside any visible hunting zone, and a Take Profit at 1.86280, where profit-taking has historically occurred on similar patterns.
🎯 Main motivations for long
Accumulation visible with stop-hunt below support at 1.8400
Net long GBP futures position
Retail short above 70%, a typical reversal signal
No significant volume obstacles until 1.8620
Psychological resistance already tested (1.846, 1.850)
⏳ Estimated timeframe
The setup could develop over several days, with the first movement as early as today (Friday) and completion by mid-next week. The intention is to follow the banking flow, without anticipating or reacting to emotional price movements.

GBPUSD BUY TIGER SETUP LOOOOOOOOOOOONGwelcome
we have strong mitigation order block on time frame weekly and daily
and on 4H we have break downtrend and retest on it
and we in well discount area
and we have demand on high time frame
so this is good idea for buying
Don't forget to follow me
so that get refresh analysis

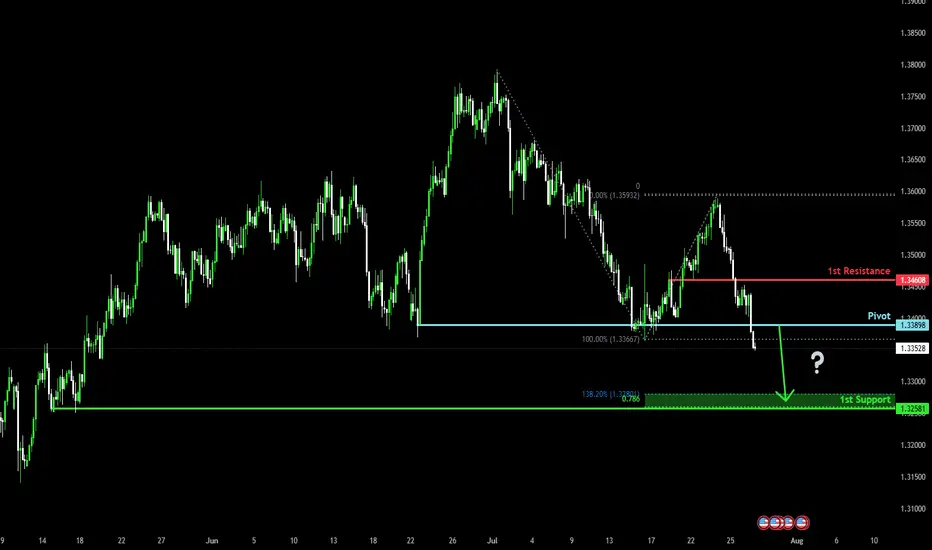
Potential bearish drop?The Cable (GBP/USD) has broken below the support level, which is a multi-swing low support. A potential pullback to the pivot, followed by a rejection, could lead the price to drop to the 1st support.
Pivot: 1.3389
1st Support: 1.3258
1st Resistance: 1.3460
Risk Warning:
Trading Forex and CFDs carries a high level of risk to your capital and you should only trade with money you can afford to lose. Trading Forex and CFDs may not be suitable for all investors, so please ensure that you fully understand the risks involved and seek independent advice if necessary.
Disclaimer:
The above opinions given constitute general market commentary, and do not constitute the opinion or advice of IC Markets or any form of personal or investment advice.
Any opinions, news, research, analyses, prices, other information, or links to third-party sites contained on this website are provided on an "as-is" basis, are intended only to be informative, is not an advice nor a recommendation, nor research, or a record of our trading prices, or an offer of, or solicitation for a transaction in any financial instrument and thus should not be treated as such. The information provided does not involve any specific investment objectives, financial situation and needs of any specific person who may receive it. Please be aware, that past performance is not a reliable indicator of future performance and/or results. Past Performance or Forward-looking scenarios based upon the reasonable beliefs of the third-party provider are not a guarantee of future performance. Actual results may differ materially from those anticipated in forward-looking or past performance statements. IC Markets makes no representation or warranty and assumes no liability as to the accuracy or completeness of the information provided, nor any loss arising from any investment based on a recommendation, forecast or any information supplied by any third-party.
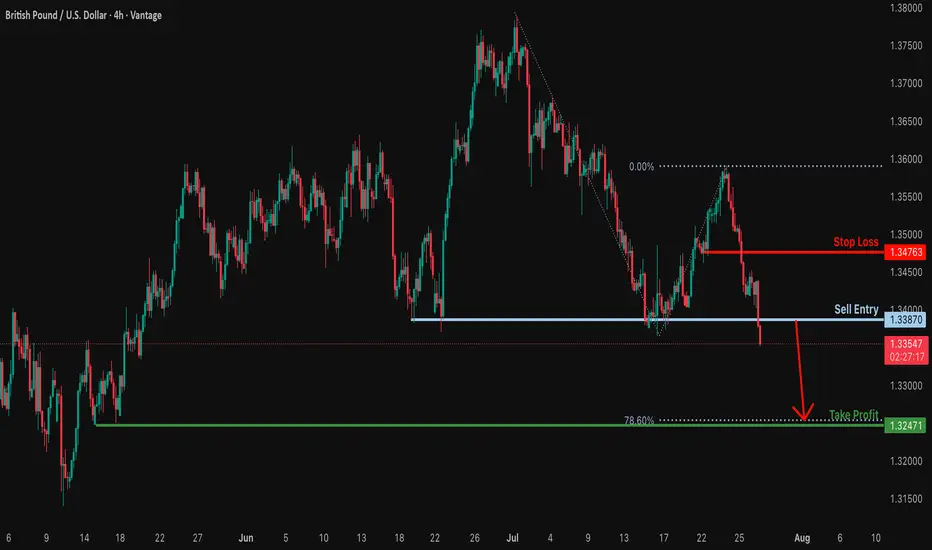
Potential bearish drop?GBP/USD has reacted off the support level which is a multi swing low support and could drop from this levle to our take profit.
Entry: 1.3387
Why we like it:
There is a multi swing low support.
Stop loss: 1.3476
Why we like it:
There is a pullback resistance.
Take profit: 1.3247
Why we like it:
There is a multi swing low support that aligns with the 78.6% Fibonacci projection.
Enjoying your TradingView experience? Review us!
Please be advised that the information presented on TradingView is provided to Vantage (‘Vantage Global Limited’, ‘we’) by a third-party provider (‘Everest Fortune Group’). Please be reminded that you are solely responsible for the trading decisions on your account. There is a very high degree of risk involved in trading. Any information and/or content is intended entirely for research, educational and informational purposes only and does not constitute investment or consultation advice or investment strategy. The information is not tailored to the investment needs of any specific person and therefore does not involve a consideration of any of the investment objectives, financial situation or needs of any viewer that may receive it. Kindly also note that past performance is not a reliable indicator of future results. Actual results may differ materially from those anticipated in forward-looking or past performance statements. We assume no liability as to the accuracy or completeness of any of the information and/or content provided herein and the Company cannot be held responsible for any omission, mistake nor for any loss or damage including without limitation to any loss of profit which may arise from reliance on any information supplied by Everest Fortune Group.
GBPCAD - Long-Term Long!Hello TradingView Family / Fellow Traders. This is Richard, also known as theSignalyst.
📈GBPCAD has been overall bullish trading within the rising wedge pattern marked in blue.
This week, GBPCAD has been retesting the lower bound of the wedge.
Moreover, the red zone is a strong weekly structure.
🏹 Thus, the highlighted blue circle is a strong area to look for buy setups as it is the intersection of the lower blue trendline and red structure.
📚 As per my trading style:
As #GBPCAD approaches the blue circle zone, I will be looking for trend-following bullish reversal setups (like a double bottom pattern, trendline break , and so on...)
📚 Always follow your trading plan regarding entry, risk management, and trade management.
Good luck!
All Strategies Are Good; If Managed Properly!
~Rich
Disclosure: I am part of Trade Nation's Influencer program and receive a monthly fee for using their TradingView charts in my analysis.

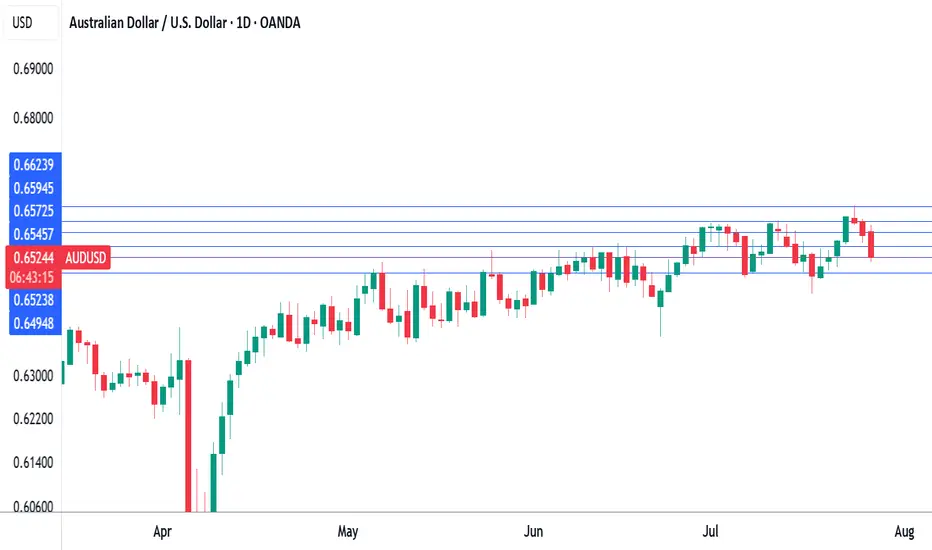
Australian dollar down, eyes US GDP, Australian CPIThe Australian dollar is down for a third straight trading day. In the North American session, the US dollar has posted gains against most of the major currencies, including the Aussie. The greenback received a boost after the US and the EU reached a framework trade agreement after protracted negotiations.
The data calendar is bare on Monday, with no events out of the US or Australia. Things get very busy on Wednesday, with Australian inflation, US GDP and the Federal Reserve rate decision.
Even with no US releases, the US dollar has posted gains against most of the major currencies, including the Aussie. The greenback received a boost after the US and the EU reached a framework trade agreement after protracted negotiations.
President Trump had threatened to impose 30% tariffs on European goods if a deal was not reached by Aug. 1. With the deal, a nasty trade war between the world's two largest economies has been avoided and the US will tariff most EU products at 15%.
The deal with the EU comes on the heels of a similar agreement with Japan, bringing a sigh of relief from the financial markets that have been worried about the economic fallout from Trump's tariff policy. The agreements remove a great deal of uncertainty and investors are hopeful that the US and Chinese negotiators will wrap up their talks with an agreement in hand.
The Federal Reserve meets on Wednesday and is virtually certain to maintain interest rates for a fifth straight meeting. It will be interesting to see if President Trump, who has been sharply critical of Fed policy, reacts to the decision. The money markets are expecting at least one cut before the end of the year, with the money markets pricing in a 61% likelihood a cut in September, according to FedWatch's CME.
GBPUSD – DAILY FORECAST Q3 | W31 | D28 | Y25📊 GBPUSD – DAILY FORECAST
Q3 | W31 | D28 | Y25
Daily Forecast 🔍📅
Here’s a short diagnosis of the current chart setup 🧠📈
Higher time frame order blocks have been identified — these are our patient points of interest 🎯🧭.
It’s crucial to wait for a confirmed break of structure 🧱✅ before forming a directional bias.
This keeps us disciplined and aligned with what price action is truly telling us.
📈 Risk Management Protocols
🔑 Core principles:
Max 1% risk per trade
Only execute at pre-identified levels
Use alerts, not emotion
Stick to your RR plan — minimum 1:2
🧠 You’re not paid for how many trades you take, you’re paid for how well you manage risk.
🧠 Weekly FRGNT Insight
"Trade what the market gives, not what your ego wants."
Stay mechanical. Stay focused. Let the probabilities work.
FX:GBPUSD

Bullish bounce off?The Cable (GBP/USD) is falling towards the pivot and could bounce to the swing high resistance.
Pivot: 1.3370
1st Support: 1.3161
1st Resistance: 1.3585
Risk Warning:
Trading Forex and CFDs carries a high level of risk to your capital and you should only trade with money you can afford to lose. Trading Forex and CFDs may not be suitable for all investors, so please ensure that you fully understand the risks involved and seek independent advice if necessary.
Disclaimer:
The above opinions given constitute general market commentary, and do not constitute the opinion or advice of IC Markets or any form of personal or investment advice.
Any opinions, news, research, analyses, prices, other information, or links to third-party sites contained on this website are provided on an "as-is" basis, are intended only to be informative, is not an advice nor a recommendation, nor research, or a record of our trading prices, or an offer of, or solicitation for a transaction in any financial instrument and thus should not be treated as such. The information provided does not involve any specific investment objectives, financial situation and needs of any specific person who may receive it. Please be aware, that past performance is not a reliable indicator of future performance and/or results. Past Performance or Forward-looking scenarios based upon the reasonable beliefs of the third-party provider are not a guarantee of future performance. Actual results may differ materially from those anticipated in forward-looking or past performance statements. IC Markets makes no representation or warranty and assumes no liability as to the accuracy or completeness of the information provided, nor any loss arising from any investment based on a recommendation, forecast or any information supplied by any third-party.

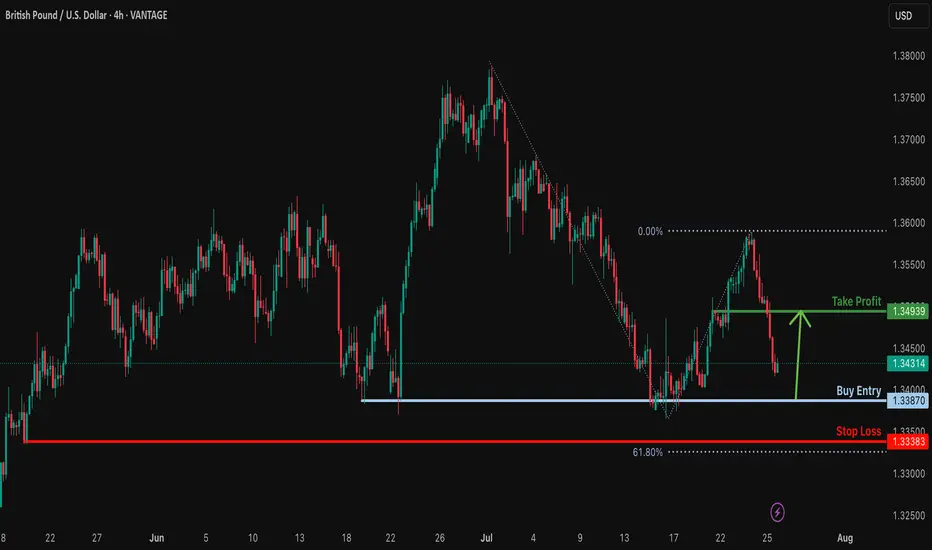
Bullish bounce?GBP/USD is falling towards the support level which is a multi swing low support and could bounce from this level to our take profit.
Entry: 1.3387
Why we like it:
There is a multi swing low support.
Stop loss: 1.3338
Why we like it:
There is a swing low support that is slightly above the 61.8% Fibonacci projection.
Take profit: 1.3493
Why we like it:
There is a pullback resistance.
Enjoying your TradingView experience? Review us!
Please be advised that the information presented on TradingView is provided to Vantage (‘Vantage Global Limited’, ‘we’) by a third-party provider (‘Everest Fortune Group’). Please be reminded that you are solely responsible for the trading decisions on your account. There is a very high degree of risk involved in trading. Any information and/or content is intended entirely for research, educational and informational purposes only and does not constitute investment or consultation advice or investment strategy. The information is not tailored to the investment needs of any specific person and therefore does not involve a consideration of any of the investment objectives, financial situation or needs of any viewer that may receive it. Kindly also note that past performance is not a reliable indicator of future results. Actual results may differ materially from those anticipated in forward-looking or past performance statements. We assume no liability as to the accuracy or completeness of any of the information and/or content provided herein and the Company cannot be held responsible for any omission, mistake nor for any loss or damage including without limitation to any loss of profit which may arise from reliance on any information supplied by Everest Fortune Group.
GBPCHF Will Keep Falling!
HI,Traders !
#GBPCHF keeps falling down
And the pair made a strong
Bearish breakout of the key
Horizontal key level of 1.07025
And the breakout is confirmed
So we are bearish biased and
We will be expecting a further
Bearish move down on Monday !
Comment and subscribe to help us grow !

GBPJPY Potential UpsidesHey Traders, in the coming week we are monitoring GBPJPY for a buying opportunity around 197.900 zone, GBPJPY is trading in an uptrend and currently is in a correction phase in which it is approaching the trend at 197.900 support and resistance area.
Trade safe, Joe.

EURGBP near the current highest point of 2025.FX_IDC:EURGBP is slowly approaching a strong area of resistance, which is the current highest point of 2025. Let's dig in...
MARKETSCOM:EURGBP
Let us know what you think in the comments below.
Thank you.
75.2% of retail investor accounts lose money when trading CFDs with this provider. You should consider whether you understand how CFDs work and whether you can afford to take the high risk of losing your money. Past performance is not necessarily indicative of future results. The value of investments may fall as well as rise and the investor may not get back the amount initially invested. This content is not intended for nor applicable to residents of the UK. Cryptocurrency CFDs and spread bets are restricted in the UK for all retail clients.

GBPCHFGBPCHF price is near the main support zone 1.07101-1.06714. If the price cannot break through the 1.06714 level, it is expected that the price will rebound. Consider buying the red zone.
🔥Trading futures, forex, CFDs and stocks carries a risk of loss.
Please consider carefully whether such trading is suitable for you.
>>GooD Luck 😊
❤️ Like and subscribe to never miss a new idea!

GBPUSD Support & Resistance Levels🚀 Here are some key zones I've identified on the H1/M15/M5 timeframe.
These zones are based on real-time data analysis performed by a custom software I personally developed.
The tool is designed to scan the market continuously and highlight potential areas of interest based on price action behavior and volume dynamics.
Your feedback is welcome!

GBPUSD Q3 | D25 | W30 | Y25 FUN COUPON FRIDAYGBPUSD Q3 | D25 | W30 | Y25
Daily Forecast🔍📅
Here’s a short diagnosis of the current chart setup 🧠📈
Higher time frame order blocks have been identified — these are our patient points of interest 🎯🧭.
It’s crucial to wait for a confirmed break of structure 🧱✅ before forming a directional bias.
This keeps us disciplined and aligned with what price action is truly telling us.
📈 Risk Management Protocols
🔑 Core principles:
Max 1% risk per trade
Only execute at pre-identified levels
Use alerts, not emotion
Stick to your RR plan — minimum 1:2
🧠 You’re not paid for how many trades you take, you’re paid for how well you manage risk.
🧠 Weekly FRGNT Insight
"Trade what the market gives, not what your ego wants."
Stay mechanical. Stay focused. Let the probabilities work.
FRGNT
FX:GBPUSD

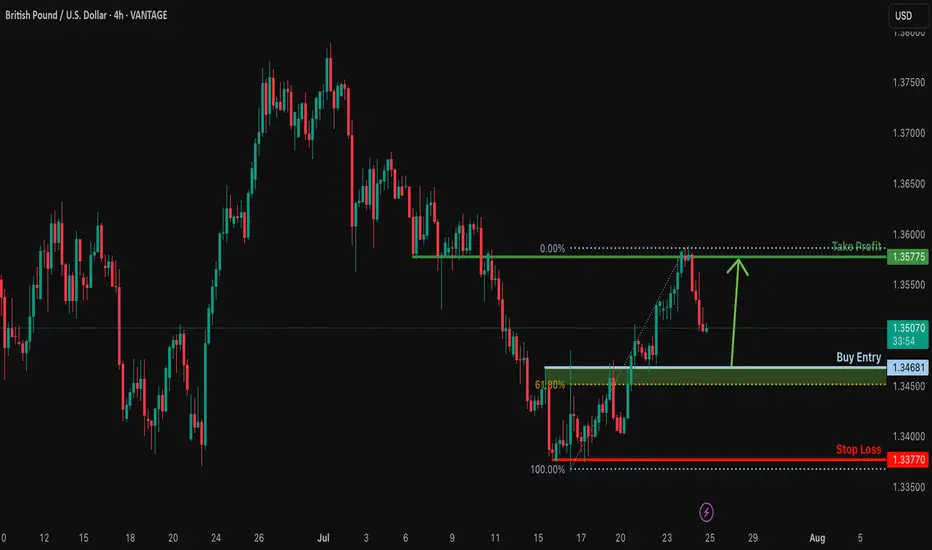
Bullish bounce for the Cable?The price is falling towards the suoprt level which is an overlap support that is slightly above the 61.8% Fibonacci retracement and could bounce from this level to our take profit.
Entry: 1.3468
Why we like it:
There is an overlap support that is slightly above the 61.8% Fibonacci retracement.
Stop loss: 1.3377
Why we like it:
There is a swing low support.
Take profit: 1.3577
Why we like it:
There is a pullback resistance.
Enjoying your TradingView experience? Review us!
Please be advised that the information presented on TradingView is provided to Vantage (‘Vantage Global Limited’, ‘we’) by a third-party provider (‘Everest Fortune Group’). Please be reminded that you are solely responsible for the trading decisions on your account. There is a very high degree of risk involved in trading. Any information and/or content is intended entirely for research, educational and informational purposes only and does not constitute investment or consultation advice or investment strategy. The information is not tailored to the investment needs of any specific person and therefore does not involve a consideration of any of the investment objectives, financial situation or needs of any viewer that may receive it. Kindly also note that past performance is not a reliable indicator of future results. Actual results may differ materially from those anticipated in forward-looking or past performance statements. We assume no liability as to the accuracy or completeness of any of the information and/or content provided herein and the Company cannot be held responsible for any omission, mistake nor for any loss or damage including without limitation to any loss of profit which may arise from reliance on any information supplied by Everest Fortune Group.
GBPJPY Potential UpsidesHey Traders, in today's trading session we are monitoring GBPJPY for a buying opportunity around 197.700 zone, GBPJPY is trading in an uptrend and currently is in a correction phase in which it is approaching the trend at 197.700 support and resistance area.
Trade safe, Joe.

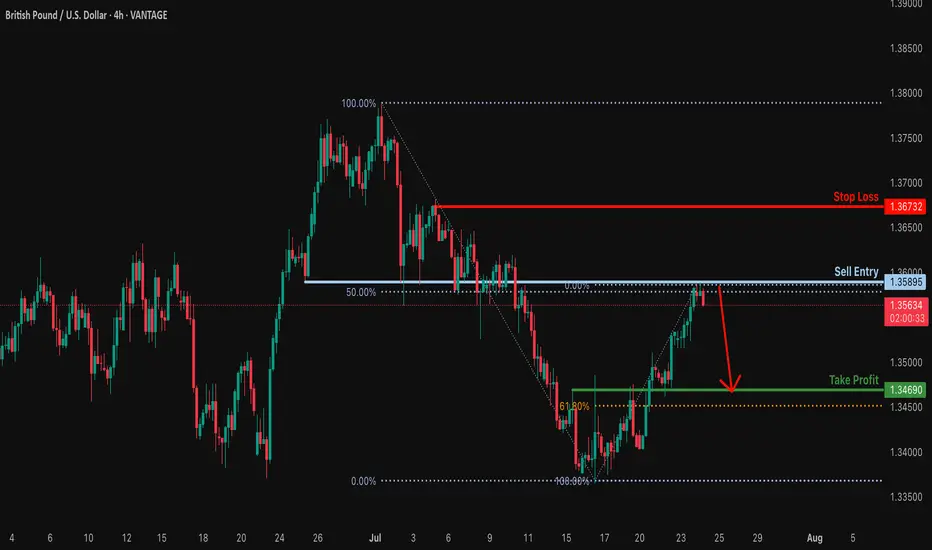
Bearish reversal off pullback resistance?The Cable (GBP/USD) is reacting off the resistance level, which is a pullback resistance that aligns with the 50% Fibonacci retracement and could drop from this level to our take profit.
Entry: 1.3589
Why we like it:
There is a pullback resistance that lines up with the 50% Fibonacci retracement.
Stop loss: 1.3673
Why we like it:
There is a swing high resistance.
Take profit: 1.3469
Why we like it:
There is an overlap support level that is slightly above the 61.8% Fibonacci retracement.
Enjoying your TradingView experience? Review us!
Please be advised that the information presented on TradingView is provided to Vantage (‘Vantage Global Limited’, ‘we’) by a third-party provider (‘Everest Fortune Group’). Please be reminded that you are solely responsible for the trading decisions on your account. There is a very high degree of risk involved in trading. Any information and/or content is intended entirely for research, educational and informational purposes only and does not constitute investment or consultation advice or investment strategy. The information is not tailored to the investment needs of any specific person and therefore does not involve a consideration of any of the investment objectives, financial situation or needs of any viewer that may receive it. Kindly also note that past performance is not a reliable indicator of future results. Actual results may differ materially from those anticipated in forward-looking or past performance statements. We assume no liability as to the accuracy or completeness of any of the information and/or content provided herein and the Company cannot be held responsible for any omission, mistake nor for any loss or damage including without limitation to any loss of profit which may arise from reliance on any information supplied by Everest Fortune Group.
GBPCAD Q3 | D24 | W30 | Y25📊GBPCAD Q3 | D24 | W30 | Y25
Daily Forecast🔍📅
Here’s a short diagnosis of the current chart setup 🧠📈
Higher time frame order blocks have been identified — these are our patient points of interest 🎯🧭.
It’s crucial to wait for a confirmed break of structure 🧱✅ before forming a directional bias.
This keeps us disciplined and aligned with what price action is truly telling us.
📈 Risk Management Protocols
🔑 Core principles:
Max 1% risk per trade
Only execute at pre-identified levels
Use alerts, not emotion
Stick to your RR plan — minimum 1:2
🧠 You’re not paid for how many trades you take, you’re paid for how well you manage risk.
🧠 Weekly FRGNT Insight
"Trade what the market gives, not what your ego wants."
Stay mechanical. Stay focused. Let the probabilities work.
FRGNT
