#008: GBP/NOK SHORT OPPORTUNITY
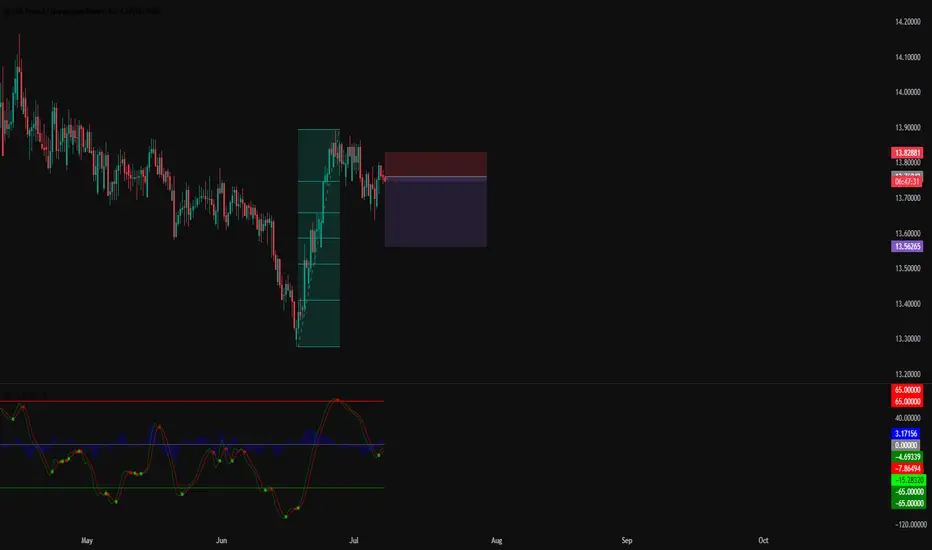
Hi, I'm Forex Trader Andrea Russo and today I want to show you this GBP/NOK SHORT opportunity. After a strong upside extension, GBP/NOK is showing signs of exhaustion just below the key resistance zone of 13.83. I thank in advance my Official Broker Partner PEPPERSTONE for the support in writing this article.
📍 Technical Context
The pair has recently formed a local double top with declining bullish momentum. Price action around the highs is becoming increasingly choppy, suggesting the presence of smart investors preparing a possible reversal.
A clear rejection from the 13.82-13.83 zone triggered the short setup, with confirmation coming from broader market dynamics and a favorable risk/reward structure.
🔍 Macro Overview
The British pound remains under pressure as uncertainty over the Bank of England's next rate decision weighs on the currency.
The Norwegian krone finds support in stable oil prices and expectations of relatively tight monetary policy.
This macro imbalance creates a favorable backdrop for a potential downside continuation.
This setup aligns both technical exhaustion and cross-market forces, while sentiment data reveals a bearish bias among retail on GBP/NOK, often a good time to ease pressure.
🔄 Next Steps
As always, I will be monitoring the price action on a candle-by-candle basis. If the downside momentum confirms, the pair could retest the 13.56 support in the coming sessions.
📌 Stay tuned for live updates and trade management.
GBP (British Pound)
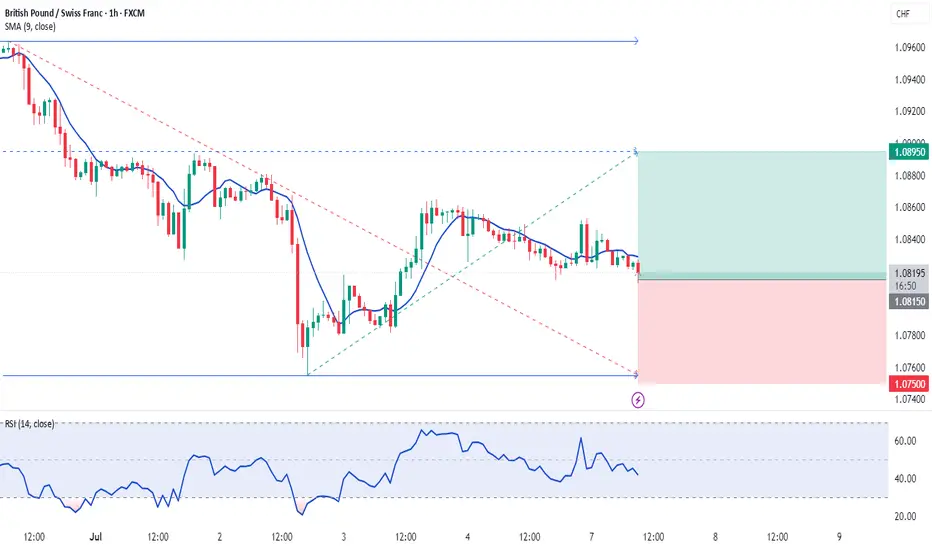
GBP-CHF Bearish Breakout! Sell!
Hello,Traders!
GBP-CHF is trading in a strong
Downtrend and the pair
Broke the key horizontal
Level around 1.0780 which
Reinforces our bearish
Bias and we will be
Expecting a further
Bearish move down
On Monday!
Sell!
Comment and subscribe to help us grow!
Check out other forecasts below too!
Disclosure: I am part of Trade Nation's Influencer program and receive a monthly fee for using their TradingView charts in my analysis.

EURGBP SHORT – WEEKLY FORECAST Q3 | W29 | Y25💼 EURGBP SHORT – WEEKLY FORECAST
Q3 | W29 | Y25
📊 MARKET STRUCTURE SNAPSHOT
EURGBP is currently reacting from a key higher time frame supply zone, with price action showing weakness at premium levels. Momentum has slowed, and early signs of distribution are appearing. With structure aligning bearishly across multiple timeframes, the pair presents a short bias opportunity.
🔍 Confluences to Watch 📝
✅ Daily Order Block (OB)
Price reacted from a high-probability bearish OB.
Rejection wicks and a shift in candle body control point to supply dominance.
Momentum is fading, confirming the presence of smart money sellers.
✅ 4H Order Block
Clear mitigation of 4H OB followed by an internal break of structure (iBoS).
Price is respecting the OB zone, printing lower highs beneath key supply.
Perfect mid-timeframe confirmation of trend transition.
✅ 1H Order Block
1H structure shifted bearish, validating LTF trend alignment.
Price building supply chain with continued lower highs and bearish engulfing patterns.
Ideal zone for entry on pullback or liquidity sweep.
📈 Risk Management Protocols
🔑 Core Principles:
💰 Max 1% risk per trade
📍 Only execute at pre-identified zones
⏰ Set alerts — avoid impulsive trades
📉 Respect RR — minimum 1:2 per position
🧠 You're not paid for frequency. You're paid for discipline and execution quality.
🧠 Weekly FRGNT Insight
“Trade what the market gives, not what your ego wants.”
Stay mechanical, stay focused, and allow the probabilities to play out. Your job is to control risk — not the outcome.
🏁 Final Thoughts from FRGNT
📌 The structure is clear.
📌 The confluences are stacked.
📌 The bias is confirmed.
Let your execution reflect your discipline, not your emotions.
❤️ Good luck this week, and as always – I’ll see you at the very top.

GBP/USD - H1- Bearish Flag (07.07.2025)The GBP/USD Pair on the M30 timeframe presents a Potential Selling Opportunity due to a recent Formation of a Bearish Flag Pattern. This suggests a shift in momentum towards the downside in the coming hours.
Possible Short Trade:
Entry: Consider Entering A Short Position around Trendline Of The Pattern.
Target Levels:
1st Support – 1.3520
2nd Support – 1.3460
🎁 Please hit the like button and
🎁 Leave a comment to support for My Post !
Your likes and comments are incredibly motivating and will encourage me to share more analysis with you.
Best Regards, KABHI_TA_TRADING
Thank you.
Disclosure: I am part of Trade Nation's Influencer program and receive a monthly fee for using their TradingView charts in my analysis.

EURGBP Perfect Channel Up giving one more buy opportunity.Last time we looked at the EURGBP pair (May 30, see chart below) we gave the most timely buy signal right at the bottom (Higher Lows trend-line) of the Bullish Megaphone, and the price is only a few candles away from the 0.87400 Target:
If we look at the price action from a 4H perspective we can see that it is a Channel Up that has been driving the pair upwards since the May 28 bottom and today's rebound is taking place after a direct hit on the 4H MA50 (blue trend-line).
This is the start of the new Bullish Leg. Since the previous two have increased by +1.90%, this rally has the potential to even exceed our 0.87400 Target marginally. Still, this is a perfect bullish set-up.
-------------------------------------------------------------------------------
** Please LIKE 👍, FOLLOW ✅, SHARE 🙌 and COMMENT ✍ if you enjoy this idea! Also share your ideas and charts in the comments section below! This is best way to keep it relevant, support us, keep the content here free and allow the idea to reach as many people as possible. **
-------------------------------------------------------------------------------
Disclosure: I am part of Trade Nation's Influencer program and receive a monthly fee for using their TradingView charts in my analysis.
💸💸💸💸💸💸
👇 👇 👇 👇 👇 👇

UK GBP contracts, pound dipsThe British pound continues to have a quiet week. In the European session, GBP/USD is trading at 1.3530, down 0.30% on the day.
The UK wrapped up the week on a down note, as GDP contracted in May by 0.1% m/m. This followed a 0.3% decline in April and missed the consensus of 0.1%. The decline was driven by a 1% decline in manufacturing and a 0.6% contraction in construction, which cancelled out a 0.1% expansion in services.
The GDP contractions in April and May point to a weak second quarter of growth, after an impressive 0.7% gain in the first quarter. The economic landscape remains uncertain and the Bank of England has projected weak growth of 1% for 2025. Governor Bailey has said that the rate path will be "gradually downwards" but hasn't hinted as to the timing of the next cut.
The weak GDP data supports the case for an August rate cut, even though headline inflation is running at 3.4% and core inflation at 3.5%, well above the BoE's target of 2%. The money markets have priced in a quarter-point cut in August at 80%, which would lower the cash rate to 4.0%.
The BoE released its financial stability report earlier in the week, noting that the outlook for UK growth over the coming year is "a little weaker and more uncertain". The Bank highlighted President Trump's tariffs and the conflict in the Middle East. The UK has recently signed a trade deal with the US but some tariffs on UK products remain in effect.
GBP/USD is testing support at 1.3534. Below, there is support at 1.3491
The next resistance lines are 1.3577 and 1.3620

GBPUSD LONG FORECAST Q3 D11 W28 Y25GBPUSD LONG FORECAST Q3 D11 W28 Y25
It’s Fun Coupon Friday! 💸🔥
Professional Risk Managers👋
Welcome back to another FRGNT chart update📈
Diving into some Forex setups using predominantly higher time frame order blocks alongside confirmation breaks of structure.
Let’s see what price action is telling us today!
💡Here are some trade confluences📝
✅Daily order block
✅1H Order block
✅Intraday breaks of structure
✅4H Order block
🔑 Remember, to participate in trading comes always with a degree of risk, therefore as professional risk managers it remains vital that we stick to our risk management plan as well as our trading strategies.
📈The rest, we leave to the balance of probabilities.
💡Fail to plan. Plan to fail.
🏆It has always been that simple.
❤️Good luck with your trading journey, I shall see you at the very top.
🎯Trade consistent, FRGNT X

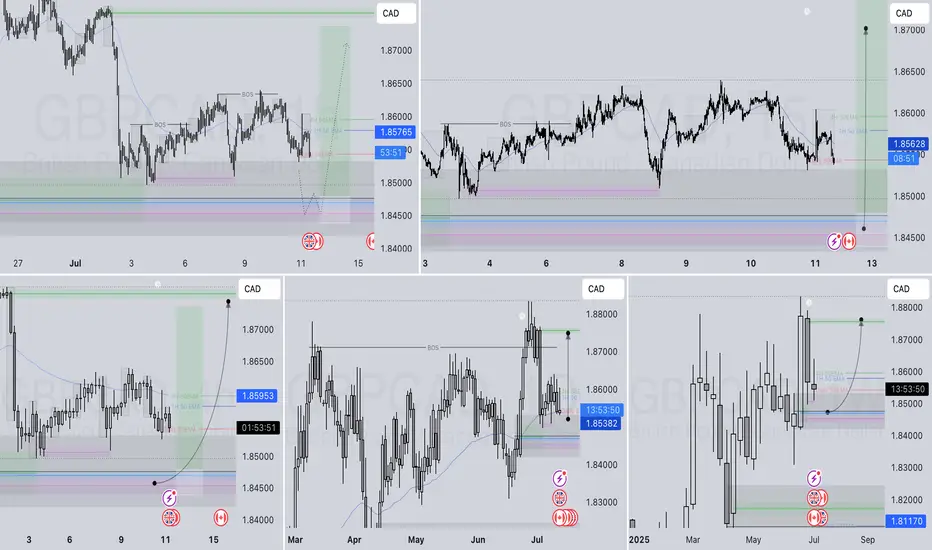
GBPCAD LONG FORECAST Q3 D11 W28 Y25GBPCAD LONG FORECAST Q3 D11 W28 Y25
It’s Fun Coupon Friday! 💸🔥
Professional Risk Managers👋
Welcome back to another FRGNT chart update📈
Diving into some Forex setups using predominantly higher time frame order blocks alongside confirmation breaks of structure.
Let’s see what price action is telling us today! 👀
💡Here are some trade confluences📝
✅Daily Order block identified
✅4H Order Block identified
✅1H Order Block identified
🔑 Remember, to participate in trading comes always with a degree of risk, therefore as professional risk managers it remains vital that we stick to our risk management plan as well as our trading strategies.
📈The rest, we leave to the balance of probabilities.
💡Fail to plan. Plan to fail.
🏆It has always been that simple.
❤️Good luck with your trading journey, I shall see you at the very top.
🎯Trade consistent, FRGNT X
EURGBP SHORT DAILY FORECAST Q3 D11 W28 Y25EURGBP SHORT DAILY FORECAST Q3 D11 W28 Y25
It’s Fun Coupon Friday! 💸🔥
Professional Risk Managers👋
Welcome back to another FRGNT chart update📈
Diving into some Forex setups using predominantly higher time frame order blocks alongside confirmation breaks of structure.
Let’s see what price action is telling us today! 👀
💡Here are some trade confluences📝
✅Daily Order block identified
✅4H Order Block identified
✅1H Order Block identified
🔑 Remember, to participate in trading comes always with a degree of risk, therefore as professional risk managers it remains vital that we stick to our risk management plan as well as our trading strategies.
📈The rest, we leave to the balance of probabilities.
💡Fail to plan. Plan to fail.
🏆It has always been that simple.
❤️Good luck with your trading journey, I shall see you at the very top.
🎯Trade consistent, FRGNT X

Bullish bounce off overlap support?EUR/GBP is falling towards the pivot, which has been identified as an overlap support and could bounce to the 1st resistance, which acts as a pullback resistance.
Pivot: 0.8569
1st Support: 0.8538
1st Resistance: 0.8640
Risk Warning:
Trading Forex and CFDs carries a high level of risk to your capital and you should only trade with money you can afford to lose. Trading Forex and CFDs may not be suitable for all investors, so please ensure that you fully understand the risks involved and seek independent advice if necessary.
Disclaimer:
The above opinions given constitute general market commentary, and do not constitute the opinion or advice of IC Markets or any form of personal or investment advice.
Any opinions, news, research, analyses, prices, other information, or links to third-party sites contained on this website are provided on an "as-is" basis, are intended only to be informative, is not an advice nor a recommendation, nor research, or a record of our trading prices, or an offer of, or solicitation for a transaction in any financial instrument and thus should not be treated as such. The information provided does not involve any specific investment objectives, financial situation and needs of any specific person who may receive it. Please be aware, that past performance is not a reliable indicator of future performance and/or results. Past Performance or Forward-looking scenarios based upon the reasonable beliefs of the third-party provider are not a guarantee of future performance. Actual results may differ materially from those anticipated in forward-looking or past performance statements. IC Markets makes no representation or warranty and assumes no liability as to the accuracy or completeness of the information provided, nor any loss arising from any investment based on a recommendation, forecast or any information supplied by any third-party.

GBPNZD to find buyers at current market price?GBPNZD - 24h expiry
The medium term bias remains bullish.
We look for a temporary move lower. Preferred trade is to buy on dips.
Bespoke support is located at 2.2485.
Risk/Reward is ample to buy at market.
We look to Buy at 2.2485 (stop at 2.2430)
Our profit targets will be 2.2705 and 2.2730
Resistance: 2.2650 / 2.2740 / 2.2790
Support: 2.2500 / 2.2450 / 2.2410
Risk Disclaimer
The trade ideas beyond this page are for informational purposes only and do not constitute investment advice or a solicitation to trade. This information is provided by Signal Centre, a third-party unaffiliated with OANDA, and is intended for general circulation only. OANDA does not guarantee the accuracy of this information and assumes no responsibilities for the information provided by the third party. The information does not take into account the specific investment objectives, financial situation, or particular needs of any particular person. You should take into account your specific investment objectives, financial situation, and particular needs before making a commitment to trade, including seeking advice from an independent financial adviser regarding the suitability of the investment, under a separate engagement, as you deem fit.
You accept that you assume all risks in independently viewing the contents and selecting a chosen strategy.
Where the research is distributed in Singapore to a person who is not an Accredited Investor, Expert Investor or an Institutional Investor, Oanda Asia Pacific Pte Ltd (“OAP“) accepts legal responsibility for the contents of the report to such persons only to the extent required by law. Singapore customers should contact OAP at 6579 8289 for matters arising from, or in connection with, the information/research distributed.

GBPJPY - Multi-Year Short Update! In our last setup for GBPJPY, we identified a massive diagonal pattern, with price completing wave 4 and preparing for a multi-year drop into wave 5.
Since then, price has played out exactly as forecasted — we've seen a clean impulse lower for wave 1, followed by an ABC correction for wave 2, which looks to have now completed.
This sets the stage for the next major leg — wave 3 of 5 — which historically carries the most power and momentum.
📉 See monthly chart here:
📊 GBP/JPY Wave‑3 Trade Idea
Background:
We’ve completed wave 1 down and wave 2 up (ABC correction).
GBPJPY is now positioned to start a powerful wave 3 down — the most impulsive leg in an Elliott sequence.
🔍 Current Price Action:
Price is rejecting major resistance (previous wave A high + shaded zone)
Structure shows a completed 5-wave move up within C, suggesting exhaustion.
A clean ascending trendline (red) has formed under wave v — a break here signals the first confirmation.
Option 1 – Aggressive Entry:
- Trigger: Break and close below the red trendline (~198.00–197.80 zone) on the daily.
- Entry: On candle close below trendline
- Stop Loss: Above recent high ~199.80 and then breakeven once we move lower
Option 2 – Conservative Entry (preferred):
- Trigger: Trendline break + correction
- Entry: On bearish confirmation and then a correction to indicate further downside
- Stop Loss: Above recent high ~199.80 and then breakeven once we move lower
Take Profit Levels:
- TP1: 192
- TP2: 180
- TP3: 175
- Final Target: Trail for extended move toward wave (3) lows (could be 10,000+ pips over long term)
🔐 Invalidation:
Daily close back above 200.00 or impulsive rally beyond the pink resistance zone invalidates the short bias in the short term.
✅ Summary:
This is a high-conviction, structure-backed setup with:
- Wave count + Fib confluence
- Bearish structure at key resistance
- Confirmation-based trigger (trendline break + retest)
- Excellent long-term risk-to-reward profile
📂 Previous GBPJPY Setups (Track Record):
📌 Free Setup (Big Picture Outlook) – Multi-Year Shorts Incoming (Wave 4 Completion)
✅ Swing 1 – 1,200 Pips (VIP GBPJPY Long)
✅ Swing 2 – 1,000 Pips (VIP GBPJPY Short)
✅ Swing 3 – 1,100 Pips (VIP GBPJPY Short)
✅ Swing 4 – 700 Pips (VIP GBPJPY Short)

Bullish reversal?The Cable (GBP/USD) has bounced off the pivot and could rise to the 38.2% Fibonacci resistance.
Pivot: 1.3529
1st Support: 1.3457
1st Resistance: 1.3633
Risk Warning:
Trading Forex and CFDs carries a high level of risk to your capital and you should only trade with money you can afford to lose. Trading Forex and CFDs may not be suitable for all investors, so please ensure that you fully understand the risks involved and seek independent advice if necessary.
Disclaimer:
The above opinions given constitute general market commentary, and do not constitute the opinion or advice of IC Markets or any form of personal or investment advice.
Any opinions, news, research, analyses, prices, other information, or links to third-party sites contained on this website are provided on an "as-is" basis, are intended only to be informative, is not an advice nor a recommendation, nor research, or a record of our trading prices, or an offer of, or solicitation for a transaction in any financial instrument and thus should not be treated as such. The information provided does not involve any specific investment objectives, financial situation and needs of any specific person who may receive it. Please be aware, that past performance is not a reliable indicator of future performance and/or results. Past Performance or Forward-looking scenarios based upon the reasonable beliefs of the third-party provider are not a guarantee of future performance. Actual results may differ materially from those anticipated in forward-looking or past performance statements. IC Markets makes no representation or warranty and assumes no liability as to the accuracy or completeness of the information provided, nor any loss arising from any investment based on a recommendation, forecast or any information supplied by any third-party.

GBP/AUD - Bearish Flag (10.07.2025)The GBP/AUD Pair on the M30 timeframe presents a Potential Selling Opportunity due to a recent Formation of a Bearish Flag Pattern. This suggests a shift in momentum towards the downside in the coming hours.
Possible Short Trade:
Entry: Consider Entering A Short Position around Trendline Of The Pattern.
Target Levels:
1st Support – 2.0671
2nd Support – 2.0607
🎁 Please hit the like button and
🎁 Leave a comment to support for My Post !
Your likes and comments are incredibly motivating and will encourage me to share more analysis with you.
Best Regards, KABHI_TA_TRADING
Thank you.
Disclosure: I am part of Trade Nation's Influencer program and receive a monthly fee for using their TradingView charts in my analysis.

GBPNZD | Potential Buy opportunityHey Traders!
We’re taking a shot on GBPNZD — it looks like a solid setup for a move to the upside. Price is currently sitting right on the 4H 50MA, and the 1H 200MA is also aligned at the exact same level, giving this zone even more weight. Our stop loss is tight, risking just a 1:1 minimum, so the downside is limited. On top of that, the Fib is drawn from top to bottom and the 0.5 level lines up perfectly with this area, which adds another layer of confidence. If this zone holds, there’s a good chance we’ll see price continue pushing up.

07.07.2025 #GBPCHFBUY 1.08150 | STOP 1.07500 | TAKE 1.08950 | Initial upward movement around a strong range of local support.
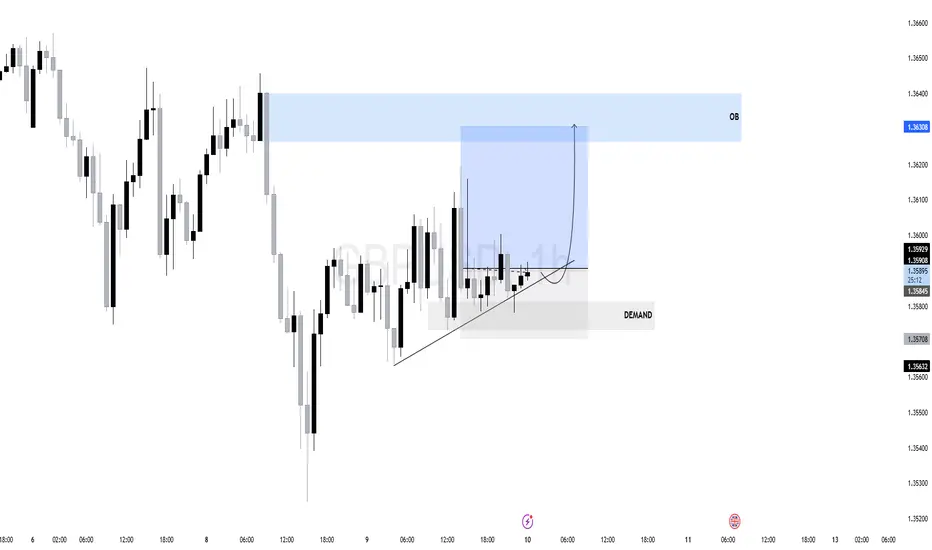
$GU (GBPUSD) 1HPrice has been consolidating after a previous sell-off and is now showing signs of accumulation above a defined demand zone (1.35600–1.35800).
The price has respected the ascending internal trendline, forming higher lows — an early sign of bullish intent.
Strong bullish rejection from this area confirms interest from smart money. Price tested it and immediately rebounded, signaling absorption of sell-side liquidity.
The internal ascending trendline continues to act as dynamic support. As long as price respects this trendline, bullish bias remains intact.
Multiple highs around 1.36300 remain untouched — a magnet for price.That area overlaps with an Order Block (OB), making it a high-probability target for institutional interest.
The tight consolidation before the expansion (highlighted in blue) suggests price is loading for a sharp move.
As long as price remains above the demand zone and trendline A bullish expansion toward the OB zone (1.36300–1.36400) Or A potential liquidity sweep above the highs, aligning with external liquidity targets.
Bearish drop for the Cable?The price is rising towards the pivot and could drop to the 1st support which is a pullback support.
Pivot: 1.3632
1st Support: 1.3503
1st Resistance: 1.3693
Risk Warning:
Trading Forex and CFDs carries a high level of risk to your capital and you should only trade with money you can afford to lose. Trading Forex and CFDs may not be suitable for all investors, so please ensure that you fully understand the risks involved and seek independent advice if necessary.
Disclaimer:
The above opinions given constitute general market commentary, and do not constitute the opinion or advice of IC Markets or any form of personal or investment advice.
Any opinions, news, research, analyses, prices, other information, or links to third-party sites contained on this website are provided on an "as-is" basis, are intended only to be informative, is not an advice nor a recommendation, nor research, or a record of our trading prices, or an offer of, or solicitation for a transaction in any financial instrument and thus should not be treated as such. The information provided does not involve any specific investment objectives, financial situation and needs of any specific person who may receive it. Please be aware, that past performance is not a reliable indicator of future performance and/or results. Past Performance or Forward-looking scenarios based upon the reasonable beliefs of the third-party provider are not a guarantee of future performance. Actual results may differ materially from those anticipated in forward-looking or past performance statements. IC Markets makes no representation or warranty and assumes no liability as to the accuracy or completeness of the information provided, nor any loss arising from any investment based on a recommendation, forecast or any information supplied by any third-party.

GBPUSD - Macro Trend Continues!Hello TradingView Family / Fellow Traders. This is Richard, also known as theSignalyst.
📈GBPUSD has been overall bullish trading within the rising channel marked in red. And it is currently retesting the lower bound of the channel.
Moreover, the green zone is a strong structure.
🏹 Thus, the highlighted blue circle is a strong area to look for buy setups as it is the intersection of the lower red trendline and structure.
📚 As per my trading style:
As #GBPUSD approaches the blue circle zone, I will be looking for bullish reversal setups (like a double bottom pattern, trendline break , and so on...)
📚 Always follow your trading plan regarding entry, risk management, and trade management.
Good luck!
All Strategies Are Good; If Managed Properly!
~Rich
Disclosure: I am part of Trade Nation's Influencer program and receive a monthly fee for using their TradingView charts in my analysis.

Bullish bounce?The Cable (GBP/USD) has bounced off the pivot and oculd rise to the 1st resistance which is a an overlap resistance.
Pivot: 1.3531
1st Support: 1.3423
1st Resistance: 1.3675
Risk Warning:
Trading Forex and CFDs carries a high level of risk to your capital and you should only trade with money you can afford to lose. Trading Forex and CFDs may not be suitable for all investors, so please ensure that you fully understand the risks involved and seek independent advice if necessary.
Disclaimer:
The above opinions given constitute general market commentary, and do not constitute the opinion or advice of IC Markets or any form of personal or investment advice.
Any opinions, news, research, analyses, prices, other information, or links to third-party sites contained on this website are provided on an "as-is" basis, are intended only to be informative, is not an advice nor a recommendation, nor research, or a record of our trading prices, or an offer of, or solicitation for a transaction in any financial instrument and thus should not be treated as such. The information provided does not involve any specific investment objectives, financial situation and needs of any specific person who may receive it. Please be aware, that past performance is not a reliable indicator of future performance and/or results. Past Performance or Forward-looking scenarios based upon the reasonable beliefs of the third-party provider are not a guarantee of future performance. Actual results may differ materially from those anticipated in forward-looking or past performance statements. IC Markets makes no representation or warranty and assumes no liability as to the accuracy or completeness of the information provided, nor any loss arising from any investment based on a recommendation, forecast or any information supplied by any third-party.

GBP/JPY: Total Confluence Targeting 202.05 BreakoutThis is a high-conviction trade setup based on a powerful confluence of fundamental drivers and multi-timeframe technical alignment. We are anticipating a bullish breakout in GBP/JPY, catalyzed by the upcoming UK GDP data release. The price action has formed a classic "coiled spring" pattern, indicating a significant buildup of energy before a potential move higher.
The analysis is based on pure price action, structure, and macroeconomics. The chart is kept intentionally clean to highlight the strength of the setup itself.
The Fundamental Why 📰
Two core data-driven factors underpin this trade:
1️⃣ Macro Policy Divergence: The primary long-term driver is the stark monetary policy difference between a relatively hawkish Bank of England (BoE), which is still fighting inflation, and an ultra-dovish Bank of Japan (BoJ). This fundamental imbalance creates a natural tailwind for GBP/JPY.
2️⃣ Positive Leading Indicators: Recent economic data from the UK has shown surprising strength. Both the Services and Manufacturing PMIs for June beat expectations, suggesting underlying resilience in the economy. This points to a higher probability of an upside surprise in Friday's GDP figures, which would be the direct catalyst for a breakout.
The Technical Picture 📊
Our confidence comes from a rare "Total Confluence," where every timeframe tells the same bullish story.
The Monthly Chart (Strategic View): Shows a powerful, multi-year uptrend that has decisively broken the critical 8-year resistance from the 2015 highs. The macro trend is undeniably bullish.
The Weekly Chart (The Confirmation): Confirms the uptrend is resuming now after breaking out of a year-long bullish continuation pattern. The "resting" phase appears to be over.
The 4-Hour Chart (The Setup): This is the "coiled spring." Price is consolidating in a very tight range right underneath the key breakout level of 199.45. This shows a lack of sellers and a buildup of buying pressure.
Fibonacci Confluence: Our take profit target is not random. It aligns perfectly with the 1.272 Trend-Based Fibonacci Extension, giving us objective, mathematical confirmation for the target at 202.05.
The Trade Plan ✅
This is a "set and forget" breakout strategy. The order should be placed as a Buy Stop to capture the momentum as it breaks higher.
📉 Asset: GBP/JPY
👉 Entry (Buy Stop): 199.85
⛔️ Stop Loss: 198.75
🎯 Take Profit: 202.05
🧠 Risk/Reward: 1:2
This analysis is for educational purposes. Always conduct your own research and manage your risk appropriately. Good luck.

Bullish bounce?GBP/USD has bounced off the support level which is a pullback support that aligns with the 61.8% Fibonacci retracement and could rise from this level too ur take profit.
Entry: 1.3531
Why we like it:
There is a pullback support level that aligns with the 61.8% Fibonacci retracement.
Stop loss: 1.3450
Why we like it:
There is a pullback support level that lines up with the 78.6% Fibonacci retracement.
Take profit: 1.3688
Why we like it:
There is an overlap resistance level that aligns with the 61.8% Fibonacci retracement.
Enjoying your TradingView experience? Review us!
Please be advised that the information presented on TradingView is provided to Vantage (‘Vantage Global Limited’, ‘we’) by a third-party provider (‘Everest Fortune Group’). Please be reminded that you are solely responsible for the trading decisions on your account. There is a very high degree of risk involved in trading. Any information and/or content is intended entirely for research, educational and informational purposes only and does not constitute investment or consultation advice or investment strategy. The information is not tailored to the investment needs of any specific person and therefore does not involve a consideration of any of the investment objectives, financial situation or needs of any viewer that may receive it. Kindly also note that past performance is not a reliable indicator of future results. Actual results may differ materially from those anticipated in forward-looking or past performance statements. We assume no liability as to the accuracy or completeness of any of the information and/or content provided herein and the Company cannot be held responsible for any omission, mistake nor for any loss or damage including without limitation to any loss of profit which may arise from reliance on any information supplied by Everest Fortune Group.

EURGBP SHORT DAILY FORECAST Q3 D8 W28 Y25EURGBP SHORT DAILY FORECAST Q3 D8 W28 Y25
Professional Risk Managers👋
Welcome back to another FRGNT chart update📈
Diving into some Forex setups using predominantly higher time frame order blocks alongside confirmation breaks of structure.
Let’s see what price action is telling us today! 👀
💡Here are some trade confluences📝
✅Daily Order block identified
✅4H Order Block identified
✅1H Order Block identified
🔑 Remember, to participate in trading comes always with a degree of risk, therefore as professional risk managers it remains vital that we stick to our risk management plan as well as our trading strategies.
📈The rest, we leave to the balance of probabilities.
💡Fail to plan. Plan to fail.
🏆It has always been that simple.
❤️Good luck with your trading journey, I shall see you at the very top.
🎯Trade consistent, FRGNT X
