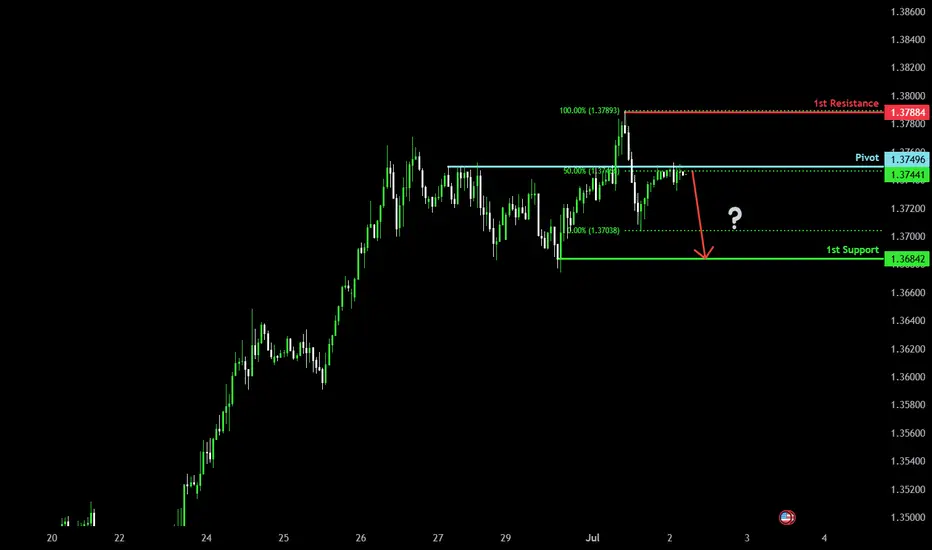
Bearish drop?The Cable (GBP/USD) is reacting off the pivot and could drop to the 1st support.
Pivot: 1.3749
1st Support: 1.3684
1st Resistance: 1.3788
Risk Warning:
Trading Forex and CFDs carries a high level of risk to your capital and you should only trade with money you can afford to lose. Trading Forex and CFDs may not be suitable for all investors, so please ensure that you fully understand the risks involved and seek independent advice if necessary.
Disclaimer:
The above opinions given constitute general market commentary, and do not constitute the opinion or advice of IC Markets or any form of personal or investment advice.
Any opinions, news, research, analyses, prices, other information, or links to third-party sites contained on this website are provided on an "as-is" basis, are intended only to be informative, is not an advice nor a recommendation, nor research, or a record of our trading prices, or an offer of, or solicitation for a transaction in any financial instrument and thus should not be treated as such. The information provided does not involve any specific investment objectives, financial situation and needs of any specific person who may receive it. Please be aware, that past performance is not a reliable indicator of future performance and/or results. Past Performance or Forward-looking scenarios based upon the reasonable beliefs of the third-party provider are not a guarantee of future performance. Actual results may differ materially from those anticipated in forward-looking or past performance statements. IC Markets makes no representation or warranty and assumes no liability as to the accuracy or completeness of the information provided, nor any loss arising from any investment based on a recommendation, forecast or any information supplied by any third-party.
GBP (British Pound)
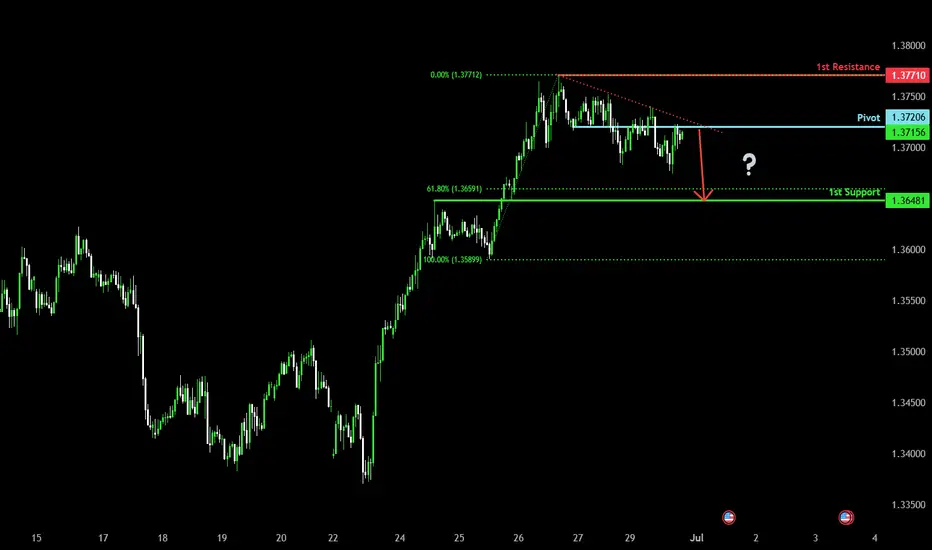
Bearish drop?The Cable (GBP/USD) is reacting off the pivot and could drop to the 1st support.
Pivot: 1.3720
1st Support: 1.3648
1st Resistance: 1.3771
Risk Warning:
Trading Forex and CFDs carries a high level of risk to your capital and you should only trade with money you can afford to lose. Trading Forex and CFDs may not be suitable for all investors, so please ensure that you fully understand the risks involved and seek independent advice if necessary.
Disclaimer:
The above opinions given constitute general market commentary, and do not constitute the opinion or advice of IC Markets or any form of personal or investment advice.
Any opinions, news, research, analyses, prices, other information, or links to third-party sites contained on this website are provided on an "as-is" basis, are intended only to be informative, is not an advice nor a recommendation, nor research, or a record of our trading prices, or an offer of, or solicitation for a transaction in any financial instrument and thus should not be treated as such. The information provided does not involve any specific investment objectives, financial situation and needs of any specific person who may receive it. Please be aware, that past performance is not a reliable indicator of future performance and/or results. Past Performance or Forward-looking scenarios based upon the reasonable beliefs of the third-party provider are not a guarantee of future performance. Actual results may differ materially from those anticipated in forward-looking or past performance statements. IC Markets makes no representation or warranty and assumes no liability as to the accuracy or completeness of the information provided, nor any loss arising from any investment based on a recommendation, forecast or any information supplied by any third-party.
Falling towards pullback support?GBP?USD is falling towards the support level which is a pullback support that lines up with the 38.2% Fibonacci retracement and could drop from this level to our take profit.
Entry: 1.3609
Why we like it:
There is a pullback support level that lines up with the 38.2% Fibonacci retracement.
Stop loss: 1.3534
Why we like it:
There is a pullback support.
Take profit: 1.3746
Why we like it:
There is a pullback resistance.
Enjoying your TradingView experience? Review us!
Please be advised that the information presented on TradingView is provided to Vantage (‘Vantage Global Limited’, ‘we’) by a third-party provider (‘Everest Fortune Group’). Please be reminded that you are solely responsible for the trading decisions on your account. There is a very high degree of risk involved in trading. Any information and/or content is intended entirely for research, educational and informational purposes only and does not constitute investment or consultation advice or investment strategy. The information is not tailored to the investment needs of any specific person and therefore does not involve a consideration of any of the investment objectives, financial situation or needs of any viewer that may receive it. Kindly also note that past performance is not a reliable indicator of future results. Actual results may differ materially from those anticipated in forward-looking or past performance statements. We assume no liability as to the accuracy or completeness of any of the information and/or content provided herein and the Company cannot be held responsible for any omission, mistake nor for any loss or damage including without limitation to any loss of profit which may arise from reliance on any information supplied by Everest Fortune Group.

GBP-CHF Bearish Breakout! Sell!
Hello,Traders!
GBP-CHF formed a H&S
Pattern and now we are
Seeing a strong bearish
Breakout of the neckline
Key level around 1.0933
Area and as the breakout
Is confirmed we will be
Expecting a further bearish
Move down towards the
Target below around 1.0867
Sell!
Comment and subscribe to help us grow!
Check out other forecasts below too!
Disclosure: I am part of Trade Nation's Influencer program and receive a monthly fee for using their TradingView charts in my analysis.

GBPCHF My Opinion! BUY!
My dear followers,
I analysed this chart on GBPCHF and concluded the following:
The market is trading on 1.0911 pivot level.
Bias - Bullish
Technical Indicators: Both Super Trend & Pivot HL indicate a highly probable Bullish continuation.
Target - 1.0951
About Used Indicators:
A super-trend indicator is plotted on either above or below the closing price to signal a buy or sell. The indicator changes color, based on whether or not you should be buying. If the super-trend indicator moves below the closing price, the indicator turns green, and it signals an entry point or points to buy.
Disclosure: I am part of Trade Nation's Influencer program and receive a monthly fee for using their TradingView charts in my analysis.
———————————
WISH YOU ALL LUCK

GBPCHF Is Bearish! Sell!
Here is our detailed technical review for GBPCHF.
Time Frame: 4h
Current Trend: Bearish
Sentiment: Overbought (based on 7-period RSI)
Forecast: Bearish
The market is trading around a solid horizontal structure 1.100.
The above observations make me that the market will inevitably achieve 1.091 level.
P.S
We determine oversold/overbought condition with RSI indicator.
When it drops below 30 - the market is considered to be oversold.
When it bounces above 70 - the market is considered to be overbought.
Disclosure: I am part of Trade Nation's Influencer program and receive a monthly fee for using their TradingView charts in my analysis.
Like and subscribe and comment my ideas if you enjoy them!

GBPCHF Will Go Higher From Support! Buy!
The market is on a crucial zone of demand 1.097.
The oversold market condition in a combination with key structure gives us a relatively strong bullish signal with goal 1.100 level.
P.S
Please, note that an oversold/overbought condition can last for a long time, and therefore being oversold/overbought doesn't mean a price rally will come soon, or at all.
Disclosure: I am part of Trade Nation's Influencer program and receive a monthly fee for using their TradingView charts in my analysis.
Like and subscribe and comment my ideas if you enjoy them!

GBP/CHF BULLS WILL DOMINATE THE MARKET|LONG
Hello, Friends!
GBP-CHF downtrend evident from the last 1W red candle makes longs trades more risky, but the current set-up targeting 1.096 area still presents a good opportunity for us to buy the pair because the support line is nearby and the BB lower band is close which indicates the oversold state of the GBP/CHF pair.
Disclosure: I am part of Trade Nation's Influencer program and receive a monthly fee for using their TradingView charts in my analysis.
✅LIKE AND COMMENT MY IDEAS✅

GBPCHFAnalysis complete — scenarios outlined. The zone could be a decision point for . Price reaction here may define the next move.
If price breaks and pulls back to retest, a reversal setup might emerge.

Bullish continuation?The Cable (GBP/USD) is falling towards the pivot, which acts as a pullback support and could bounce to the 1st resistance.
Pivot: 1.3617
1st Support: 1.3442
1st Resistance: 1.3795
Risk Warning:
Trading Forex and CFDs carries a high level of risk to your capital and you should only trade with money you can afford to lose. Trading Forex and CFDs may not be suitable for all investors, so please ensure that you fully understand the risks involved and seek independent advice if necessary.
Disclaimer:
The above opinions given constitute general market commentary, and do not constitute the opinion or advice of IC Markets or any form of personal or investment advice.
Any opinions, news, research, analyses, prices, other information, or links to third-party sites contained on this website are provided on an "as-is" basis, are intended only to be informative, is not an advice nor a recommendation, nor research, or a record of our trading prices, or an offer of, or solicitation for a transaction in any financial instrument and thus should not be treated as such. The information provided does not involve any specific investment objectives, financial situation and needs of any specific person who may receive it. Please be aware, that past performance is not a reliable indicator of future performance and/or results. Past Performance or Forward-looking scenarios based upon the reasonable beliefs of the third-party provider are not a guarantee of future performance. Actual results may differ materially from those anticipated in forward-looking or past performance statements. IC Markets makes no representation or warranty and assumes no liability as to the accuracy or completeness of the information provided, nor any loss arising from any investment based on a recommendation, forecast or any information supplied by any third-party.

GBP/USD Bearish Reversal Pattern Detected GBP/USD Bearish Reversal Pattern Detected 🔻🦈
The chart illustrates a potential bearish Gartley pattern formation near the 1.3736 resistance zone, which has historically triggered price rejections (red arrows).
🔍 Key Observations:
📌 Price action completed a bearish harmonic pattern, suggesting a reversal setup.
💡 Multiple rejections at the upper resistance zone (1.3730–1.3780) highlight strong selling pressure.
📉 Break of trendline support confirms shift in structure.
🟠 Historical support zones (orange circles) now align with the projected target level: 1.3512.
🔽 A clean breakdown below 1.3650 could accelerate bearish momentum toward the target.
🎯 Target: 1.35124
🛑 Resistance: 1.3730–1.3780
✅ Support: 1.3510–1.3550 zone

GBPCHF: Will Start Growing! Here is Why
The charts are full of distraction, disturbance and are a graveyard of fear and greed which shall not cloud our judgement on the current state of affairs in the GBPCHF pair price action which suggests a high likelihood of a coming move up.
Disclosure: I am part of Trade Nation's Influencer program and receive a monthly fee for using their TradingView charts in my analysis.
❤️ Please, support our work with like & comment! ❤️

GBP_CHF RISKY LONG|
✅GBP_CHF fell down sharply
But a strong support level was hit at 1.0932
Thus as a rebound is already happening
A move up towards the target of 1.0970 shall follow
LONG🚀
✅Like and subscribe to never miss a new idea!✅
Disclosure: I am part of Trade Nation's Influencer program and receive a monthly fee for using their TradingView charts in my analysis.

GBPCHF bearish for the week of 30 JuneI am planning to short GBPCHF next week. A Head and shoulder pattern in an existing bearish move signifies a continuation. My trade will be executed on H1 time frame with confluence factors that support a bearish continuation.
A break below the neck line and pull back followed by a strong bearish candle would be ideal.
This is not a trade recommendation; it’s merely my own analysis. Trading carries a high level of risk so carefully managing your capital and risk is important. If you like my idea, please give a “boost” and follow me to get even more.
It’s not whether you are right or wrong, but how much money you make when you are right and how much you lose when you are wrong – George Soros

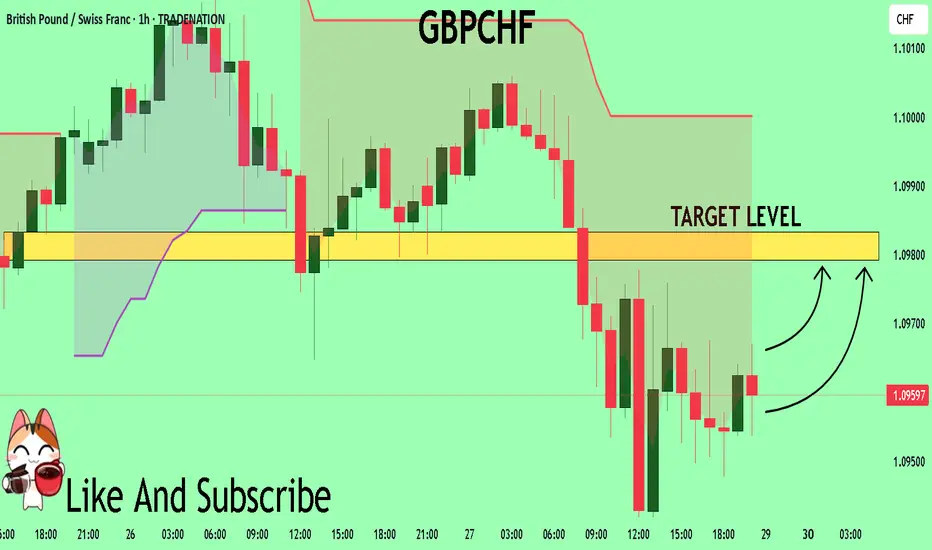
GBPCHF Technical Analysis! BUY!
My dear subscribers,
GBPCHF looks like it will make a good move, and here are the details:
The market is trading on 1.0959 pivot level.
Bias - Bullish
Technical Indicators: Both Super Trend & Pivot HL indicate a highly probable Bullish continuation.
Target - 1.0979
About Used Indicators:
The average true range (ATR) plays an important role in 'Supertrend' as the indicator uses ATR to calculate its value. The ATR indicator signals the degree of price volatility.
Disclosure: I am part of Trade Nation's Influencer program and receive a monthly fee for using their TradingView charts in my analysis.
———————————
WISH YOU ALL LUCK
GBPJPY Potential UpsidesHey Traders, in the coming week we are monitoring GBPJPY for a buying opportunity around 198.100 zone, GBPJPY is trading in an uptrend and currently is in a correction phase in which it is approaching the trend at 198.100 support and resistance area.
Trade safe, Joe.

GBPCHF Is Going Up! Buy!
Please, check our technical outlook for GBPCHF.
Time Frame: 2h
Current Trend: Bullish
Sentiment: Oversold (based on 7-period RSI)
Forecast: Bullish
The price is testing a key support 1.095.
Current market trend & oversold RSI makes me think that buyers will push the price. I will anticipate a bullish movement at least to 1.098 level.
P.S
The term oversold refers to a condition where an asset has traded lower in price and has the potential for a price bounce.
Overbought refers to market scenarios where the instrument is traded considerably higher than its fair value. Overvaluation is caused by market sentiments when there is positive news.
Disclosure: I am part of Trade Nation's Influencer program and receive a monthly fee for using their TradingView charts in my analysis.
Like and subscribe and comment my ideas if you enjoy them!

GBP-CHF Rebound Ahead! Buy!
Hello,Traders!
GBP-CHF is hovering above
The wide horizontal demand
Level around 1.0926 from
Where we are already
Seeing a bullish rebound
So a further local bullish
Move up is to be expected
Buy!
Comment and subscribe to help us grow!
Check out other forecasts below too!
Disclosure: I am part of Trade Nation's Influencer program and receive a monthly fee for using their TradingView charts in my analysis.

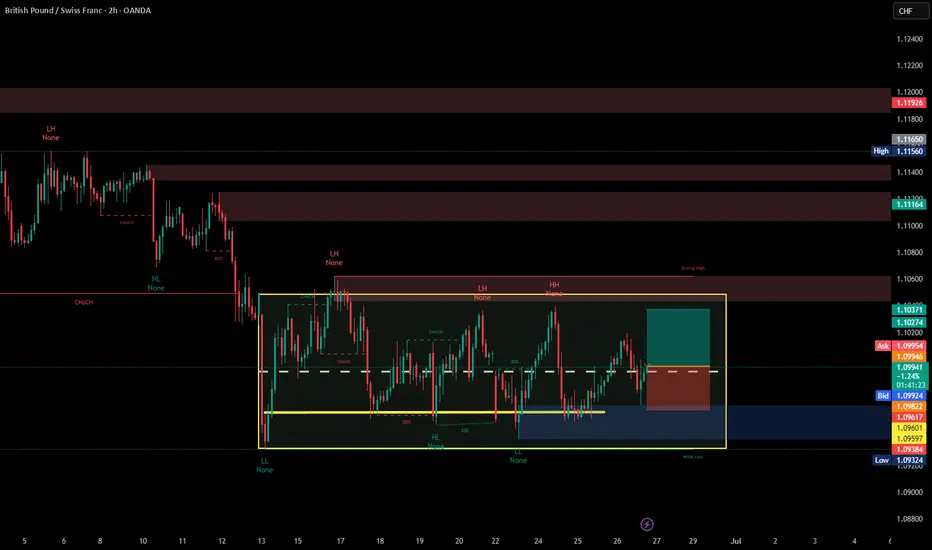
GBPCHF BuyStrong Sell-Off Previously:
The chart shows a sharp downtrend, confirmed by a Change of Character (CHoCH) marking a shift from bullish to bearish structure.
Multiple Lower Highs (LH) and Lower Lows (LL) further validate the downtrend.
Support Zone Identified:
The area marked in blue (buy zone) is a strong demand zone.
It's located at the range low where price has repeatedly tested and rejected (highlighted by Equal Lows (EQL)), suggesting strong liquidity and accumulation.
Shift in Market Structure:
Near the buy zone, a Break of Structure (BOS) and another CHoCH hint at a shift from bearish to bullish sentiment.
The price forms a Higher Low (HL), indicating buyers are gaining strength.
Risk/Reward Favorable:
The long position is placed within the demand zone.
The reward area (green box) is positioned towards the next resistance zone, aligning with a favorable risk/reward ratio.
GBP/CAD - Breakout (27.06.2025)The GBP/CAD pair on the M30 timeframe presents a Potential Buying Opportunity due to a recent Formation of a Breakout Pattern. This suggests a shift in momentum towards the upside and a higher likelihood of further advances in the coming hours.
Possible Long Trade:
Entry: Consider Entering A Long Position around Trendline Of The Pattern.
Target Levels:
1st Resistance – 1..8857
2nd Resistance – 1.8909
🎁 Please hit the like button and
🎁 Leave a comment to support for My Post !
Your likes and comments are incredibly motivating and will encourage me to share more analysis with you.
Best Regards, KABHI_TA_TRADING
Thank you.
Disclosure: I am part of Trade Nation's Influencer program and receive a monthly fee for using their TradingView charts in my analysis.

Bearish drop?EUR/GBP is rising towards the pivot that aligns with the 38.2% Fibonacci retracement and could drop to the 1st support.
Pivot: 0.8530
1st Support: 0.8482
1st Resistance: 0.8569
Risk Warning:
Trading Forex and CFDs carries a high level of risk to your capital and you should only trade with money you can afford to lose. Trading Forex and CFDs may not be suitable for all investors, so please ensure that you fully understand the risks involved and seek independent advice if necessary.
Disclaimer:
The above opinions given constitute general market commentary, and do not constitute the opinion or advice of IC Markets or any form of personal or investment advice.
Any opinions, news, research, analyses, prices, other information, or links to third-party sites contained on this website are provided on an "as-is" basis, are intended only to be informative, is not an advice nor a recommendation, nor research, or a record of our trading prices, or an offer of, or solicitation for a transaction in any financial instrument and thus should not be treated as such. The information provided does not involve any specific investment objectives, financial situation and needs of any specific person who may receive it. Please be aware, that past performance is not a reliable indicator of future performance and/or results. Past Performance or Forward-looking scenarios based upon the reasonable beliefs of the third-party provider are not a guarantee of future performance. Actual results may differ materially from those anticipated in forward-looking or past performance statements. IC Markets makes no representation or warranty and assumes no liability as to the accuracy or completeness of the information provided, nor any loss arising from any investment based on a recommendation, forecast or any information supplied by any third-party.

Bullish continuation?GBP/CAD is falling towards the pivot and could bounce to the 1st resistance which is a pullback resistance.
Pivot: 1.8664
1st Support: 1.8590
1st Resistance: 1.8825
Risk Warning:
Trading Forex and CFDs carries a high level of risk to your capital and you should only trade with money you can afford to lose. Trading Forex and CFDs may not be suitable for all investors, so please ensure that you fully understand the risks involved and seek independent advice if necessary.
Disclaimer:
The above opinions given constitute general market commentary, and do not constitute the opinion or advice of IC Markets or any form of personal or investment advice.
Any opinions, news, research, analyses, prices, other information, or links to third-party sites contained on this website are provided on an "as-is" basis, are intended only to be informative, is not an advice nor a recommendation, nor research, or a record of our trading prices, or an offer of, or solicitation for a transaction in any financial instrument and thus should not be treated as such. The information provided does not involve any specific investment objectives, financial situation and needs of any specific person who may receive it. Please be aware, that past performance is not a reliable indicator of future performance and/or results. Past Performance or Forward-looking scenarios based upon the reasonable beliefs of the third-party provider are not a guarantee of future performance. Actual results may differ materially from those anticipated in forward-looking or past performance statements. IC Markets makes no representation or warranty and assumes no liability as to the accuracy or completeness of the information provided, nor any loss arising from any investment based on a recommendation, forecast or any information supplied by any third-party.

Can PCE data rescue the dollar? JPY, EUR, GBP setup in playThe latest U.S. PCE report is set for release at 8:30am EDT, with both headline and core inflation expected at 0.1% month-on-month.
As the Fed’s preferred inflation measure, today’s figures could influence interest rate expectations. A stronger print may reduce the case for a July rate cut, while a softer result could add pressure on the U.S. dollar.
The dollar has already weakened this week amid speculation over central bank independence (trump is reportedly considering nominating Fed chair Jerome Powell’s successor earlier than normal in order to undermine the current chair).
Pairs to watch include, EUR/USD, GBP/USD, USD/JPY with symmetrical triangle formations suggesting breakout potential in either direction for all once the data hits.
