gbpusdThere is a high probability of a reversal within the specified range
The daily trend line at the ceiling has also caused the price to reverse
The sell order has a higher probability of success than the specified targets
The risk to reward is excellent
GBP (British Pound)

GBPUSD 1H | Bearish Divergence GBPUSD has reached a critical technical zone where multiple confluences are signaling a downside correction:
✅ Bearish Divergence spotted on RSI at the top, indicating momentum exhaustion.
✅ Price got rejected from a strong Daily Supply Zone, showing clear institutional selling pressure.
✅ On the LTF (Lower Timeframe), structure has shifted — new Lower Highs (LH) and Lower Lows (LL) are now printing, confirming a short-term bearish trend change.
✅ Price also broke the LTF trendline and is retesting, adding further bearish confluence.
📊 Bias:
Expecting a corrective move to the downside with targets around previous liquidity zones:
⚠️ Market is still sensitive to USD fundamentals this week, so watch key news events for volatility spikes.
🔔 Wait for proper confirmations and manage risk accordingly.

GBPCHF INTRADAY bearish below 1.1070Key Support and Resistance Levels
Resistance Level 1: 1.1070
Resistance Level 2: 1.1120
Resistance Level 3: 1.1170
Support Level 1: 1.0915
Support Level 2: 1.0865
Support Level 3: 1.0815
This communication is for informational purposes only and should not be viewed as any form of recommendation as to a particular course of action or as investment advice. It is not intended as an offer or solicitation for the purchase or sale of any financial instrument or as an official confirmation of any transaction. Opinions, estimates and assumptions expressed herein are made as of the date of this communication and are subject to change without notice. This communication has been prepared based upon information, including market prices, data and other information, believed to be reliable; however, Trade Nation does not warrant its completeness or accuracy. All market prices and market data contained in or attached to this communication are indicative and subject to change without notice.

Could the price reverse from here?The Cable (GBP?USD) is reacting off the pivot and could reverse to the 1st support which acts as a pullback support.
Pivot: 1.3710
1st Support: 1.3620
1st Resistance: 1.3799
Risk Warning:
Trading Forex and CFDs carries a high level of risk to your capital and you should only trade with money you can afford to lose. Trading Forex and CFDs may not be suitable for all investors, so please ensure that you fully understand the risks involved and seek independent advice if necessary.
Disclaimer:
The above opinions given constitute general market commentary, and do not constitute the opinion or advice of IC Markets or any form of personal or investment advice.
Any opinions, news, research, analyses, prices, other information, or links to third-party sites contained on this website are provided on an "as-is" basis, are intended only to be informative, is not an advice nor a recommendation, nor research, or a record of our trading prices, or an offer of, or solicitation for a transaction in any financial instrument and thus should not be treated as such. The information provided does not involve any specific investment objectives, financial situation and needs of any specific person who may receive it. Please be aware, that past performance is not a reliable indicator of future performance and/or results. Past Performance or Forward-looking scenarios based upon the reasonable beliefs of the third-party provider are not a guarantee of future performance. Actual results may differ materially from those anticipated in forward-looking or past performance statements. IC Markets makes no representation or warranty and assumes no liability as to the accuracy or completeness of the information provided, nor any loss arising from any investment based on a recommendation, forecast or any information supplied by any third-party.

Bullish bounce off overlap support?EUR/GBP is reacting off the support level which is an overlap support that lines up with the 23.6% Fibonacci retracement and could rise from this level to our take profit.
Entry: 0.8515
Why we like it:
There is an overlap support level that aligns with the 23.6% Fibonacci retracement.
Stop loss: 0.8482
Why we like it:
There is a pullback support level that is slightly below the 38.2% Fibonacci retracement.
Take profit: 0.8575
Why we like it:
There is a pullback resistance level.
Enjoying your TradingView experience? Review us!
Please be advised that the information presented on TradingView is provided to Vantage (‘Vantage Global Limited’, ‘we’) by a third-party provider (‘Everest Fortune Group’). Please be reminded that you are solely responsible for the trading decisions on your account. There is a very high degree of risk involved in trading. Any information and/or content is intended entirely for research, educational and informational purposes only and does not constitute investment or consultation advice or investment strategy. The information is not tailored to the investment needs of any specific person and therefore does not involve a consideration of any of the investment objectives, financial situation or needs of any viewer that may receive it. Kindly also note that past performance is not a reliable indicator of future results. Actual results may differ materially from those anticipated in forward-looking or past performance statements. We assume no liability as to the accuracy or completeness of any of the information and/or content provided herein and the Company cannot be held responsible for any omission, mistake nor for any loss or damage including without limitation to any loss of profit which may arise from reliance on any information supplied by Everest Fortune Group.

GBP/JPY Bullish Flag (25.06.2025) The GBP/JPY pair on the M30 timeframe presents a Potential Buying Opportunity due to a recent Formation of a Bullish Flag Pattern. This suggests a shift in momentum towards the upside and a higher likelihood of further advances in the coming hours.
Possible Long Trade:
Entry: Consider Entering A Long Position around Trendline Of The Pattern.
Target Levels:
1st Resistance – 198.46
2nd Resistance – 199.00
🎁 Please hit the like button and
🎁 Leave a comment to support for My Post !
Your likes and comments are incredibly motivating and will encourage me to share more analysis with you.
Best Regards, KABHI_TA_TRADING
Thank you.
Disclosure: I am part of Trade Nation's Influencer program and receive a monthly fee for using their TradingView charts in my analysis.

Bearish reversal off pullback resistance?The Cable (GBP/USD) is reacting off the pivot and could drop to the 1st support which is a pullback support.
Pivot: 1.3632
1st Support: 1.3533
1st Resistance: 1.2711
Risk Warning:
Trading Forex and CFDs carries a high level of risk to your capital and you should only trade with money you can afford to lose. Trading Forex and CFDs may not be suitable for all investors, so please ensure that you fully understand the risks involved and seek independent advice if necessary.
Disclaimer:
The above opinions given constitute general market commentary, and do not constitute the opinion or advice of IC Markets or any form of personal or investment advice.
Any opinions, news, research, analyses, prices, other information, or links to third-party sites contained on this website are provided on an "as-is" basis, are intended only to be informative, is not an advice nor a recommendation, nor research, or a record of our trading prices, or an offer of, or solicitation for a transaction in any financial instrument and thus should not be treated as such. The information provided does not involve any specific investment objectives, financial situation and needs of any specific person who may receive it. Please be aware, that past performance is not a reliable indicator of future performance and/or results. Past Performance or Forward-looking scenarios based upon the reasonable beliefs of the third-party provider are not a guarantee of future performance. Actual results may differ materially from those anticipated in forward-looking or past performance statements. IC Markets makes no representation or warranty and assumes no liability as to the accuracy or completeness of the information provided, nor any loss arising from any investment based on a recommendation, forecast or any information supplied by any third-party.

GBP/JPY Triangle Breakout (25.06.2025)The GBP/JPY Pair on the M30 timeframe presents a Potential Selling Opportunity due to a recent Formation of a Triangle Breakout Pattern. This suggests a shift in momentum towards the downside in the coming hours.
Possible Short Trade:
Entry: Consider Entering A Short Position around Trendline Of The Pattern.
Target Levels:
1st Support – 195.96
2nd Support – 195.37
🎁 Please hit the like button and
🎁 Leave a comment to support for My Post !
Your likes and comments are incredibly motivating and will encourage me to share more analysis with you.
Best Regards, KABHI_TA_TRADING
Thank you.
Disclosure: I am part of Trade Nation's Influencer program and receive a monthly fee for using their TradingView charts in my analysis.

GBP-CHF Support Ahead! Buy!
Hello,Traders!
GBP-CHF is going down now
And the pair will soon hit a
Horizontal support level below
Around 1.0933 from where
We will be expecting a
Local rebound and a move up
Buy!
Comment and subscribe to help us grow!
Check out other forecasts below too!
Disclosure: I am part of Trade Nation's Influencer program and receive a monthly fee for using their TradingView charts in my analysis.

GBPUSD Breakout and Potential RetraceHey Traders, in today's trading session we are monitoring GBPUSD for a buying opportunity around 1.35900 zone, GBPUSD was trading in a downtrend and successfully managed to break it out. Currently is in a correction phase in which it is approaching the retrace area at 1.35900 support and resistance area.
Trade safe, Joe.

GBPUSD - Over-Bought!Hello TradingView Family / Fellow Traders. This is Richard, also known as theSignalyst.
📈GBPUSD has been hovering within a big range marked in red and blue.
This week, GBPUSD is retesting the upper bound of the range acting as a resistance.
As long as the resistance holds, we will be looking for shorts on lower timeframes, targeting the lower bound of the range.
📚 Always follow your trading plan regarding entry, risk management, and trade management.
Good luck!
All Strategies Are Good; If Managed Properly!
~Rich
Disclosure: I am part of Trade Nation's Influencer program and receive a monthly fee for using their TradingView charts in my analysis.

EURGBP - Bullish No More!Hello TradingView Family / Fellow Traders. This is Richard, also known as theSignalyst.
📈 EURGBP has been overall bullish trading within the rising channel marked in blue. And it is currently retesting the upper bound of the channel.
Moreover, the orange zone is a strong weekly resistance.
🏹 Thus, the highlighted red circle is a strong area to look for sell setups as it is the intersection of the upper blue trendline and resistance.
📚 As per my trading style:
As #EURGBP is around the red circle zone, I will be looking for bearish reversal setups (like a double top pattern, trendline break , and so on...)
📚 Always follow your trading plan regarding entry, risk management, and trade management.
Good luck!
All Strategies Are Good; If Managed Properly!
~Rich
Disclosure: I am part of Trade Nation's Influencer program and receive a monthly fee for using their TradingView charts in my analysis.

GBPCHF Analysis As our followers know (see the pinned idea below), we previously entered a short from this level and took profit successfully 💰
Now that level has been broken and we’re patiently waiting for a pullback to enter a buy position 📈
Let’s wait for confirmation before jumping in! ⏳
For detailed entry points, trade management, and high-probability setups, follow the channel:
ForexCSP

GBPUSD SHORT FORECAST Q2 W26 D24 Y25GBPUSD SHORT FORECAST Q2 W26 D24 Y25
Professional Risk Managers👋
Welcome back to another FRGNT chart update📈
Diving into some Forex setups using predominantly higher time frame order blocks alongside confirmation breaks of structure.
Let’s see what price action is telling us today!
💡Here are some trade confluences📝
✅Daily order block
✅1H Order block
✅Intraday breaks of structure
✅4H Order block
🔑 Remember, to participate in trading comes always with a degree of risk, therefore as professional risk managers it remains vital that we stick to our risk management plan as well as our trading strategies.
📈The rest, we leave to the balance of probabilities.
💡Fail to plan. Plan to fail.
🏆It has always been that simple.
❤️Good luck with your trading journey, I shall see you at the very top.
🎯Trade consistent, FRGNT X

Bullish rise off pullback support?The Cable (GBP/USD) is falling towards the pivot which is a pullback support and could bounce to the 1st resistance.
Pivot: 1.3503
1st Support: 1.3455
1st Resistance: 1.3616
Risk Warning:
Trading Forex and CFDs carries a high level of risk to your capital and you should only trade with money you can afford to lose. Trading Forex and CFDs may not be suitable for all investors, so please ensure that you fully understand the risks involved and seek independent advice if necessary.
Disclaimer:
The above opinions given constitute general market commentary, and do not constitute the opinion or advice of IC Markets or any form of personal or investment advice.
Any opinions, news, research, analyses, prices, other information, or links to third-party sites contained on this website are provided on an "as-is" basis, are intended only to be informative, is not an advice nor a recommendation, nor research, or a record of our trading prices, or an offer of, or solicitation for a transaction in any financial instrument and thus should not be treated as such. The information provided does not involve any specific investment objectives, financial situation and needs of any specific person who may receive it. Please be aware, that past performance is not a reliable indicator of future performance and/or results. Past Performance or Forward-looking scenarios based upon the reasonable beliefs of the third-party provider are not a guarantee of future performance. Actual results may differ materially from those anticipated in forward-looking or past performance statements. IC Markets makes no representation or warranty and assumes no liability as to the accuracy or completeness of the information provided, nor any loss arising from any investment based on a recommendation, forecast or any information supplied by any third-party.

Major resistance ahead?GBP/USD is rising towards the resistance level which is an overlap resistance and could reverse from this level to our take profit.
Entry: 1.3535
Why we like it:
There is an overlap resistance level.
Stop loss: 1.3449
Why we like it:
There is a pullback resistance level that lines up with the 161.8% Fibonacci extension.
Take profit: 1.3449
Why we like it:
There is a pullback support level.
Enjoying your TradingView experience? Review us!
Please be advised that the information presented on TradingView is provided to Vantage (‘Vantage Global Limited’, ‘we’) by a third-party provider (‘Everest Fortune Group’). Please be reminded that you are solely responsible for the trading decisions on your account. There is a very high degree of risk involved in trading. Any information and/or content is intended entirely for research, educational and informational purposes only and does not constitute investment or consultation advice or investment strategy. The information is not tailored to the investment needs of any specific person and therefore does not involve a consideration of any of the investment objectives, financial situation or needs of any viewer that may receive it. Kindly also note that past performance is not a reliable indicator of future results. Actual results may differ materially from those anticipated in forward-looking or past performance statements. We assume no liability as to the accuracy or completeness of any of the information and/or content provided herein and the Company cannot be held responsible for any omission, mistake nor for any loss or damage including without limitation to any loss of profit which may arise from reliance on any information supplied by Everest Fortune Group.

GBPCAD : SELL SETUP FORMED IN 4RSell @ 1.8460 or below
Target : 1.8225, 1.8000
Stoploss : 1.8560
Sell breakout and pullback done. Short entered at 1.8460

GBP/CHF BEARS ARE STRONG HERE|SHORT
Hello, Friends!
GBP/CHF pair is trading in a local uptrend which we know by looking at the previous 1W candle which is green. On the 3H timeframe the pair is going up too. The pair is overbought because the price is close to the upper band of the BB indicator. So we are looking to sell the pair with the upper BB line acting as resistance. The next target is 1.094 area.
Disclosure: I am part of Trade Nation's Influencer program and receive a monthly fee for using their TradingView charts in my analysis.
✅LIKE AND COMMENT MY IDEAS✅

Bullish bounce?The Cable (GBP/USD) is falling towards the pivot and could bounce to the 1st resistance.
Pivot: 1.3328
1st Support: 1.3133
1st Resistance: 1.3636
Risk Warning:
Trading Forex and CFDs carries a high level of risk to your capital and you should only trade with money you can afford to lose. Trading Forex and CFDs may not be suitable for all investors, so please ensure that you fully understand the risks involved and seek independent advice if necessary.
Disclaimer:
The above opinions given constitute general market commentary, and do not constitute the opinion or advice of IC Markets or any form of personal or investment advice.
Any opinions, news, research, analyses, prices, other information, or links to third-party sites contained on this website are provided on an "as-is" basis, are intended only to be informative, is not an advice nor a recommendation, nor research, or a record of our trading prices, or an offer of, or solicitation for a transaction in any financial instrument and thus should not be treated as such. The information provided does not involve any specific investment objectives, financial situation and needs of any specific person who may receive it. Please be aware, that past performance is not a reliable indicator of future performance and/or results. Past Performance or Forward-looking scenarios based upon the reasonable beliefs of the third-party provider are not a guarantee of future performance. Actual results may differ materially from those anticipated in forward-looking or past performance statements. IC Markets makes no representation or warranty and assumes no liability as to the accuracy or completeness of the information provided, nor any loss arising from any investment based on a recommendation, forecast or any information supplied by any third-party.

GBPCHF Buy Trade IdeaHello Traders
In This Chart GBPCHF HOURLY Forex Forecast By FOREX PLANET
today GBPCHF analysis 👆
🟢This Chart includes_ (GBPCHF market update)
🟢What is The Next Opportunity on GBPCHF Market
🟢how to Enter to the Valid Entry With Assurance Profit
This CHART is For Trader's that Want to Improve Their Technical Analysis Skills and Their Trading By Understanding How To Analyze The Market Using Multiple Timeframes and Understanding The Bigger Picture on the Charts

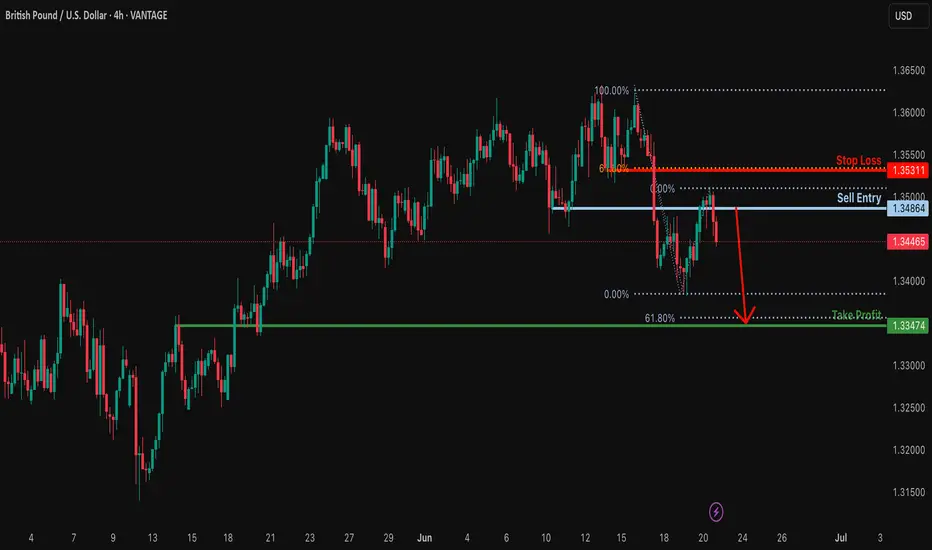
Bearish drop off pullback resistance?GBP/USD has rejected off the resistance level which is a pullback resistance and could drop from this level to our take profit.
Entry: 1.3486
Why we like it:
There is a pullback resistance level.
Stop loss: 1.3531
Why we like it:
There is a pullback resistance level that aligns with the 61.8% Fibonacci retracement.
Take profit: 1.3347
Why we like it:
There is a pullback support level that lines up with the 61.8% Fibonacci projection.
Enjoying your TradingView experience? Review us!
Please be advised that the information presented on TradingView is provided to Vantage (‘Vantage Global Limited’, ‘we’) by a third-party provider (‘Everest Fortune Group’). Please be reminded that you are solely responsible for the trading decisions on your account. There is a very high degree of risk involved in trading. Any information and/or content is intended entirely for research, educational and informational purposes only and does not constitute investment or consultation advice or investment strategy. The information is not tailored to the investment needs of any specific person and therefore does not involve a consideration of any of the investment objectives, financial situation or needs of any viewer that may receive it. Kindly also note that past performance is not a reliable indicator of future results. Actual results may differ materially from those anticipated in forward-looking or past performance statements. We assume no liability as to the accuracy or completeness of any of the information and/or content provided herein and the Company cannot be held responsible for any omission, mistake nor for any loss or damage including without limitation to any loss of profit which may arise from reliance on any information supplied by Everest Fortune Group.
GBPJPY hinting of a weighty 3k pip rise from 195.0. /\GBPJPY has always been resilient for the past 5 years as far its upward trajectory goes -- registering only 3 technical corrective phase since March of 2020 -- then proceeding for further price growth every after corrective seasons.
After touching its parabolic high of 208, pair hibernated healthily back to demand zone to 0.5 fib levels.
Now, the pair is on its 3rd corrective phase since 2020 which has started last July 2024.
Based on our diagram above, this month June 2025 it finally registered its first bear clearance in more than 2 years - conveying of a massive shift in trend. last time this signal surfaced was on April 2023, which has produced a 3000 pips rise thereafter.
Expect some significant ascend series from hereon pricewise after this major shift.
The north journey has started during its low retest of 0.5 FIB levels at 180.0 price zone -- now, already up 1600 pips from that price tap.
This 0.5 fib retest has been historically been a strong support for GBPJPY. This is where most buyers converge based on long term metrics.
More price growth is expected in the next few weeks with weighty targets up there (about 3k pips). Its not overnight but you know the directional context.
Spotted at 195.0
Mid Target previous peak at 208.0
Long term target: 225.

GBPCHF Will Explode! BUY!
My dear subscribers,
GBPCHF looks like it will make a good move, and here are the details:
The market is trading on 1.0989 pivot level.
Bias - Bullish
My Stop Loss - 1.0948
Technical Indicators: Both Super Trend & Pivot HL indicate a highly probable Bullish continuation.
Target - 1.1062
About Used Indicators:
The average true range (ATR) plays an important role in 'Supertrend' as the indicator uses ATR to calculate its value. The ATR indicator signals the degree of price volatility.
Disclosure: I am part of Trade Nation's Influencer program and receive a monthly fee for using their TradingView charts in my analysis.
———————————
WISH YOU ALL LUCK
