GBPUSD hit its 1D MA50. Perfect buy signal.The GBPUSD pair has been trading within a Channel Up pattern since the January 13 2025 market bottom. Yesterday it hit its 1D MA50 (blue trend-line) for the first time since April 08.
This is the most efficient buy entry as the 1D MA50 has been supporting since the February 13 break-out. Even the 1D CCI turned oversold and rebounded, which is consistent with all bottom buys inside the Channel Up.
The Bullish Leg can extend to as high as +5.05% but due to the presence of the Inner Higher Highs trend-line, we first target 1.3850 (+3.43% rise).
-------------------------------------------------------------------------------
** Please LIKE 👍, FOLLOW ✅, SHARE 🙌 and COMMENT ✍ if you enjoy this idea! Also share your ideas and charts in the comments section below! This is best way to keep it relevant, support us, keep the content here free and allow the idea to reach as many people as possible. **
-------------------------------------------------------------------------------
💸💸💸💸💸💸
👇 👇 👇 👇 👇 👇
GBP (British Pound)

GBPJPY LONG & SHORT FORECAST Q2 W25 D20 Y25GBPJPY LONG & SHORT FORECAST Q2 W25 D20 Y25
Professional Risk Managers👋
Welcome back to another FRGNT chart update📈
Diving into some Forex setups using predominantly higher time frame order blocks alongside confirmation breaks of structure.
Let’s see what price action is telling us today!
💡Here are some trade confluences📝
✅Daily order block
✅15' order block
✅Intraday breaks of structure
✅4H Order block
🔑 Remember, to participate in trading comes always with a degree of risk, therefore as professional risk managers it remains vital that we stick to our risk management plan as well as our trading strategies.
📈The rest, we leave to the balance of probabilities.
💡Fail to plan. Plan to fail.
🏆It has always been that simple.
❤️Good luck with your trading journey, I shall see you at the very top.
🎯Trade consistent, FRGNT X

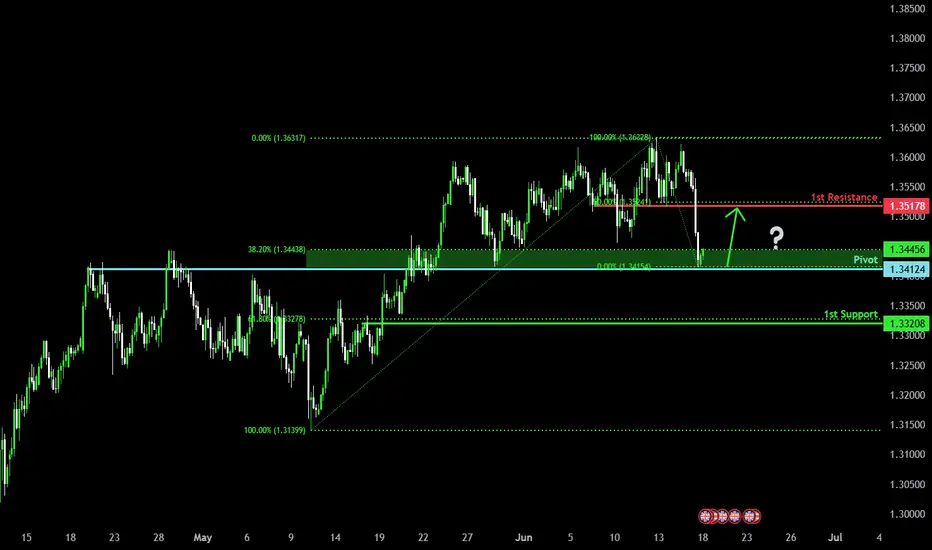
Potential bullish rise?The Cable (GBP/USD) has bounced off the pivot which is an overlap support and could rise to the 1st resistance.
Pivot: 1.3403
1st Support: 1.3319
1st Resistance: 1.3517
Risk Warning:
Trading Forex and CFDs carries a high level of risk to your capital and you should only trade with money you can afford to lose. Trading Forex and CFDs may not be suitable for all investors, so please ensure that you fully understand the risks involved and seek independent advice if necessary.
Disclaimer:
The above opinions given constitute general market commentary, and do not constitute the opinion or advice of IC Markets or any form of personal or investment advice.
Any opinions, news, research, analyses, prices, other information, or links to third-party sites contained on this website are provided on an "as-is" basis, are intended only to be informative, is not an advice nor a recommendation, nor research, or a record of our trading prices, or an offer of, or solicitation for a transaction in any financial instrument and thus should not be treated as such. The information provided does not involve any specific investment objectives, financial situation and needs of any specific person who may receive it. Please be aware, that past performance is not a reliable indicator of future performance and/or results. Past Performance or Forward-looking scenarios based upon the reasonable beliefs of the third-party provider are not a guarantee of future performance. Actual results may differ materially from those anticipated in forward-looking or past performance statements. IC Markets makes no representation or warranty and assumes no liability as to the accuracy or completeness of the information provided, nor any loss arising from any investment based on a recommendation, forecast or any information supplied by any third-party.

Potential bullish rise for the Cable?The price has bounced off the support level which is an overlap support that aligns with the 50% Fibonacci retracement and could bounce from this level to our take profit.
Entry: 1.3399
Why we like it:
There is an overlap support level that aligns with the 50% Fibonacci retracement.
Stop loss: 1.3337
Why we like it:
There is a pullback support level that lines up with the 61.8% Fibonacci retracement.
Take profit: 1.3505
Why we like it:
There is a pullback resistance level that aligns with the 50% Fibonacci retracement.
Enjoying your TradingView experience? Review us!
Please be advised that the information presented on TradingView is provided to Vantage (‘Vantage Global Limited’, ‘we’) by a third-party provider (‘Everest Fortune Group’). Please be reminded that you are solely responsible for the trading decisions on your account. There is a very high degree of risk involved in trading. Any information and/or content is intended entirely for research, educational and informational purposes only and does not constitute investment or consultation advice or investment strategy. The information is not tailored to the investment needs of any specific person and therefore does not involve a consideration of any of the investment objectives, financial situation or needs of any viewer that may receive it. Kindly also note that past performance is not a reliable indicator of future results. Actual results may differ materially from those anticipated in forward-looking or past performance statements. We assume no liability as to the accuracy or completeness of any of the information and/or content provided herein and the Company cannot be held responsible for any omission, mistake nor for any loss or damage including without limitation to any loss of profit which may arise from reliance on any information supplied by Everest Fortune Group.

GBPJPY Potential DownsidesHey Traders, in tomorrow's trading session we are monitoring GBPJPY for a selling opportunity around 195.600 zone, GBPJPY is trading in a downtrend and currently is in a correction phase in which in which it is approaching the trend at 195.600 support and resistance area.
Trade safe, Joe.

GBPCHF continuation of selling pressure below 1.1070The GBPCHF currency pair continues to display a bearish outlook, in line with the prevailing downward trend. Recent price action suggests a corrective pullback, potentially setting up for another move lower if resistance holds.
Key Level: 1.1070
This zone, previously a consolidation area, now acts as a significant resistance level.
Bearish Scenario (rejection at 1.1070):
A failed test and rejection at 1.1070 would likely resume the bearish momentum.
Downside targets include:
1.0910 – Initial support
1.0860 – Intermediate support
1.0810 – Longer-term support level
Bullish Scenario (breakout above 1.1070):
A confirmed breakout and daily close above 1.1070 would invalidate the bearish setup.
In that case, potential upside resistance levels are:
1.1125 – First resistance
1.1240 – Further upside target
Conclusion
GBPCHF remains under bearish pressure, with the 1.1070 level acting as a key inflection point. As long as price remains below this level, the bias favors further downside. Traders should watch for price confirmation around that level to assess the next move.
This communication is for informational purposes only and should not be viewed as any form of recommendation as to a particular course of action or as investment advice. It is not intended as an offer or solicitation for the purchase or sale of any financial instrument or as an official confirmation of any transaction. Opinions, estimates and assumptions expressed herein are made as of the date of this communication and are subject to change without notice. This communication has been prepared based upon information, including market prices, data and other information, believed to be reliable; however, Trade Nation does not warrant its completeness or accuracy. All market prices and market data contained in or attached to this communication are indicative and subject to change without notice.

GBP/USD - For FOMC & Fed Interest RateThe GBP/USD pair on the M30 timeframe presents a Potential Buying Opportunity due to a recent Formation of a Channel Pattern. This suggests a shift in momentum towards the upside and a higher likelihood of further advances in the coming hours.
Possible Long Trade:
Entry: Consider Entering A Long Position around Trendline Of The Pattern.
Target Levels:
1st Resistance – 1.3567
2nd Resistance – 1.3682
🎁 Please hit the like button and
🎁 Leave a comment to support for My Post !
Your likes and comments are incredibly motivating and will encourage me to share more analysis with you.
Best Regards, KABHI_TA_TRADING
Thank you.
Disclosure: I am part of Trade Nation's Influencer program and receive a monthly fee for using their TradingView charts in my analysis.

GBPUSD - One More Leg for Bears to Take Over!Hello TradingView Family / Fellow Traders. This is Richard, also known as theSignalyst.
📈GBPUSD has been overall bullish trading within the rising broadening wedge pattern marked in red.
However, it is currently approaching the upper bound of the wedge acting as an over-bought zone.
And the $1.365 - $1.375 is a strong resistance zone.
🏹 Thus, the highlighted red circle is a strong area to look for sell setups as it is the intersection of resistance and upper red trendline acting as a non-horizontal resistance.
📚 As per my trading style:
As #GBPUSD approaches the red circle zone, I will be looking for bearish reversal setups (like a double top pattern, trendline break , and so on...)
📚 Always follow your trading plan regarding entry, risk management, and trade management.
Good luck!
All Strategies Are Good; If Managed Properly!
~Rich
Disclosure: I am part of Trade Nation's Influencer program and receive a monthly fee for using their TradingView charts in my analysis.

GBPUSD SHORT FORECAST Q2 W25 D18 Y25GBPUSD SHORT FORECAST Q2 W25 D18 Y25
Professional Risk Managers👋
Welcome back to another FRGNT chart update📈
Diving into some Forex setups using predominantly higher time frame order blocks alongside confirmation breaks of structure.
Let’s see what price action is telling us today!
💡Here are some trade confluences📝
✅Weekly order block
✅15' order block
✅Intraday 15' break of structure
✅Tokyo ranges to be filled
🔑 Remember, to participate in trading comes always with a degree of risk, therefore as professional risk managers it remains vital that we stick to our risk management plan as well as our trading strategies.
📈The rest, we leave to the balance of probabilities.
💡Fail to plan. Plan to fail.
🏆It has always been that simple.
❤️Good luck with your trading journey, I shall see you at the very top.
🎯Trade consistent, FRGNT X

GBPUSD - Analysis (18th June 2025)Here is an analysis on Cable, and basically showcasing how I would form a bias, a narrative, an potential trade setups.
I hope it is insightful for you.
- R2F Trading

Bullish reversal off overlap support?The Cable (GBP/USD) has bounced off the pivot and could rise to the 50% Fibonacci resistance.
Pivot: 1.3412
1st Support: 1.3320
1st Resistance: 1.3517
Risk Warning:
Trading Forex and CFDs carries a high level of risk to your capital and you should only trade with money you can afford to lose. Trading Forex and CFDs may not be suitable for all investors, so please ensure that you fully understand the risks involved and seek independent advice if necessary.
Disclaimer:
The above opinions given constitute general market commentary, and do not constitute the opinion or advice of IC Markets or any form of personal or investment advice.
Any opinions, news, research, analyses, prices, other information, or links to third-party sites contained on this website are provided on an "as-is" basis, are intended only to be informative, is not an advice nor a recommendation, nor research, or a record of our trading prices, or an offer of, or solicitation for a transaction in any financial instrument and thus should not be treated as such. The information provided does not involve any specific investment objectives, financial situation and needs of any specific person who may receive it. Please be aware, that past performance is not a reliable indicator of future performance and/or results. Past Performance or Forward-looking scenarios based upon the reasonable beliefs of the third-party provider are not a guarantee of future performance. Actual results may differ materially from those anticipated in forward-looking or past performance statements. IC Markets makes no representation or warranty and assumes no liability as to the accuracy or completeness of the information provided, nor any loss arising from any investment based on a recommendation, forecast or any information supplied by any third-party.
GBP-CHF Support Ahead! Buy!
Hello,Traders!
GBP-CHF keeps falling but
A strong horizontal support
Level is ahead at 1.0921
From where we will be
Expecting a rebound
And a local bullish move up
Buy!
Comment and subscribe to help us grow!
Check out other forecasts below too!
Disclosure: I am part of Trade Nation's Influencer program and receive a monthly fee for using their TradingView charts in my analysis.

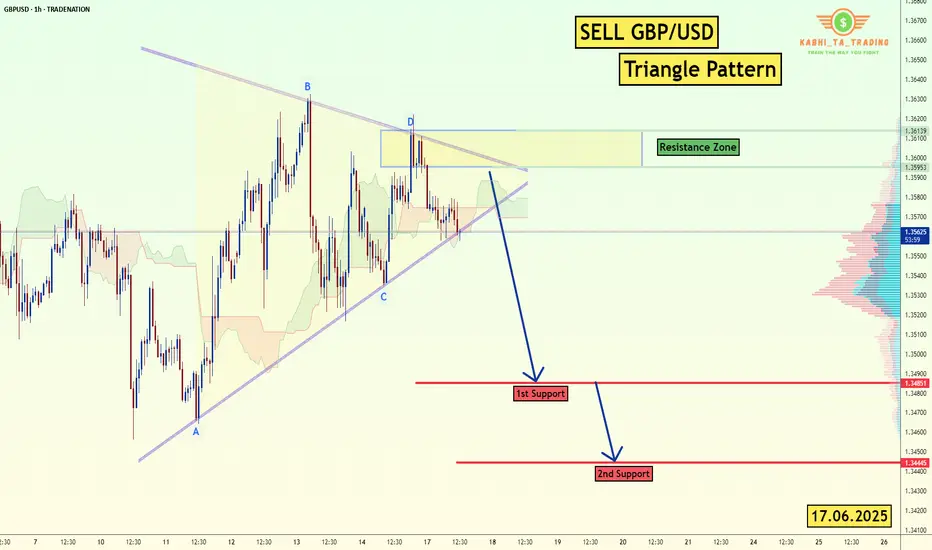
GBP/USD - H1-Triangle Breakout (17.06.2025)The GBP/USD Pair on the H1 timeframe presents a Potential Selling Opportunity due to a recent Formation of a Triangle Breakout Pattern. This suggests a shift in momentum towards the downside in the coming hours.
Possible Short Trade:
Entry: Consider Entering A Short Position around Trendline Of The Pattern.
Target Levels:
1st Support – 1.3485
2nd Support – 1.3444
🎁 Please hit the like button and
🎁 Leave a comment to support for My Post !
Your likes and comments are incredibly motivating and will encourage me to share more analysis with you.
Best Regards, KABHI_TA_TRADING
Thank you.
Disclosure: I am part of Trade Nation's Influencer program and receive a monthly fee for using their TradingView charts in my analysis.
Bullish bounce off overlap support?GBP/USD is falling towards the support level which is an overlap support that aligns with the 38.2% Fibonacci retracement and could bounce from this level to our take profit.
Entry: 1.3443
Why we like it:
There is an overlap support level.
Stop loss: 1.3359
Why we like it:
There is a pullback support that is slightly below the 50% Fibonacci retracement.
Take profit: 1.3530
Why we like it:
There is a pullback resistance level.
njoying your TradingView experience? Review us!
Please be advised that the information presented on TradingView is provided to Vantage (‘Vantage Global Limited’, ‘we’) by a third-party provider (‘Everest Fortune Group’). Please be reminded that you are solely responsible for the trading decisions on your account. There is a very high degree of risk involved in trading. Any information and/or content is intended entirely for research, educational and informational purposes only and does not constitute investment or consultation advice or investment strategy. The information is not tailored to the investment needs of any specific person and therefore does not involve a consideration of any of the investment objectives, financial situation or needs of any viewer that may receive it. Kindly also note that past performance is not a reliable indicator of future results. Actual results may differ materially from those anticipated in forward-looking or past performance statements. We assume no liability as to the accuracy or completeness of any of the information and/or content provided herein and the Company cannot be held responsible for any omission, mistake nor for any loss or damage including without limitation to any loss of profit which may arise from reliance on any information supplied by Everest Fortune Group.

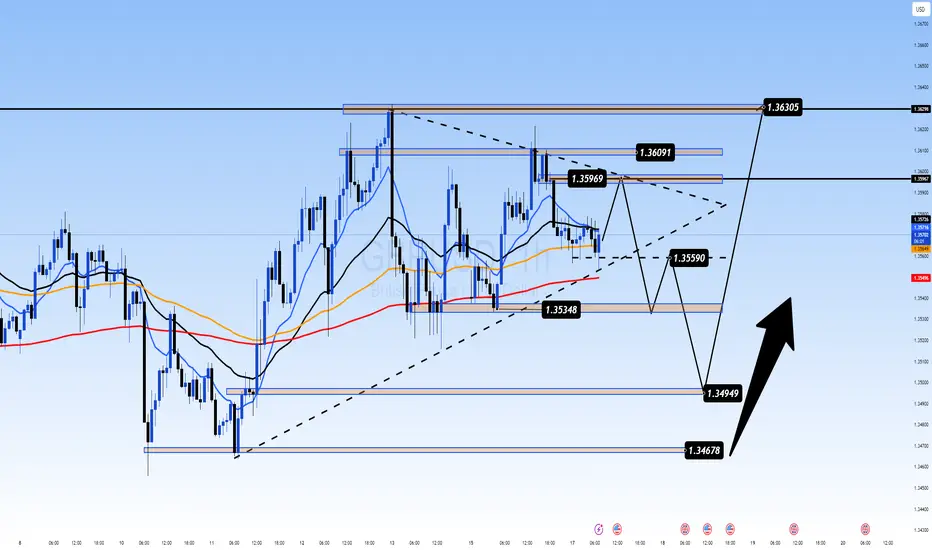
The Calm Before the Storm: All Eyes on UK CPI & Central BanksGBPUSD 17/06 – The Calm Before the Storm: All Eyes on UK CPI & Central Banks
The GBPUSD pair is coiling in a tight range near the mid-1.3500s as traders brace for two high-impact events: UK CPI data on Wednesday and interest rate decisions from both the Fed and BoE this week. Price remains supported above the 200 EMA and is compressing within a symmetrical triangle – typically a precursor to a major breakout.
📊 Macro & Fundamental Outlook
🔹 Federal Reserve (FOMC): Expected to hold rates steady, but growing anticipation of a dovish tilt toward September is weighing slightly on the USD.
🔹 Bank of England (BoE): Markets are pricing in deeper rate cuts following recent UK GDP weakness, pressuring the GBP in the short term.
🔹 Geopolitical Risks: Rising Middle East tensions are fuelling demand for USD as a safe haven, reinforcing its strength ahead of data events.
📝 Bottom Line: The CPI release could be the first trigger to shift GBPUSD’s current consolidation. A hot inflation print might push GBP higher; a miss could fuel further downside.
🔧 Technical Analysis (H1 Chart)
Price is ranging between 1.3535 (support) and 1.3609 (resistance)
EMAs 13/34 crossing below EMA 89 → signal of potential bearish continuation
Uptrend line from 1.3467 is still intact and acting as dynamic support
Break below 1.3559 may lead to a move toward 1.3495 and 1.3467
A confirmed breakout above 1.3609 opens the door to 1.3630+
🎯 Trade Scenarios
Scenario 1 – Buy from Trendline Support
Buy Zone: 1.3495 – 1.3467
Stop Loss: 1.3440
Targets: 1.3535 → 1.3559 → 1.3596 → 1.3630
🟢 Best setup if price prints a bullish engulfing or hammer candle on key support + UK CPI surprise.
Scenario 2 – Sell on Resistance Rejection
Sell Zone: 1.3609 – 1.3630
Stop Loss: 1.3660
Targets: 1.3590 → 1.3559 → 1.3535 → 1.3495
🔴 Only valid with strong rejection signals + softer UK data or hawkish Fed tone.
💡 Market Sentiment
Retail traders are trapped in a waiting zone – expecting a breakout
Institutions may push price into one direction pre-data to collect liquidity
Risk appetite is fragile, and traders are cautious ahead of back-to-back central bank announcements
📌 Final Thoughts
GBPUSD is preparing for volatility. Instead of chasing moves, let the market come to your key zones and react with discipline. The 1.3467–1.3495 support area could be crucial for the next directional move.
Stay patient. Wait for confirmation. Respect your risk.
Bearish drop?The Cable (GBPUSD) is rising towards the pivot, which is a pullback resistance and could reverse to the 1st support.
Pivot: 1.3592
1st Support: 1.3536
1st Resistance: 1.3629
Risk Warning:
Trading Forex and CFDs carries a high level of risk to your capital and you should only trade with money you can afford to lose. Trading Forex and CFDs may not be suitable for all investors, so please ensure that you fully understand the risks involved and seek independent advice if necessary.
Disclaimer:
The above opinions given constitute general market commentary, and do not constitute the opinion or advice of IC Markets or any form of personal or investment advice.
Any opinions, news, research, analyses, prices, other information, or links to third-party sites contained on this website are provided on an "as-is" basis, are intended only to be informative, is not an advice nor a recommendation, nor research, or a record of our trading prices, or an offer of, or solicitation for a transaction in any financial instrument and thus should not be treated as such. The information provided does not involve any specific investment objectives, financial situation and needs of any specific person who may receive it. Please be aware, that past performance is not a reliable indicator of future performance and/or results. Past Performance or Forward-looking scenarios based upon the reasonable beliefs of the third-party provider are not a guarantee of future performance. Actual results may differ materially from those anticipated in forward-looking or past performance statements. IC Markets makes no representation or warranty and assumes no liability as to the accuracy or completeness of the information provided, nor any loss arising from any investment based on a recommendation, forecast or any information supplied by any third-party.

Bearish drop?GBP/USD has reacted off the resistance level which is a pullback resistance and could drop from this level to our take profit.
Entry: 1.3610
Why we like it:
There is a resistance level.
Stop loss: 1.3644
Why we like it:
There is a resistance level at the 161.8% Fibonacci extension.
Take profit: 1.3560
Why we like it:
There is a pullback support level that is slightly below the 61.8% Fibonacci retracement.
Enjoying your TradingView experience? Review us!
Please be advised that the information presented on TradingView is provided to Vantage (‘Vantage Global Limited’, ‘we’) by a third-party provider (‘Everest Fortune Group’). Please be reminded that you are solely responsible for the trading decisions on your account. There is a very high degree of risk involved in trading. Any information and/or content is intended entirely for research, educational and informational purposes only and does not constitute investment or consultation advice or investment strategy. The information is not tailored to the investment needs of any specific person and therefore does not involve a consideration of any of the investment objectives, financial situation or needs of any viewer that may receive it. Kindly also note that past performance is not a reliable indicator of future results. Actual results may differ materially from those anticipated in forward-looking or past performance statements. We assume no liability as to the accuracy or completeness of any of the information and/or content provided herein and the Company cannot be held responsible for any omission, mistake nor for any loss or damage including without limitation to any loss of profit which may arise from reliance on any information supplied by Everest Fortune Group.

GBPUSD SHORT FORECAST Q2 W25 D16 Y25GBPUSD SHORT FORECAST Q2 W25 D16 Y25
Professional Risk Managers👋
Welcome back to another FRGNT chart update📈
Diving into some Forex setups using predominantly higher time frame order blocks alongside confirmation breaks of structure.
Let’s see what price action is telling us today!
💡Here are some trade confluences📝
✅Weekly order block
✅15' order block
✅Intraday 15' break of structure
✅Tokyo ranges to be filled
🔑 Remember, to participate in trading comes always with a degree of risk, therefore as professional risk managers it remains vital that we stick to our risk management plan as well as our trading strategies.
📈The rest, we leave to the balance of probabilities.
💡Fail to plan. Plan to fail.
🏆It has always been that simple.
❤️Good luck with your trading journey, I shall see you at the very top.
🎯Trade consistent, FRGNT X

Bullish bounce for the Cable?The price is falling towards the pivot which is a pullback support and could bounce to the 1st resistance.
Pivot: 1.3409
1st Support: 1.3108
1st Resistance: 1.3768
Risk Warning:
Trading Forex and CFDs carries a high level of risk to your capital and you should only trade with money you can afford to lose. Trading Forex and CFDs may not be suitable for all investors, so please ensure that you fully understand the risks involved and seek independent advice if necessary.
Disclaimer:
The above opinions given constitute general market commentary, and do not constitute the opinion or advice of IC Markets or any form of personal or investment advice.
Any opinions, news, research, analyses, prices, other information, or links to third-party sites contained on this website are provided on an "as-is" basis, are intended only to be informative, is not an advice nor a recommendation, nor research, or a record of our trading prices, or an offer of, or solicitation for a transaction in any financial instrument and thus should not be treated as such. The information provided does not involve any specific investment objectives, financial situation and needs of any specific person who may receive it. Please be aware, that past performance is not a reliable indicator of future performance and/or results. Past Performance or Forward-looking scenarios based upon the reasonable beliefs of the third-party provider are not a guarantee of future performance. Actual results may differ materially from those anticipated in forward-looking or past performance statements. IC Markets makes no representation or warranty and assumes no liability as to the accuracy or completeness of the information provided, nor any loss arising from any investment based on a recommendation, forecast or any information supplied by any third-party.

GBPCHF Breaks Rising Wedge – Reversal Targets 1.0940 and 1.0815GBPCHF has broken down from a rising wedge formation on the 4H chart, signaling a shift from bullish momentum to bearish control. The pattern break comes near the 50% retracement level, with price now trading below ascending trendline support. With fundamental headwinds weighing on the British pound and safe-haven demand supporting the Swiss franc, the setup favors a short bias targeting the 1.0940 and 1.0815 zones.
🔍 Technical Analysis
Pattern: Rising wedge → broken to the downside
Breakout Confirmation: Price has closed below the wedge support (trendline)
Key Support Levels:
1.0940 → 38.2% fib + previous structure support
1.0815 → 23.6% fib retracement + horizontal support zone
1.0608 → Full wedge base (longer-term target)
Resistance / Invalidation:
1.1150 – a close back above this level invalidates the breakdown
Candle Behavior:
Bearish structure forming with lower highs
Clean engulfing candle closed below wedge
📉 Bias: Bearish (confirmed technical reversal)
🌍 Fundamental Context
🇬🇧 British Pound (GBP)
UK CPI expected to rise (3.3% forecast), which may limit BoE cuts, but not bullish enough to support GBP
Political uncertainty resurfaces (Labour slipping in polls)
BoE speakers are split; no clear support from policy
🇨🇭 Swiss Franc (CHF)
Safe-haven flows rising on:
Global growth slowdown
Tensions between U.S.–Iran
Downgrade of U.S. debt → risk aversion favors CHF
SNB remains cautious, but CHF gains defensive strength in risk-off conditions
🎯 Trade Setup
Bias: Sell
Entry Zone: 1.1080–1.1100 (breakout confirmation)
Targets:
TP1: 1.0940
TP2: 1.0815
TP3: 1.0608 (extension target)
Stop Loss: Above 1.1150
⚠️ Risk Factors
CPI surprise tomorrow could cause GBP spikes — be cautious around the release
If equities rally hard or CHF weakens globally, price could retest the wedge structure before falling
BoE hawkish surprise could challenge short-term bearish bias
🧭 Conclusion
GBP/CHF has broken out of a rising wedge — a classic bearish reversal signal. The technical break aligns with macro weakness in GBP and CHF strength in a risk-off environment. Short trades remain valid below 1.1150, targeting a drop to 1.0940 and 1.0815 in the coming sessions.

GBP_CHF RESISTANCE AHEAD|SHORT|
✅GBP_CHF is going up now
But a strong resistance level is ahead at 1.1070
Thus I am expecting a pullback
And a move down towards the target of 1.1013
SHORT🔥
✅Like and subscribe to never miss a new idea!✅
Disclosure: I am part of Trade Nation's Influencer program and receive a monthly fee for using their TradingView charts in my analysis.

GBPCHF: Long Trade Explained
GBPCHF
- Classic bullish formation
- Our team expects pullback
SUGGESTED TRADE:
Swing Trade
Long GBPCHF
Entry - 1.1005
Sl - 1.0971
Tp - 1.1064
Our Risk - 1%
Start protection of your profits from lower levels
Disclosure: I am part of Trade Nation's Influencer program and receive a monthly fee for using their TradingView charts in my analysis.
❤️ Please, support our work with like & comment! ❤️

GBPUSD – Sterling Slips Amid Geopolitical Risk |GBPUSD – Sterling Slips Amid Geopolitical Risk | Will Support Hold for a Bounce?
🌍 Macro & Geopolitical Overview
The British Pound (GBP) is under pressure as risk sentiment deteriorates following a sharp escalation between Israel and Iran.
Israel launched a major military campaign, striking dozens of nuclear and military facilities in northeastern Tehran.
PM Netanyahu announced the start of "Operation Rising Lion", aimed at eliminating the Iranian nuclear threat.
US President Donald Trump voiced support, stating that Iran “must never have a nuclear bomb.”
Investors reacted by fleeing to safe-haven assets, pushing the US Dollar (DXY) from 97.60 to nearly 98.30.
Meanwhile, next week’s Bank of England (BoE) and Federal Reserve meetings are in focus. Both are expected to hold rates steady, but weak UK economic data may pressure the BoE to adopt a more cautious or dovish tone.
📉 Technical Analysis – H1 Chart
🔸 Trend Structure
GBPUSD broke down from its recent high at 1.36288 and is now approaching key support between 1.35350 and 1.34957.
As long as 1.3495 holds, the move appears to be a technical correction, not a reversal.
🔸 Fibonacci & Moving Averages
Current price sits near Fibonacci 0.236 retracement of the recent swing.
Price is trading below the EMA 13 & 34, but EMA 200 near 1.353x still acts as potential support.
🔸 Resistance to Watch
The next upside target sits at 1.3588, followed by the previous high at 1.3628.
🧠 Market Sentiment
Risk aversion is dominating due to geopolitical headlines.
GBP is vulnerable as a risk-sensitive currency.
However, if tensions ease and central bank decisions next week come in line with expectations, GBP could rebound from its currently discounted levels.
🎯 Trade Setup Suggestion
✅ BUY ZONE: 1.35350 – 1.34957
Stop-Loss: 1.3460
Take-Profit Targets: 1.3588 → 1.3628
Enter only on bullish price action confirmation around the support zone.
✅ Conclusion
GBPUSD is trading under geopolitical stress, but the technical setup around 1.3495 – 1.3535 offers a potential bounce zone. A short-term recovery could unfold if sentiment stabilizes and central banks maintain the expected policy stance.
