Gbp-cad

GBPCAD INVERTED H&SGBPCAD has reached a support trend line and reacted with formed inverted H&S, bulls are still in power.


GBPCAD - SWING - 25. FEBR. 2021Welcome to our weekly trade setup ( GBPCAD )!
-
1 HOUR
Bearish price action.
4 HOUR
Market turned bearish, expecting more downsite.
DAILY
Overall good market structure, looking for more pressure.
-
FOREX SWING
SELL GBPCAD
ENTRY LEVEL @ 1.76830
SL @ 1.77410
TP @ 1.75820
Max Risk: 0.5% - 1%!
(Remember to add a few pips to all levels - different Brokers!)
Leave us a comment or like to keep our content for free and alive.
Have a great week everyone!
ALAN

Reversal at GBPCADHere we have an interesting opportunity from a reversal candle on D1
Yesterday GBPCAD closed very strongly down, leaving a long queue at the top before that.
In this way he managed to absorb the day before.
Viewed on the H1 chart, this represents a break of the upward trend.
At the moment we can expect a correction and test of the resistance levels, after which we will see new downward pressure.
The next serious support is at 1.7593!
If you have questions about how to trade this or another situation, contact us!
To support us, like and comment!

💡 Don't miss the great sell opportunity in GBPCADTrading suggestion:
. There is still a possibility of temporary retracement to suggested resistance line (1.7785). if so, traders can set orders based on Price Action and expect to reach short-term targets.
Technical analysis:
. GBPCAD is in a range bound and the beginning of downtrend is expected.
.The price is above the 21-Day WEMA which acts as a dynamic support.
. The RSI is at 46.
Take Profits:
TP1= @ 1.7650
TP2= @ 1.7585
TP3= @ 1.7480
TP4= @ 1.7350
TP5= @ 1.7185
SL: Break Above R2
❤️ If you find this helpful and want more FREE forecasts in TradingView
. . . . . Please show your support back,
. . . . . . . . Hit the 👍 LIKE button,
. . . . . . . . . . . Drop some feedback below in the comment!
❤️ Your Support is very much 🙏 appreciated! ❤️
💎 Want us to help you become a better Forex trader?
Now, It's your turn!
Be sure to leave a comment let us know how do you see this opportunity and forecast.
Trade well, ❤️
ForecastCity English Support Team ❤️


GBPCAD FLYING STARTAnother trade placed this morning here at Forexinsightsuk. This pair was a little different as we were waiting for confirmation on a daily time frame which took a little longer than usual but we finally have take off. Currently floating nicely in profit and hopefully we will see price push towards our take profit target either later this evening or tomorrow morning/afternoon.
Solid start to a Monday!

GBPCAD rejected by a monthly resistance 🦐GBPCAd is moving onside a minor ascending channel.
The market after the 2nd attempt to break lost strength and will look for a minor retracement.
If the market will break below, according to Plancton's strategy, we can set a nice short order.
–––––
Follow the Shrimp 🦐
Keep in mind.
• 🟣 Purple structure -> Monthly structure.
• 🔴 Red structure -> Weekly structure.
• 🔵 Blue structure -> Daily structure.
• 🟡 Yellow structure -> 4h structure.
• ⚫️ Black structure -> >4h structure.
Here is the Plancton0618 technical analysis , please comment below if you have any question.
The ENTRY in the market will be taken only if the condition of the Plancton0618 strategy will trigger.

GBPCAD a bullish momentum? 🦐GBPCAD on the 240 min chart after the last impulse retraced back until the 1.73900 structure.
The price from there started a new impulse to the upside and now is consolidating below a monthly structure.
IF the market will break above, according to Plancton's strategy, we will set a nice long order.
–––––
Follow the Shrimp 🦐
Keep in mind.
• 🟣 Purple structure -> Monthly structure.
• 🔴 Red structure -> Weekly structure.
• 🔵 Blue structure -> Daily structure.
• 🟡 Yellow structure -> 4h structure.
• ⚫️ Black structure -> >4h structure.
Here is the Plancton0618 technical analysis , please comment below if you have any question.
The ENTRY in the market will be taken only if the condition of the Plancton0618 strategy will trigger.

WE CALLED IT!!What another cracking week we've had here at forexinsightsuk and its only Tuesday.
We called a long position in our previous posts on GBPCAD and we waited patiently for the results.
BOOM! TP1 Hit and TP2 closed out at the same time to bank more profits overall. We posted our Entry, TP Levels and SL levels in our previous posts. Please let us know if you got on this trade and took a major win!


Mean-reversion - OVERBOUGHT - SHORT Greetings folks,
Price has pierced through the standard setting bollinger band and my mean-reversion system has indicated a setup.
Unfortunately, price has about reached the mean as of posting this trade idea.
The trading system with a preset 2:1 profit to risk ratio for this asset has historically:
101 trades
19 %/R returns
40% winrate
Do let me know if I should expand the assets and timeframe of ideas that I share.
Cheers,
PineConnector

GBPCAD Channel - Buy SetupUpwards sloping trending channel setup on GBPCAD.
Look for price to fall to lower trend line then move upwards towards upper resistance (black line)/upper trendline.

GBPCAD LONGMonday. My favourite day of the week, purely because the markets are waking up.
So we entered a long position on GBPCAD this morning. We are currently -2 percent but we are comfortably waiting for price to retest our strong resistance zone and eventually continue in a bullish momentum into our take profit area.
Our analysis has been created on a 1hr time frame for trading view but was originally added to our watchlist on a daily time frame. Both which were convincing that price was going to have a bullish momentum.
my entry was:
ENTRY @ 1.76032
SL @ 1.75432
TP1 @ 1.76632
TP2 @ 1.77332


gbpcad price is reaching most high of january , in my opinion there are a lot of sell orders waiting to push price at fresh demand zone. lets see what london session can bring to us

GBPCADGBPCAD SHORT
Confirmation list
1- While price was consolidating confermed a very strong support.
2-The price broke the support area without retesting ,
retesting is happening now so i expect everyone to sell gbpcad below the previous support.
3-I feel so confident
that everyone's sl is gonna be above this area
so i expect the marketto take everyone out,
retest the poi candle and 88.60 fib and then reverse.
4-IMB to be filled
5- This is just my vision scenario and im gonna
enter only if i see the right price action on smaller timeframe.

What I'd love to see on GBPCAD!If my trendline holds, with proper confirmation i'd be looking forward to short GBPCAD. Probabilities. Lets see

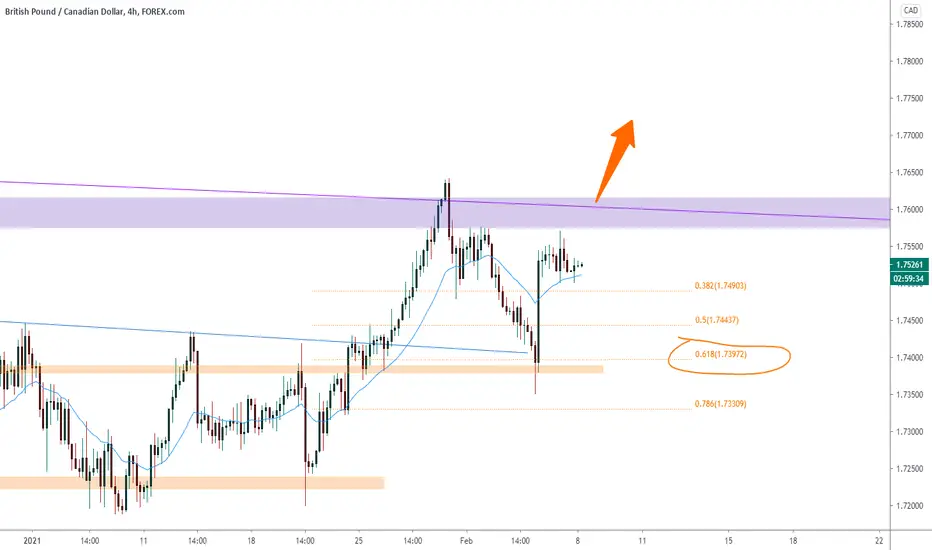
GBPCAD bounces over the 0.618 🦐GBPCAD on the 240 min chart after the last impulse retraced back until the 0.618 Fibonacci level.
The price from there started a new impulse to the upside and now is consolidating below a monthly structure.
IF the market will break above, according to Plancton's strategy, we will set a nice long order.
–––––
Follow the Shrimp 🦐
Keep in mind.
• 🟣 Purple structure -> Monthly structure.
• 🔴 Red structure -> Weekly structure.
• 🔵 Blue structure -> Daily structure.
• 🟡 Yellow structure -> 4h structure.
• ⚫️ Black structure -> >4h structure.
Here is the Plancton0618 technical analysis , please comment below if you have any question.
The ENTRY in the market will be taken only if the condition of the Plancton0618 strategy will trigger.
See GBPCAD!See daily chart - we expect an increase!
See H4 chart - we expect an increase!
See H1 chart - we expect an increase!
See the M30 chart - expect it to close above the resistance to buy up to 1.7707.
Higher values can be expected for a longer time.
The situation fail when the previous bottom breaks!
If you have questions about how to trade this or another situation, contact us!
To support us, like and comment!
