GBP-CHF

GBPCHF PATTERN SELLS Morning
I have seen this pattern so many times it normally indicates price is at a reversal!
Small % something like 0.3% I will put on the table!
MA - are showing a small uptrend! so SL is bigger than my normal strategy!
That's why I chose .3% to take as a risk!
Happy Trading

GBPCHF LONG TRADEGBPCHF broke major downtrendline
Price broke upper edge of triangle pattern
Price is based above HVN at level 1.1839 which indicates that pair is in accumulation phase
Above SMA 100 on H1 frame
MACD shows bullish momentum
It's expected for coming bullish wave to target key level 1.2110


Don't miss the great sell opportunity in GBPCHFTrading suggestion:
. There is still a possibility of temporary retracement to suggested resistance line (1.1885). if so, traders can set orders based on Price Action and expect to reach short-term targets.
Technical analysis:
. GBPCHF is in a range bound and the beginning of downtrend is expected.
. The price is below the 21-Day WEMA which acts as a dynamic resistance.
. The RSI is at 42.
Take Profits:
TP1= @ 1.1715
TP2= @ 1.1578
TP3= @ 1.1417
SL: Break Above R2


GBPCHF price is stalling out on the 200 EMA will it drop? This is a full breakdown of my perception of price action on higher time frames! I take my entries using smaller time frame confirmation and you should, too. If you have any questions about this trade or my strategies feel free to ask them in the comment section below!
Let’s make some money together!

GBPCHF SHORT TRADEGBPCHF respects downtrendline
Price rebounded from key level at 1.1906
Rejected from 50% Fibonacci level of preceding bearish wave at 1.1923
Below SMA 100
RSI reached overbought region
It's expected for coming strong bearish wave to test demand zone at level 1.1520

GBP/CHFStill short this pair, up about 200 pips. i also took partial profits on Friday and will, look to let the rest run on a break even stop.
If you want to find out more, drop me a message, and don't forget to check out my weekly review, where i go over my watchlist for the week!

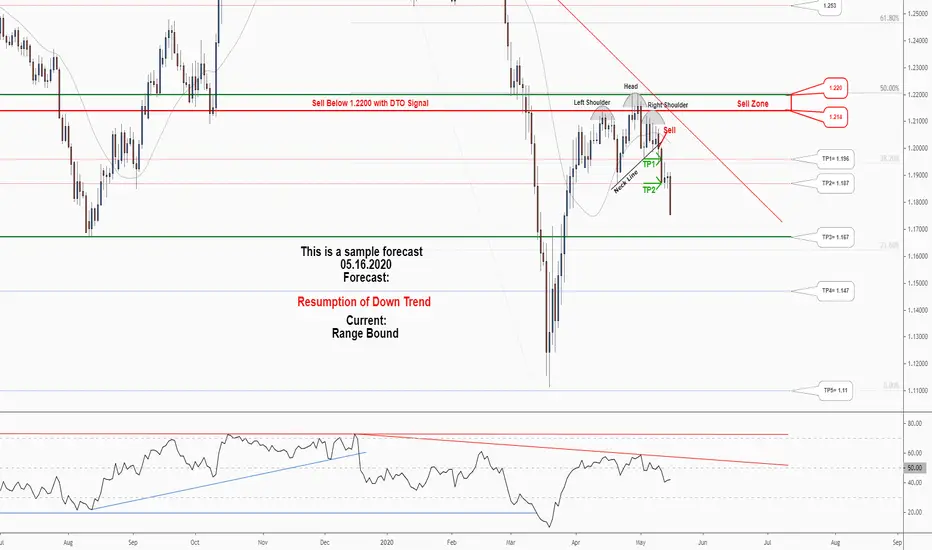
Don't miss this Sell trading opportunity of GBPCHF!Midterm forecast:
While the price is below the resistance 1.2200, resumption of downtrend is expected.
We make sure when the support at 1.1670 breaks.
If the resistance at 1.2200 is broken, the short-term forecast -resumption of downtrend- will be invalid.
Technical analysis:
A peak is formed in daily chart at 1.2115 on 05/05/2020, so more losses minimum to Major Support (1.1670) is expected.
Price is below WEMA21, if price rises more, this line can act as dynamic resistance against more gains.
Relative strength index (RSI) is 36.
Trading suggestion:
There is possibility of temporary retracement to suggested Sell Zone (1.22 to 1.214). We wait during the retracement, until the price tests the zone, whether approaching, touching or entering the zone.
We would set sell orders based on Daily-Trading-Opportunities and expect to reach short-term targets.
Beginning of entry zone (1.22)
Ending of entry zone (1.214)
Entry signal:
Signal to enter the market occurs when the price comes to " Sell zone " then forms one of the reversal patterns, whether " Shooting Star " or " Peak ", in other words, NO entry signal when the price comes to the zone BUT after any of reversal patterns is formed in the zone.
To learn more about " Entry signal " and special version of our " Price Action " strategy FOLLOW our lessons:
Trade Setup:
We opened 6 SELL trade(s) @ 1.1996 (day close price) based on 'Peak' at 2020.05.11.
Total Profit: 1022 pip
Closed trade(s): 162 pip Profit
Open trade(s): 860 pip Profit
Closed Profit:
TP1 @ 1.1960 touched at 2020.05.12 with 36 pip Profit.
TP2 @ 1.1870 touched at 2020.05.13 with 126 pip Profit.
36 + 126 = 162 pip
Open Profit:
Profit for one trade is 1.1996(open price) - 1.1781(current price) = 215 pip
4 trade(s) still open, therefore total profit for open trade(s) is 215 x 4 = 860 pip
All SLs moved to Break-even point.
Take Profit:
TP3= @ 1.1670
TP4= @ 1.1470
TP5= @ 1.1100
TP6= Free
GBPCHFHave waited long for this and finally it has broken. Now cooling off after putting so much efforts in breaking that wall. Guess when the Bear is done resting then its gonna begin dragging the price down as expected to the next support zone where she will likely cool off too before breaking past em cause the efforts put in the last break was much.
LOL!!!! Sorry for my weird analysis.

GBPCHF SHORT TRADEGBPCHF broke major uptrendline
Price is based below key level at 1.2080
and below HVN at level 1.2044 which indicates that pair is in distribution phase
Below SMA 100
MACD shows weakness in bullish momentum
RSI broke uptrendline
we r waiting to break level 1.2005 to open short trade
First target will be at support level 1.1870
then second target will be at demand zone near level 1.1700

GBPCHF SHORT TRADEGBPCHF formed bearish parabolic curve pattern
Pair broke major uptrendline
Price is based below SMA 100
and below key level at 1.2113
MACD shows start of bearish momentum
RSI broke uptrend
It's expected to target first support level at 1.1871
then target demand zone at 1.1708

Don't miss the great sell opportunity in GBPCHFTrading suggestion:
. There is still a possibility of temporary retracement to suggested resistance line (1.209). if so, traders can set orders based on Price Action and expect to reach short-term targets.
Technical analysis:
. GBPCHF is in a range bound and the beginning of downtrend is expected.
. The price is below the 21-Day WEMA which acts as a dynamic resistance.
. The RSI is at 46.
Take Profits:
TP1= @ 1.1870
TP2= @ 1.1675
TP3= @ 1.1250
SL: Break Above R2


GBP/CHF: Buying @ market Hi guys,
I am adding some longs to my current position in GBP/CHF.
We have a strong bullish divergence in play and it seems the support now has been found.
I am targeting the top of this flag.
Targets shown in my chart.
I will not keep the position over the weekend.
*** Trade at your own risk ***

Don't miss the great sell opportunity in GBPCHFTrading suggestion:
. There is still a possibility of temporary retracement to suggested resistance line (1.2128). if so, traders can set orders based on Price Action and expect to reach short-term targets.
Technical analysis:
. GBPCHF is in a range bound and the beginning of downtrend is expected.
.The price is above the 21-Day WEMA which acts as a dynamic support.
. The RSI is at 40.
Take Profits:
TP1= @ 1.2017
TP2= @ 1.1893
TP3= @ 1.1715
SL: Break Above R2

GBPCHF Price is sitting on trend line will it break? This is a full breakdown of my perception of price action on higher time frames! I take my entries using smaller time frame confirmation and you should, too. If you have any questions about this trade or my strategies feel free to ask them in the comment section below!
Let’s make some money together!
