Don't miss the great buy opportunity in GBPCHFTrading suggestion:
. There is a possibility of temporary retracement to suggested support line (1.3196). if so, traders can set orders based on Price Action and expect to reach short-term targets.
Technical analysis:
. GBPCHF is in a range bound and the beginning of uptrend is expected.
. The price is above the 21-Day WEMA which acts as a dynamic support.
. The RSI is at 62.
Take Profits:
TP1= @ 1.3329
TP2= @ 1.3415
TP3= @ 1.3815
SL= @ 1.3170
GBP-CHF

Data Makroekonomi Inggris Diterbitkan di bawah SorotanINFLASI DAN SUKU BUNGA
Selama minggu perdagangan berikutnya, perekonomian Inggris berada di bawah sorotan begitu perekonomian Inggris menerbitkan sejumlah besar data makroekonomi yang berdampak besar. Dengan Brexit yang ditunda hingga tanggal 31 Oktober, para trader dan investor akan sekali lagi memulai fokus mereka terhadap fundamental yang digarisbawahi di balik perekonomian Inggris.
Data inflasi global juga menjadi titik berat pada minggu ini karena kita akan menyaksikan penerbitan data dari perekonomian Swiss, India, Selandia Baru, Zona Eropa, Inggris, Kanada, dan Jepang. Kita juga akan melihat penerbitan angka PDB China dan Penjualan Ritel, Risalah Rapat Reserve Bank of Australia dan Data Ketenagakerjaan dan Pengangguran bulanan, yang datang dari perekonomian Australia.
Senin, 15 April, CHF Indeks Harga Produsen Swiss
Harga Produksi dan Impor diterbitkan oleh Swiss Federal Statistic Office dan merepresentasikan indikator utama, yang melacak jejak inflasi dalam harga produksi dan impor di Swiss. Angka-angka tersebut mewakili perubahan dalam indeks harga, yang dikombinasikan di antara produksi dan impor, mengalkulasikan perubahan dalam harga produksi dan harga impor, memberikan beban yang sesuai terhadap produk domestic dan impor.
Pasangan USDCHF hanya bullish ketika diperdagangkan di atas level 0.9980, kunci ketahanan berada pada level 1.0100 dan 1.0150.
Jika pasangan USDCHF bergerak di bawah level 0.9980, para penjual kemungkinan akan menjajal level dukungan 0.9945 dan 0.9910.
Selasa, 16 April, AUD Risalah Rapat RBA
Risalah Rapat Kebijakan Moneter Reserve Bank of Australia diterbitkan dua minggu setelah RBA memutuskan tingkat suku bunga mereka. Risalah Rapat RBA memberikan gambaran penuh atas diskusi kebijakan, termasuk faktor-faktor, yang memengaruhi keputusan para pembuat kebijakan dan perbedaan pandangan di antara para anggota RBA.
Pasangan AUDUSD bullish ketika diperdagangkan di bawah level 0.7150, kunci ketahanan teknis berada pada level 0.7220 dan 0.7245.
Jika pasangan AUDUSD diperdagangkan di bawah level 0.7150, para penjual kemungkinan akan menjajal level 0.7080 dan 0.7000.
Rabu, 17 April, CNY PDB China
Produk Domestik Bruto China diterbitkan oleh National Bureau of Statistic of China dan mengukur pendapatan dan pengeluaran nasional dalam perekonomian negara. Produk Domestik Bruto setara dengan biaya yang dikeluarkan untuk seluruh produk akhir dan layanan, yang diproduksi di dalam China dalam periode waktu yang ditentukan. Ini merupakan indikator utama untuk kesehatan suatu perekonomian dan menjadi hal yang signifikan karena keseluruhan perekonomian China terus mengalami pelambatan.
Pasangan USDJPY bullish ketika diperdagangkan di atas level 111.65, perolehan lebih jauh ke level 112.30 dan 113.10 kemungkinan akan terjadi.
Jika pasangan USDJPY diperdagangkan di bawah level 111.65, para penjual kemungkinan akan menjajal level dukungan 111.30 dan 110.90.
Kamis, 18 April, GBP Penjualan Ritel Inggris
Data Penjualan Ritel Inggris diterbitkan oleh National Statistics dan mengukur perubahan dalam nilai total penjualan, yang sudah disesuaikan dengan inflasi pada tingkatan ritel sepanjang periode waktu yang ditetapkan. Angka-angka ini merepresentasikan sebuah indikator biaya yang dikeluarkan oleh para konsumen dalam perekonomian Inggris. Volume penjualan ritel yang lebih tinggi umumnya menunjukkan permintaan konsumen yang menguat, hasil ritel yang lebih tinggi, dan pertumbuhan ekonomi dalam perekonomian Inggris.
Jika pasangan GBPUSD diperdagangkan di atas level 1.3100, perolehan lebih jauh ke level 1.3180 dan 1.3260 kemungkinan akan terjadi.
Jika pasangan GBPUSD bergerak di bawah level 1.3100, para penjual kemungkinan akan menjajal level dukungan 1.2980 dan 1.2840.
Jumat, 19 April, JPY CPI Nasional Jepang
Indeks Harga Konsumen (CPI) Nasional Jepang diterbitkan oleh Statistics Bureau dan mengukur perubahan dalam harga barang dan jasa dari sudut pandang konsumen. CPI merupakan indikator kunci, yang mengukur inflasi dan perubahan dalam tren pembelian. Oleh sebab itulah, angka-angka CPI terus dipantau oleh Bank of Japan. Sebuah peningkatan dalam Indeks Harga Konsumen mampu menentukan apakah Bank of Japan akan meningkatkan suku bunga mereka demi mengendalikan inflasi dan memperlambat pertumbuhan ekonomi atau tidak.
Pasangan AUDJPY hanya bearish ketika diperdagangkan di bawah level 78.90, kerugian lebih jauh ke level 78.20 dan 77.50 kemungkinan akan terjadi.
Jika pasangan AUDJPY diperdagangkan di atas level 78.90, para pembeli kemungkinan akan menjajal level ketahanan 80.50 dan 81.30.


GBPCHF Pending Long Opportunity GBPCHF Pending Long Opportunity @13150
Brexit Pressure has eased off the gas peddle for a while
No Real News Shockers to deflate the GBP due soon due to Govt recess holidays
We have gone long on the GBP ready for further drops later

GBP CHF Long wait for PULL BACK a lot of Ifs and maybes though GBP CHF Long wait for PULL BACK a lot of IFs though
Honestly there are a lot more safer clear trades out there than the GBP CHF
Too Much Brexit for me , back forth up and down up and down .
Saying that we will wait for a pull back to our trendline to buy in cheap for a good ROI
and then stat peeling TPs down

GBPCHF POSSIBLE sell tradeConfluence factors:
-Major down trend
-Fibo 38.1 and resistance zone retest
-50 EMA Retest
-Elliot Waves
-Flag retracement pattern after impulse
ONLY OPEN THE TRADE IF AN ENGULFING BEARISH BAR APPEARS IN THE CONFLUENCE ZONE

GBP CHF SELL (POUND STERLING - SWISS FRANC)Hi there. Price is forming a continuation pattern to the downside. The best place to take a sell trade is wait for the price to test the previous high, then watch strong price action for sell.

GBPCHF approaching support, potential bounce!GBPCHF is approaching our first support at 1.2852 (horizontal swing low support, 50% Fibonacci retracement, 61.8% Fibonacci extension) where a strong bounce might occur above this level to our major resistance at 1.3193 (horizontal swing high resistance, 61.8% Fibonacci retracement).
Stochastic is also approaching support.
Trading CFDs on margin carries high risk.
Losses can exceed the initial investment so please ensure you fully understand the risks.

GBP CHF Long above 129 EXCELLENT ROI potential As long as MAJOR level 129 holds
65 pips away at time of printing we shall stay long
Green shoots of Brexit resolutions will start to appear this week
possible major political changes which will buoy the GBP due to the current govt stalemate
Yes we are staying LONG above the 129

GBPCHF 1:3 Risk Reward Short (May take a month) GBP Short Bias
- LogicStrategy Quant score seen consecutive days of economic contraction for Great Britain. (-7) on the 26/03 and (-4) on the 27/03
CHF Long Bias
- LogicStrategy Quant scores saw a huge (+25) shift from 38 to 63 - showing continual swiss strength.
This idea suits the uncertain agenda for the british economy - with the institutions moving cash flow from uncertainty to safe-haven assets (CHF)

GBPCHF Short Opportunity: Ascending Wedge + RSI DivergenceHere we have a very nice opportunity to short GBPCHF for a few reasons:
1. After making a retracement to the .5 Fibonacci level , price has consolidated into an ascending wedge.
2. Furthermore, the structure of the larger, blue descending wedge is also providing a second level of resistance.
3. Finally, RSI is displaying clear divergence in the local uptrend.

GBPCHF, SELL ON 4HR, DONT MISS THIS RIDEGBPCHF Rising Wedge has ben broken and correcting
SCENARIO
Reccomendation - SELL
1. Look for Correction on Lower time frame and after correction breaks look for sell signals
OR
2. If Price pushes higer to test the Wedge Support now turned Resistance, look for Sell Signals for entries
Trade with care on GBP pairs because of BREXIT
GoodLuck
May the Market be with you.


GBP/CHF: Selling it now @ market price (engulfing bar on H4)Hi guys,
We have a nice bearish engulfing bar on H4, showing sellers could be in control.
I am selling the pair with a target @ 1.30350.
Best,
Jesse

gbpchfbutterfly pattern is completed and now i expect bullish for GBPCHF
i will update it soon...
comment your opinion

GBPCHF approaching support, potential bounce! GBPCHF is approaching our first support at 1.2852 (horizontal swing low support, 61.8% fibonacci extension, 50% fibonacci retracement) where a strong bounce might occur above this level to our first major resistance at 1.3057 (horizontal pullback resistance, 38.2% fibonacci retracement).
Stochastic (34,,53) is also approaching resistance where we might see a corresponding drop in price.
Trading CFDs on margin carries high risk.
Losses can exceed the initial investment so please ensure you fully understand the risks.

GBPCHF - How to TradeThe market makes every new high lower than the previous one. It gives a signal that probably the price will continue falling. As we have SMA100 not far from the current price, it acts as a strong support line. The breakout below this line will give confirmation of a trend reversal. We will be able to use this breakout as a sell signal with stop orders above the nearest swing high and profit targets at the resistance levels.
MACD and RSI support the downtrend movement.
As for the continuation of the uptrend, the price will have to break the local downtrend line and the resistance zone formed by 1.33000 and 1.33300 levels. It will give us a buy signal with stop orders below SMA100 and profit targets at the resistance levels.

GBPCHF Double bottom formationHere we have the GBPCHF trade where it looks like a double bottom formation where I will defiantly have a cheeky buy just like 10/1 odds

GBP/CHF Break OutRising wedge has been broken on the 4hr time frame, possible short opportunity may arise if the market retraces back towards the previous supporting trend line

GBPCHF approaching support, potential bounce! GBPCHF is approaching our first support at 1.3125 (horizontal overlap support, 38.2% Fibonacci retracement) where a strong bounce might occur above this level pushing price up to our major resistance at 1.3281 (horizontal swing high resistance, 76.4% Fibonacci retracement).
Stochastic (34,5,3) is also approaching support where we might see a corresponding bounce in price.
Trading CFDs on margin carries high risk.
Losses can exceed the initial investment so please ensure you fully understand the risks.

Tight range which will lead to big opportunity.The GBP/CHF pair is in an extremely tight range between the 0.618 resistance(through broken once) and the 0.5 Fibonacci level from my chart. This one was an easy short scalp from the golden pocket resistance with its bearish divergences, but now finds support at 1.31 where i closed my short and opened a long to trade this range. The old day trading resistance of 1.31 has now been broken and looks to try and flip old resistance to support for another move up.
For support we have 1.31 the .236 Fibonacci level, volume POC, and the old resistance which should flip to support. I also have been trading this pair from an in depth Elliott Wave count where we had been in a WXY correction, but have since formed an impulse wave from the bottom of Wave Y at 1.23 which is a good sign for the bulls. The problem that may hinder this is the Brexit news and uncertainty (though I do not trade news, only technicals). Top resistance is still the golden pocket and 1.345. My scalp long got filled on the move down today, so as of writing this I am still in a long day trading position, but I will take a much bigger position by adding upon a break of resistance, or alternately opening a short if we break through support.
There are bearish divergences forming on this pair across the histogram, MACD, RSI and Stochastic RSI is coming down, tweezer top candle stick pair also formed last week, which all came together for a great short opportunity back down to support. So whilst there is strong price action support, there are bearish arguments too mid term.
Therefore until a decision is made i will continue to scalp between 1.326 and 1.314 and open a much bigger trade upon resistance or support breaking.

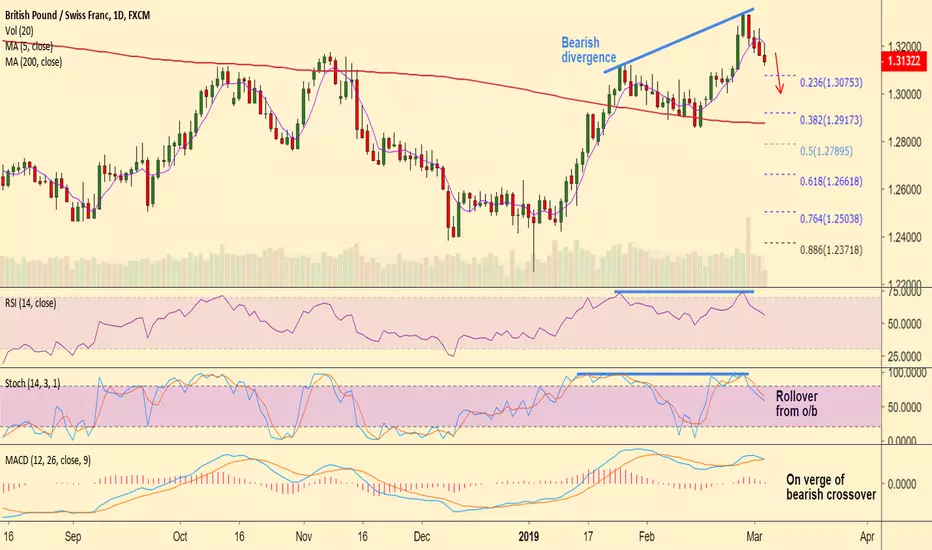
GBP/CHF short setupStochs have rolled over from overbought levels and MACD is on verge of bearish crossover on signal line.
We also evidence a bearish divergence on RSI and Stochs which adds to the bearish bias.
Upside was capped at 5-DMA and 5-DMA has turned south.
Good to go short on upticks, SL: 1.32, TP: 1.3075/ 1.30/ 1.2920