1W Channel Down intact. New Lower High. Short.GBPCHF is trading within a 1W Channel Down (RSI = 39.458, MACD = -0.016, Highs/Lows = -0.0058, B/BP = -0.0282) and just made a new Lower High (1D borderline neutral, MACD = 0, Ultimate Oscillator = 50.989). We are short again with TP = 1.22511.
GBP-CHF

GBPCHF approaching resistance, potential drop! GBPCHF is approaching our first resistance at 1.2798 (horizontal swing high resistance, 61.8% Fibonacci extension, 23.6% Fibonacci retracement) and a strong drop might occur below this level pushing price down to our major support at 1.2630 (horizontal swing low support, 50% Fibonacci retracement).
Stochastic (55,5,3) is also approaching our major resistance and seeing a bearish divergence where a reaction off this level might see a corresponding drop in price.
Trading CFDs on margin carries high risk.
Losses can exceed the initial investment so please ensure you fully understand the risks.


GBPCHF approaching resistance, potential drop!GBPCCHF is approaching our first resistance at 1.2863 (horizontal overlap resistance, 61.8% Fibonacci extension, 23.6% Fibonacci retracement, descending channel resistance) and a strong drop might occur below this level pushing price down to our major support at 1.2283 (61.8% Fibonacci extension, horizontal swing low support, 76.4% Fibonacci retracement).
Stochastic (89,5,3) is also approaching resistance and a reaction off this level might see a corresponding drop in price.
Trading CFDs on margin carries high risk.
Losses can exceed the initial investment so please ensure you fully understand the risks.

NDZJPY Approaching Resistance, Potential Reversal!NZDJPY is approaching its resistance at 74.11 (61.8% Fibonacci extensionx2, 61.8%, 23.6%, 38.2% Fibonacci retracement, horizontal overlap resistance) where it could potentially fall to its support at 73.11 (50% Fibonacci retracement, horizontal overlap support).
Stochastic (89, 5, 3) is also approaching its resistance at 98% where a corresponding reversal could occur.

GBPCHF approaching resistance, potential drop! GBPCHF is approaching our first resistance at 1.2853 (horizontal overlap resistance, 61.8% Fibonacci extension, 23.6%, Fibonacci retracement) and a strong drop might occur below this level pushing price down to our major support at 1.2283 (horizontal swing low support, 61.8% Fibonacci extension, 76.4% Fibonacci retracement).
Stochastic (89,5,3) is also approaching resistance and a reaction below this level might see a corresponding drop in price.
Trading CFDs on margin carries high risk.
Losses can exceed the initial investment so please ensure you fully understand the risks.


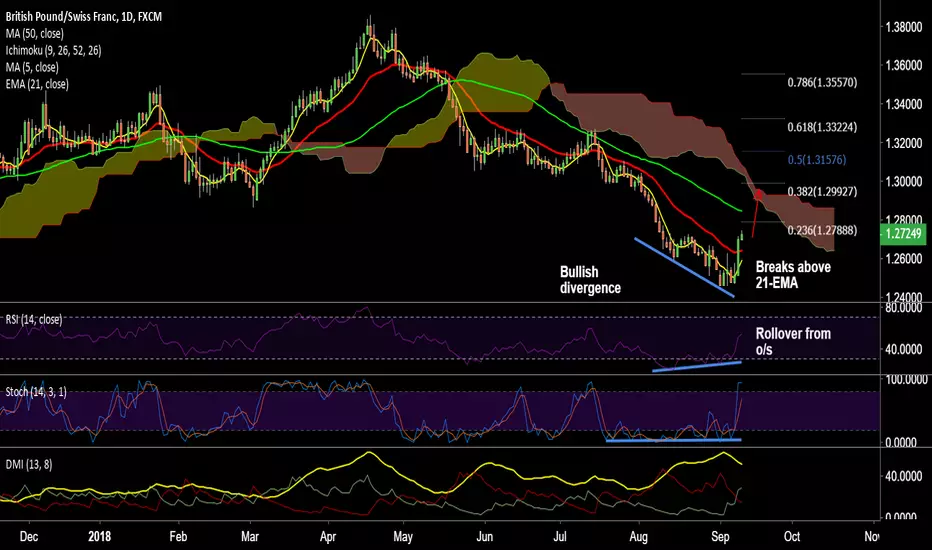
GBP/CHF long opportunity GBP/CHF has edged lower from 5-week highs at 1.2742, bias bullish.
The pound remains buoyed ahead of UK labor market report.
Upbeat growth in the UK’s wages could further the ongoing bullish momentum seen around the pound.
Technical indicators are turning bullish on the intraday charts. Stochs and RSI have rolled over from oversold levels.
The pair has broken above 21-EMA and is poised for further upside.
Support levels - 1.2645 (21-EMA), 1.2592 (5-DMA), 1.25
Resistance levels - 1.2788 (23.6% Fib), 1.2848 (50-DMA), 1.30 (38.2% Fib/)
Good to go long on dips, SL: 1.2590, TP: 1.2785/ 1.2850/ 1.30

GBP/CHF pivotal at 61.8% Fib, short break belowThe Pound remains weak across the board, solid UK retail sales were unable to offset concerns about a no-deal Brexit.
Brexit talks have resumed this Thursday in Brussels with the main issue being on how to prevent a hard border in the Irish Island.
Technical indicators on weekly charts are heavily bearish. Price action has dipped below weekly cloud, broken below strong trendline support at 1.27.
Recovery attempts lack traction. Break below 61.8% Fib will see further weakness till 1.2227 (78.6% Fib).
Support levels - 1.2575 (61.8% Fib), 1.2442 (Aug 2016 low), 1.2227 (78.6% Fib)
Resistance levels - 1.27 (trendline support turned resistance), 1.2820 (50% Fib), 1.2840 (21-EMA)
Watch out for break below 61.8% Fib to go short, SL: 1.27, TP: 1.2440/ 1.23/ 1.2230


GBPCHF approaching support, potential bounce! GBPCHF is approaching our first support at 1.2590 (horizontal overlap support, 61.8% Fibonacci extension, 50% Fibonacci retracement) and a strong bounce might occur above this level pushing price up to our major resistance at 1.2650 (horizontal overlap resistance, 100% Fibonacci extension).
Stochastics (55,5,3) is also approaching our support and a strong bounce above this level might see a corresponding rise in price.
Trading CFDs on margin carries high risk.
Losses can exceed the initial investment so please ensure you fully understand the risks.

GBPCHF testing resistance, potential drop! GBPCHF is approaching our first resistance at 1.2655 (horizontal overlap resistance, 61.8% Fibonacci retracement, 100% Fibonacci extension) and a strong reaction might occur below this level pushing price down to our major support at 1.2612 (horizontal swing low support, 38.2% Fibonacci retracement, 61.8% Fibonacci extension).
Stochastic (89,5,3) is also testing our resistance and a reaction below this level might see a corresponding drop in price.
Trading CFDs on margin carries high risk.
Losses can exceed the initial investment so please ensure you fully understand the risks.


Target hit. Lower Low made. Long.TP = 1.2866 hit as the previous confirmation point (1.301050) got crossed activating the short. GBPCHF has now completed a Lower Low on the 1D Channel Down (RSI = 30.531) and should either consolidate or rise strongly for a new Lower High. We go long with TP = 1.28100, preparing to reverse to shorting there as the dominant trend remains bearish.

GBP/CHF: 1H ChartThe GBP/CHF exchange rate has been moving north since the middle of August when it reversed from 2018 low at the 1.2595 mark.
By the time of this analysis, the rate had reached the lower boundary of a short-term ascending channel near 1.2650. It is very likely that a downside momentum starts prevailing within the nearest future as the 55- and 100-period SMAs (4H) push the rate down.
It is the unlikely case that some bullish pressure still prevails in the market, the Pound should not exceed the monthly S1 at the 1.2758 mark.

GBP/CHF 'Death Cross' adds bearish bias, tgt 61.8% FibGBP/CHF grinds lower after 'Death Cross' formation, next bear target at 61.8% Fib
Brexit woes show little sign of dissipating anytime soon, GBP to remain under pressure.
On the data front is UK Q4 GDP data that will come on Friday. Upbeat reading could lend the pound some support.
Momentum with the bears. Next bear target lies at 61.8% Fib at 1.2845 ahead of 1.2745 (Oct 6 low).
On the flipside, 21-EMA is strong resistance at 1.3022. Decisive break above could see upside till daily cloud.
Good to stay short on upticks, target 1.2845/ 1.2745


