gbpchfit break the resistance we will wait it to retest this area then buying gbpchf tRGET 145 POINT STOP LOSS WILL BE 30 POINT
GBP-CHF

GBPCHF to find resistance at 0.618 pullback level?GBPCHF - Intraday - We look to Sell at 1.1300 (stop at 1.1335)
Buying pressure from 1.1195 resulted in prices rejecting the dip.
We have a 61.8% Fibonacci pullback level of 1.1298 from 1.1435 to 1.1075.
The 200 day moving average should provide resistance at 1.1250.
This is negative for short term sentiment and we look to set shorts at good risk/reward levels for a further correction lower.
Further downside is expected although we prefer to sell into rallies close to the 1.1300 level.
Our profit targets will be 1.1195 and 1.1175
Resistance: 1.1580 / 1.1905 / 1.2115
Support: 1.1035 / 1.0870 / 1.0705
Risk Disclaimer
The trade ideas beyond this page are for informational purposes only and do not constitute investment advice or a solicitation to trade. This information is provided by Signal Centre, a third-party unaffiliated with OANDA, and is intended for general circulation only. OANDA does not guarantee the accuracy of this information and assumes no responsibilities for the information provided by the third party. The information does not take into account the specific investment objectives, financial situation, or particular needs of any particular person. You should take into account your specific investment objectives, financial situation, and particular needs before making a commitment to trade, including seeking advice from an independent financial adviser regarding the suitability of the investment, under a separate engagement, as you deem fit.
You accept that you assume all risks in independently viewing the contents and selecting a chosen strategy.
Where the research is distributed in Singapore to a person who is not an Accredited Investor, Expert Investor or an Institutional Investor, Oanda Asia Pacific Pte Ltd (“OAP“) accepts legal responsibility for the contents of the report to such persons only to the extent required by law. Singapore customers should contact OAP at 6579 8289 for matters arising from, or in connection with, the information/research distributed.

GBPCHF - Trading Inside The Box! 📦Hello TradingView Family / Fellow Traders. This is Richard, as known as theSignalyst.
on H4: Left Chart
GBPCHF has been stuck inside a range so we will be trading the range until it is eventually broken upward or downward.
Now since GBPCHF is sitting around the upper bound of the range, we will be looking for sell setups on lower timeframes.
o n H1: Right Chart
🏹 For the bears to take over, we need a momentum candle close below the gray last swing low to sell.
Meanwhile, until the sell is activated, GBPCHF can still trade higher or even break the upper bound of the range.
📚 Always follow your trading plan regarding entry, risk management, and trade management.
Good luck!
All Strategies Are Good; If Managed Properly!
~Rich

GBPCHF a short opportunity 🦐The GBPCHF currency pair is currently in a bearish trend on the daily chart, as indicated by the formation of descending highs and equal lows. This price action suggests that there is strong downward momentum and that the bears are in control of the market.
Price has been consistently trading below a key support area at 1.11000, which is a critical level for this pair. If the price breaks below this level, it could signal a further decline and open the door for a sell opportunity for traders looking to capitalize on the bearish continuation.
In technical analysis, a break below a support area is often seen as a bearish signal, as it indicates that the bears are taking over and pushing the price down. This can also result in a shift in market sentiment, with traders becoming more bearish and potentially leading to further selling pressure.
However, it's important to keep in mind that technical analysis is just one tool in the arsenal of a trader and it should always be used in conjunction with other forms of analysis, such as fundamental analysis and risk management. Additionally, it's also important to consider the potential for false breakouts, so traders should use stop losses and have a clear exit strategy in place.
We will wait for a clear break and move on the 4h chart to check the opportunity of a short order according to the Plancton's strategy rules.

GBPCHF Potential for Bearish Drop towards previous swing low Looking at the H4 chart, my overall bias is bearish due to the current price being below the Ichimoku cloud, indicating a bearish market.
Looking for a pullback sell entry at 1.12724, where the overlap resistance and 50% Fibonacci line is. Take profit will be at 1.10481, where the previous swing low is. Stop loss will be at 1.14351, where the previous swing high is.
Please be advised that the information presented on TradingView is provided to Vantage (‘Vantage Global Limited’, ‘we’) by a third-party provider (‘Everest Fortune Group’). Please be reminded that you are solely responsible for the trading decisions on your account. There is a very high degree of risk involved in trading. Any information and/or content is intended entirely for research, educational and informational purposes only and does not constitute investment or consultation advice or investment strategy. The information is not tailored to the investment needs of any specific person and therefore does not involve a consideration of any of the investment objectives, financial situation or needs of any viewer that may receive it. Kindly also note that past performance is not a reliable indicator of future results. Actual results may differ materially from those anticipated in forward-looking or past performance statements. We assume no liability as to the accuracy or completeness of any of the information and/or content provided herein and the Company cannot be held responsible for any omission, mistake nor for any loss or damage including without limitation to any loss of profit which may arise from reliance on any information supplied by Everest Fortune Group.

GBPCHF Potential for Bearish Drop | 15th February 2023Looking at the H4 chart, my overall bias is bearish due to the current price being below the Ichimoku cloud, indicating a bearish market.
Looking for a pullback sell entry at 1.12724, where the overlap resistance and 50% Fibonacci line is. Take profit will be at 1.10481, where the previous swing low is. Stop loss will be at 1.14351, where the previous swing high is.
Any opinions, news, research, analyses, prices, other information, or links to third-party sites contained on this website are provided on an "as-is" basis, as general market commentary, and do not constitute investment advice. The market commentary has not been prepared in accordance with legal requirements designed to promote the independence of investment research, and it is therefore not subject to any prohibition on dealing ahead of dissemination. Although this commentary is not produced by an independent source, FXCM takes all sufficient steps to eliminate or prevent any conflicts of interest arising out of the production and dissemination of this communication. The employees of FXCM commit to acting in the clients' best interests and represent their views without misleading, deceiving, or otherwise impairing the clients' ability to make informed investment decisions. For more information about the FXCM's internal organizational and administrative arrangements for the prevention of conflicts, please refer to the Firms' Managing Conflicts Policy. Please ensure that you read and understand our Full Disclaimer and Liability provision concerning the foregoing Information, which can be accessed on the website.


GBPCHF - Strong Support!Hello TradingView Family / Fellow Traders. This is Richard, as known as theSignalyst.
on DAILY: Left Chart
GBPCHF is sitting around a strong support zone and lower orange trendline so we will be looking for buy setups on lower timeframes.
on M30: Right Chart
GBPCHF is forming a channel in red but it is not ready to go yet.
🏹Trigger => for the bulls to take over, we need a momentum candle close above the upper red trendline and last major high in gray.
Meanwhile, until the buy is activated, GBPCHF can still trade lower.
Always follow your trading plan regarding entry, risk management, and trade management.
Good luck!
All Strategies Are Good; If Managed Properly!
~Rich

GBP/CHF 4H Bullish Trend, Long Opportunity 🦐The market trend for GBP/CHF on the 4H chart appears to be bullish, with the price action showing a series of higher highs and higher lows.
This pattern is a positive indication for buyers in the market. The recent test of resistance and subsequent move towards the 50% Fibonacci level adds further confirmation of the bullish sentiment.
How can i approach this scenario?
If the price can break above the resistance, it could provide a potential opportunity for traders to enter the market with a long order according to the Plancton's strategy rules.
--––
Follow the Shrimp 🦐
Keep in mind.
🟣 Purple structure -> Monthly structure.
🔴 Red structure -> Weekly structure.
🔵 Blue structure -> Daily structure.
🟡 Yellow structure -> 4h structure.
⚫️ Black structure -> <4h structure.

GBPCHF about to launchAfter our previous supply was broken with momentum, price left behind an imbalance with a clean 15 min POI. Price then formed liquidity above it and is now looking to use that POI to push even further, thus offering us a chance to join in on this flip entry.

GBPCHF bullish bounce to see
Hi viewers, GBPCHF on zone, here expcted bounce to see
TP1:1.14900 (70)
TP2:1.15200 (100)
TP3:1.15400 (120)

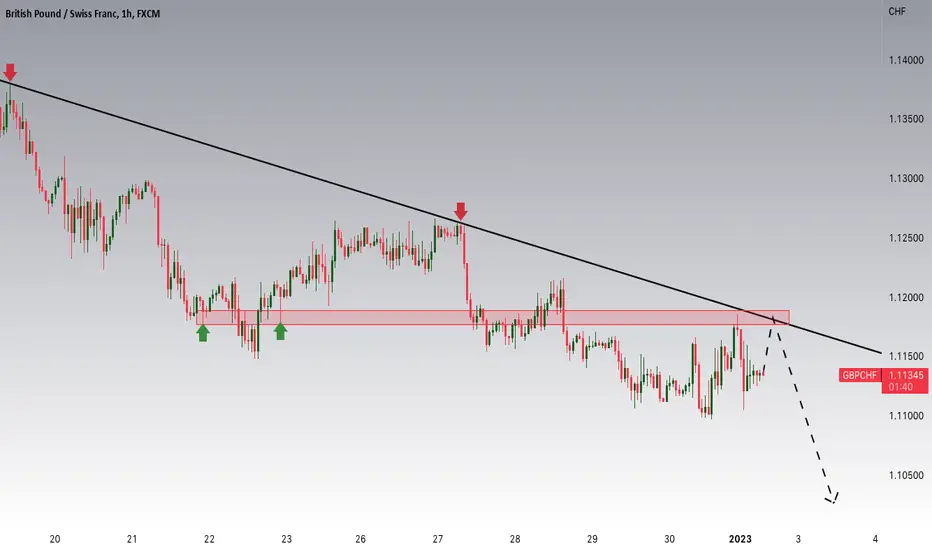
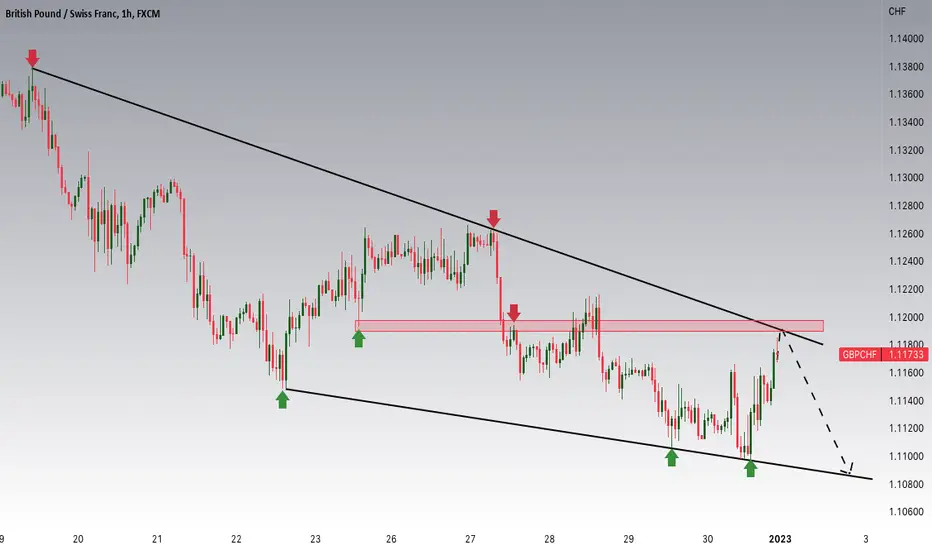
$GBPCHF$GBPCHF - A break to either direction!
We had a pull back finally in the market, AUDCHF came down and various other markets such as ES, GBP etc. Now I'm going through minor FX pairs this is a break either direction. We are within channel, added alerts in to either direction of break.
If we were to go above and carry on within channel expect 200 EMA target areas.
If we were to go below and beak down - 1.11600 / 1.11400 areas is a good target area.
Don't forget to trade your own plan!
Trade Journal

GBPCHF RUNNING IN THE AIRGBPCHF is retesting an area that I am quite familar with... I can see the retest and push up. Patience !!

GBPCHF Potential DownsidesHey Traders, in today's trading session we are monitoring GBPCHF for a selling opportunity around 1.14 zone, once we will receive any bearish confirmation the trade will be executed.
Trade safe. Joe.

GBPCHF Potential For Bullish ContinuationLooking at the H4 chart, my overall bias for GBPCHF is bullish due to the current price being above the Ichimoku cloud , indicating a bullish market. Looking for a pullback buy entry at 1.12686, where the 23.6% Fibonacci line is. Stop loss will be at 1.11843, where the 61.8% Fibonacci line is. Take profit will be at 1.14223, where the 78.6% Fibonacci line is.
Please be advised that the information presented on TradingView is provided to Vantage (‘Vantage Global Limited’, ‘we’) by a third-party provider (‘Everest Fortune Group’). Please be reminded that you are solely responsible for the trading decisions on your account. There is a very high degree of risk involved in trading. Any information and/or content is intended entirely for research, educational and informational purposes only and does not constitute investment or consultation advice or investment strategy. The information is not tailored to the investment needs of any specific person and therefore does not involve a consideration of any of the investment objectives, financial situation or needs of any viewer that may receive it. Kindly also note that past performance is not a reliable indicator of future results. Actual results may differ materially from those anticipated in forward-looking or past performance statements. We assume no liability as to the accuracy or completeness of any of the information and/or content provided herein and the Company cannot be held responsible for any omission, mistake nor for any loss or damage including without limitation to any loss of profit which may arise from reliance on any information supplied by Everest Fortune Group.

GBPCHF Potential for Bullish Continuation Looking at the H4 chart, my overall bias for GBPCHF is bullish due to the current price being above the Ichimoku cloud, indicating a bullish market. Looking for a pullback buy entry at 1.12686, where the 23.6% Fibonacci line is. Stop loss will be at 1.11843, where the 61.8% Fibonacci line is. Take profit will be at 1.14223, where the 78.6% Fibonacci line is.
Please be advised that the information presented on TradingView is provided to Vantage (‘Vantage Global Limited’, ‘we’) by a third-party provider (‘Everest Fortune Group’). Please be reminded that you are solely responsible for the trading decisions on your account. There is a very high degree of risk involved in trading. Any information and/or content is intended entirely for research, educational and informational purposes only and does not constitute investment or consultation advice or investment strategy. The information is not tailored to the investment needs of any specific person and therefore does not involve a consideration of any of the investment objectives, financial situation or needs of any viewer that may receive it. Kindly also note that past performance is not a reliable indicator of future results. Actual results may differ materially from those anticipated in forward-looking or past performance statements. We assume no liability as to the accuracy or completeness of any of the information and/or content provided herein and the Company cannot be held responsible for any omission, mistake nor for any loss or damage including without limitation to any loss of profit which may arise from reliance on any information supplied by Everest Fortune Group.

GBPCHF Potential DownsidesHey traders, in today's trading session we are monitoring GBPCHF for a selling opportunity around 1.123 zone, once we will receive any bearish confirmation the trade will be executed.
Trade safe, Joe.

Which Forex trading opportunities could 2023 bring?Fundamentals drive the markets... Here is what we could see happen in 2023...
1. Inflation reversal - possible downside for the US Dollar. Rising inflation and inflation fears drove the USD higher in 2022. Now that inflation is coming down and is more under control, we could see USD downside throughout 2023.
2. Global recession trades - this is already priced in, as the recession has been so well broadcast over the last few months. What isn't priced in is if the recession doesn't happen or is much deeper than expected. Look out for opportunities on CHF and USD pairs - CHF and USD strength if the recession is worse than expected. The opposite if no recession crystallises in 2023 and if no recessions are expected in 2024.
3. Russia-Ukraine war escalation/de-escalation trades - hopefully, we see an end to this war. Either way, we could see EUR and USD pairs impacted. USD strength and EUR weakness, if there is escalation. The opposite if the war ends.
4. GBP recovery trades(?) - sterling is undervalued (it is looking cheap). Possible GBP upside throughout 2023, as stability returns to the UK. GBPCHF, GBPJPY and GBPUSD could provide strong upside opportunities, depending on the outcome of points 1 and 2 of this post.
Obviously, anything could happen - this is the current outlook as of 5th January 2023, things could look very different in a month!
Wishing you all the best for 2023!

GBPCHF Potential DownsidesHey traders, in this week we are monitoring GBPCHF for a selling opportunity around 1.118 zone, once we will receive any bearish confirmation the trade will be executed.
Trade safe, Joe.
GBPCHF:CHF continues the outperformance with hawkish SNBHey traders, in the coming week we are monitoring GBPCHF for a selling opportunity around 1.119 zone, once we will receive any bearish confirmation the trade will be executed.
Trade safe, Joe.
GBPCHF Consolidating In Falling In H1 Timeframe (bulish Pattern)
Rsi Also Printed Bulish Divergence We Only Needs Upside Breakout Of Wedge To Enter In This Trade
If Its Breaks To The Upside Expecting Bulish Impulse ( Plz Always Wait For Breakout To Be Confirmed)
Keep In Mind Until Breakout Gbpchf Will Remain Bearish
This Is Not Financial Advice You Can Trade According To Rules And analysis

GBPCHF Potential downsidesHey traders, in today's trading session we are monitoring GBPCHF for a selling opportunity around 1.12400 zone, once we will receive any bearish confirmation the trade will be executed.
Trade safe, Joe.

GBPCHF SELL**Fundamental view :** the British pound could be the main victim of a strengthening euro, "as the Bank of England (BoE) is closer to the end of its tightening cycle than the Fed and the U.K.'s large current account deficit makes the pound vulnerable in a global slowdown.”
Pound Slumps as BoE Forecasts Recession for UK
The Pound (GBP) was initially boosted by stronger-than-expected GDP figures on Monday. Persistent expectations of a recession kept GBP’s upward movement limited, however.
Mixed jobs data on Tuesday largely weighed on the Pound. A rise in unemployment undermined a bump in wage growth. This, along with a drop in inflation on Wednesday, saw markets pare back their BoE rate hike bets.
Thursday’s interest rate decision from the central bank pulled Sterling lower. Dovish forward guidance alongside the **50bps interest rate hike** dented confidence in the Pound.
Finally on Friday, an unexpected slump in November’s retail sales deepened GBP’s losses.
****"We therefore think short GBP/CHF is the best relative value expression of policy divergence essentially long EUR/GBP with a “BTP hedge” - Goldman Sachs.****
UK bonds slumped on speculation a wave of extra supply will drive down prices as the Bank of England prepares to push on selling its sovereign holdings at the start of the new year.
Yields on 10-year gilts jumped as much as 16 basis points to 3.48% on Monday, the highest since early November
**Central Banks view :**
Actual is **3.5%** but more to come. The BoE, which is battling double-digit inflation that has unleashed a cost-of-living crisis that is pushing the economy deeper into recession, ** (www.reuters.com)** by a combined **325 bps in 2022** alone to their highest since late 2008.
UK rates began rising in December 2021, making the BoE the first of the world's major central banks to kick off a monetary policy-tightening cycle.
This is to a financial advice, just my own analysis.
