GBPJPY a turn at the 0.618 🦐GBPJPY on the 4h chart retraced èerfectly at the 0.618 Fibonacci level exactly at the 169.900 at the previous higher low level.
The price is now trading above a minor resistance and the actual lower low lower high move has been respected.
How can i approach this scenario?
I will wait for a possible break of the support and in that case, i will consider a nice short order according to the Plancton's's strategy rules.
-----
Follow the Shrimp 🦐
Keep in mind.
🟣 Purple structure -> Monthly structure.
🔴 Red structure -> Weekly structure.
🔵 Blue structure -> Daily structure.
🟡 Yellow structure -> 4h structure.
⚫️ Black structure -> <4h structure.
Here is the Plancton0618 technical analysis , please comment below if you have any question.
The ENTRY in the market will be taken only if the condition of the Plancton0618 strategy will trigger.
Gbp-jpy

GBPJPY #GBPJPY
- BREAK OF STRUCTURE
- RETRACEMENT
- FIBONACCI 61.80%
- DIVERGENCE
- BULLISH CHANNEL ( Breakout of LTL )
- DOUBLE TOP
- ELLIOT WAVES
These are the Reasons for Sell I Hope you know how to Use them

GBPJPY: Important Breakout 🇬🇧🇯🇵
GBPJPY was steadily growing within a rising parallel channel for the last 3 weeks.
The market reached a key daily structure resistance on Friday.
Bears started to push heavily from that and the price broke and closed below the support of the channel.
It will trigger a bearish continuation.
Next supports: 166.3 / 165.3
❤️If you have any questions, please, ask me in the comment section.
Please, support my work with like, thank you!❤️

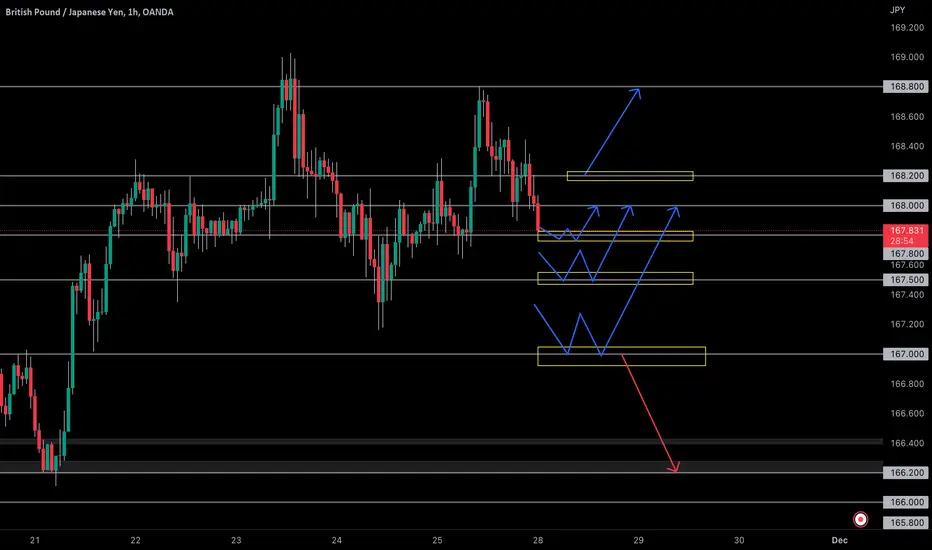
GJ break expected
Hello viewers, price on zone, bearish break exepcting to see
TP1: 166.500 (100)
TP2: 166.000 (150)

GBPJPY SetUPGBPJPY SETUP
Continue WITH the BUYS
╔═╦╗╔╦╗╔═╦═╦╦╦╦╗╔═╗
║╚╣║║║╚╣╚╣╔╣╔╣║╚╣═╣
╠╗║╚╝║║╠╗║╚╣║║║║║═╣
╚═╩══╩═╩═╩═╩╝╚╩═╩═╝
GBPJPY 27th November 2022 (Asian Session)
Summary:
* Overall Bullish Trend
* We are in a short term pullback
* Only available opportunity i see right now:
Buy at 167.700 IF we fail to break that support zone
Another update during pre-ny will be made.

GJPART1
Price is still following the double bottom it formed back in 2020. So now we have the trend which is bullish. Yet it should not be seen as a basis because it will obstruct and hurt your trading account. TRADE WHAT YOU SEE NOW WHAT YOU FEEL.
Kill emotions, Burn expectations, Switch on your skills and Enhance your screen and eyes.
💴💹💷

GBPJPY - Potential Bearish Reversal!Hello TradingView Family / Fellow Traders. This is Richard, as known as theSignalyst.
on DAILY: Left Chart
As per my last analysis, we know that GBPJPY is around a resistance zone so we will be looking for sell setups.
on H4: Right Chart
GBPJPY is forming a head and shoulders pattern but it is not ready to go yet.
Trigger => for the bears to take over, we need a momentum candle close below the gray neckline.
Meanwhile, until the sell is activated, GBPJPY can still trade trade or even break the resistance zone .
Always follow your trading plan regarding entry, risk management, and trade management.
Good luck!
All Strategies Are Good; If Managed Properly!
~Rich

InvestMateGBP/JPY Attention, strong line of resistance ahead💷💴GBP/JPY Attention, strong line of resistance ahead.
💷💴That's as I wrote some time ago about the upside on this pair. Link below:
💷💴Now it's time to refresh the topic and give you my latest view.
💷💴As we can see the Pound is not giving up and is trundling forward with most forex pairs.
💷💴I determined the support zone based on the cluster of fibo levels of 0.382 of the entire last downward correction and the level of 0.886 of the entire downward wave measured from peak to bottom visible on the chart. It can be seen that the price has repeatedly found this level as resistance but also as support in the past.
💷💴The resistance zone results from a cluster of also 2 fibo levels. It is a double of the 1.272 level of the same waves as the support zone. This combination creates a really strong zone.
💷💴Beginning with the fact that GBP/JPY is in an uptrend of several years, I don't think getting this level will be a major problem.
💷💴The scenario I am playing out is a continuation of the upside to the resistance zone where I will be watching closely to see how price reacts. I am aware of the possibility of a correction at any time, this should be taken into account, If the outlook would change I will publish a post with an update, so I encourage you to actively follow the profile and read the description carefully.
💷💴 *Please do not suggest the path I have drawn with the lines this is only a hypothetical scenario.
🚀If you appreciate my work and effort put into this post I encourage you to leave a like and give a follow on my profile.🚀

GBPJPY 25/11/2022Details on chart - lower volume means protect capital more, stick to plan and watch for moves above range rather than forcing trade

RLinda ! GBPJPY-> Triangle at the base of the rangeGBPJPY is in a narrow upward range (price channel) Price is squeezed between 169.09 and 167.39. The local trend is upward. What to expect?
We see the formation of an upward price channel in a consolidated movement, the nearest target due to the resistance of 169.09 has not been reached, the price went down, but a triangle pattern is formed at the base of the upward channel, if the price breaks the resistance of the pattern, it may go to 169.09 again and then to 170.58.
Should we expect a break-down of the pattern support? Less likely, but yes, because a secondary retest of the channel support is formed and the price might break it and go towards 166.100
Regards R. Linda!

Buying GBPJPY on dips.GBPJPY - Intraday - We look to Buy at 166.13 (stop at 165.33)
There is no sign that this bullish momentum is faltering but the pair has stalled close to a previous swing high of 169.09.
The current move lower is expected to continue.
The bias is still for higher levels and we look for any dips to be limited.
Further upside is expected although we prefer to buy into dips close to the 165.90 level.
Our profit targets will be 167.98 and 170.68
Resistance: 168.70 / 172.15 / 174.20
Support: 164.00 / 161.10 / 158.70
Risk Disclaimer
The trade ideas beyond this page are for informational purposes only and do not constitute investment advice or a solicitation to trade. This information is provided by Signal Centre, a third-party unaffiliated with OANDA, and is intended for general circulation only. OANDA does not guarantee the accuracy of this information and assumes no responsibilities for the information provided by the third party. The information does not take into account the specific investment objectives, financial situation, or particular needs of any particular person. You should take into account your specific investment objectives, financial situation, and particular needs before making a commitment to trade, including seeking advice from an independent financial adviser regarding the suitability of the investment, under a separate engagement, as you deem fit.
You accept that you assume all risks in independently viewing the contents and selecting a chosen strategy.
Where the research is distributed in Singapore to a person who is not an Accredited Investor, Expert Investor or an Institutional Investor, Oanda Asia Pacific Pte Ltd (“OAP“) accepts legal responsibility for the contents of the report to such persons only to the extent required by law. Singapore customers should contact OAP at 6579 8289 for matters arising from, or in connection with, the information/research distributed.

GBPJPY targeting 172.250. Excellent long-term pattern.The GBPJPY pair has been rebounding strongly since the November 11 Low within the 1D MA50 (blue trend-line) and the 1D MA200 (orange trend-line). The Low was made on the Inner Higher Lows trend-line, that has had four hit-and-holds since May 12.
Based on the 1D MACD also, this sequence resembles the April 20 - June 09 fractal, whose rebound reached the previous High, which is now the Resistance at 172.250. This is the short-term target.
On the long-term you see that the pattern is an Ascending Triangle (since March 2021 and we are close to the Higher Highs Zone. Every hit either on the dashed or top trend-line is a sell opportunity, until the pattern is invalidated.
-------------------------------------------------------------------------------
** Please LIKE 👍, SUBSCRIBE ✅, SHARE 🙌 and COMMENT ✍ if you enjoy this idea! Also share your ideas and charts in the comments section below! This is best way to keep it relevant, support me, keep the content here free and allow the idea to reach as many people as possible. **
-------------------------------------------------------------------------------
You may also TELL ME 🙋♀️🙋♂️ in the comments section which symbol you want me to analyze next and on which time-frame. The one with the most posts will be published tomorrow! 👏🎁
-------------------------------------------------------------------------------
👇 👇 👇 👇 👇 👇
💸💸💸💸💸💸
👇 👇 👇 👇 👇 👇


GBPJPY IS IN A CRUSIAL ZONE ...!I see this pair in a significant zone that has a good potential to pull the price down ...
We can have a sell on it :)

GBPJPY 22/11/2022Details on chart - more buys after strong start to the week anticipating a stronger GBP vs the Yen

GBPJPY .. GEARING O/SGBPJPY faked out a few people today when it continued to rally up... it's not quite all the way O/S yet. I see it pushing to next horizontal resistance and then falling back into the 166.000's. Just waiting on patience and both moves are listed.

GBPJPY 21/11/2022Details on chart - more continuation buys for GBPJPY ahead of PMI release later this week

Selling GBPJPY into a rally.GBPJPY - Intraday - We look to Sell at 167.75 (stop at 168.85)
Although the bulls are in control, the stalling positive momentum indicates a turnaround is possible.
We are trading at overbought extremes.
This is negative for short term sentiment and we look to set shorts at good risk/reward levels for a further correction lower.
Preferred trade is to sell into rallies.
Our profit targets will be 164.60 and 164.00
Resistance: 168.70 / 172.15 / 174.20
Support: 164.00 / 161.10 / 158.70
Risk Disclaimer
The trade ideas beyond this page are for informational purposes only and do not constitute investment advice or a solicitation to trade. This information is provided by Signal Centre, a third-party unaffiliated with OANDA, and is intended for general circulation only. OANDA does not guarantee the accuracy of this information and assumes no responsibilities for the information provided by the third party. The information does not take into account the specific investment objectives, financial situation, or particular needs of any particular person. You should take into account your specific investment objectives, financial situation, and particular needs before making a commitment to trade, including seeking advice from an independent financial adviser regarding the suitability of the investment, under a separate engagement, as you deem fit.
You accept that you assume all risks in independently viewing the contents and selecting a chosen strategy.
Where the research is distributed in Singapore to a person who is not an Accredited Investor, Expert Investor or an Institutional Investor, Oanda Asia Pacific Pte Ltd (“OAP“) accepts legal responsibility for the contents of the report to such persons only to the extent required by law. Singapore customers should contact OAP at 6579 8289 for matters arising from, or in connection with, the information/research distributed.

GBPJPY 18/11/2022Details on chart - looking for more continuation buys ahead of stronger than expected GBP data

GBPJPY: Your Detailed Trading Plan 🇬🇧🇯🇵
Update for GBPJPY.
After a strong bearish wave, the market is correcting within a rising wedge pattern.
To catch the next trend-following move, wait for a bearish breakout of its support.
We need a 4h candle close below that to confirm the breakout.
A bearish continuation will be expected to 164.55 / 163.75 levels then.
Good luck!
❤️If you have any questions, please, ask me in the comment section.
Please, support my work with like, thank you!❤️

GBPJPY - Top In Place!In our last GBPJPY analysis, we thought we'd make another high before reversing. However, it appears that wave 5 was an ending diagonal to complete the entire 5 wave move.
We are now looking for any opportunities to sell GBPJPY. On lower timeframe, we can look for corrections and sell on the breakdown of the corrections.
GBPJPY 8H
Trade Idea:
- Watch for the break of the current correction
- Once correction breaks, enter with stops above the correction
- Targets: 160 (650pips), 158 (850pips)
Goodluck and as always, trade safe!

