GBPUSD Potential DownsidesHey Traders, in today's trading session we are monitoring GBPUSD for a selling opportunity around 1.246 zone, GBPUSD is trading in a downtrend and currently seems to be in a correction phase in which it is approaching the major trend at 1.246 support and resistance zone.
Trade safe, Joe.
Gbp-usd

GBPUSD Below the 1D MA50, expecting more selling.The GBPUSD pair hit our upside target (1.2650) and May 27 2022 High on our last buy signal (see chart below) almost 2 months ago:
The price is now on the 1D MA50 (blue trend-line), having closed a candle below it yesterday for the first time since March 16. This is a bearish continuation signal that is targeting the 1D MA200 (orange trend-line) yet again. Our target is at 1.2100. The 1D RSI can provide additional insight on a potential new buy entry at the bottom.
If however the price closes above the 1D MA50 instead on two straight 1D candles at least, then hedge the position with a buy targeting the June 01 2021 Lower Highs again. If the pair closes a 1D candle above that level, it will be the first time to do so in years, and will be a major buy signal. In that case we will buy and target the 1W MA200 (red trend-line) at 1.2850.
-------------------------------------------------------------------------------
** Please LIKE 👍, FOLLOW ✅, SHARE 🙌 and COMMENT ✍ if you enjoy this idea! Also share your ideas and charts in the comments section below! **
-------------------------------------------------------------------------------
💸💸💸💸💸💸
👇 👇 👇 👇 👇 👇

GBPUSD Downside PotentialHey traders!
For Day 12/100, we're looking at GBPUSD downside risks.
On the technicals side:
- Overall bearish trend
- Created strong resistance + 62% retracement
- Break of HH-HL retracement structure
- Break below 1.244 support
- Now retesting that previous support as resistance
- We're looking to take sells anytime now if it selling signals on H4 and H1 persist
On fundamentals side:
- We have a risk of CPI disappointment on UK side
- Couple of institutions expecting a cooler print than expected
- If that's the case, then aggressive market pricing of next rate hike may be in danger
- USD upside risk of positive rhetoric from debt-ceiling negotiations

GBP USD - FUNDAMENTAL ANALYSISForeign exchange forecasters at ING expect that the US Dollar can maintain a firm tone in the short term. It does, however, expect notable deterioration over the second half of the year which will trigger rate cuts.
The bank expects that yield spreads will move against the US Dollar with the Bank of England resisting any rate cuts.
The bank expects that the Pound to Dollar (GBP/USD) exchange rate will strengthen to 1.33 at the end of 2023.
US Economy to Deteriorate
ING considers that the dollar could hold a firm tone in the short term, especially with the Fed maintaining a hawkish tone, but it questions whether this stance is sustainable.
According to ING; We argue that the sustainability of this kind of dollar trend strongly relies on hard data confirming price pressure remain elevated and the US economic outlook stable.”
It adds; “This may be a story for the near-term, where the dollar can still find some support, but we see the second half of the year as the period where evidence of sharply slowing US economic activity will force large cuts by the Fed and cause a rapid dollar depreciation.”
ING adds; “Our team forecasts that they are enough to curtail the tightening cycle and prompt 100bp of easing in the fourth quarter.”
Yield Spreads will Underpin Pound Dollar (GBP/USD) Exchange Rate
ING is still cautious over the Pound outlook, especially as it considers that market expectations surrounding Bank of England interest rates are too high.
Overall, ING expects that BoE rates have peaked at 4.50% and an eventual reassessment of BoE expectations will be an important headwind for the Pound.
Nevertheless, the bank expects that the BoE will resist rate cuts until at least the second quarter of 2024.
In this context, it expects that BoE rates will be 25 basis points above US Fed Funds rates by the end of 2023 and the differential will widen by 125 basis points by the end of the first quarter of 2023.
ING expects widening rate differentials will be crucial for currency markets with the dollar losing ground and GBP/USD heading above 1.30.
JP Morgan has dropped its negative dollar bias at this stage and does not expect that the US currency will lose traction later in the year.
It adds; “Global growth is shifting at the margins towards a less-bearish USD backdrop. In this context, it adds; “Growth models have neutralized USD shorts.”
JP Morgan forecasts that the Pound US Dollar exchange rate will decline to 1.17 at the end of 2023.
Gbpusd at a interesting levelWatching for more clues to see if i want to long GU.watch..it might jus break lower as well.
**Find out more from my Tradingview Stream this week**
***************************************************************************************
Hello there!
If you like my analysis and it helped you ,do give me a thumbs ups on tradingview! 🙏
And if you would like to show further support for me, you can gift me some coins on tradingview! 😁
Thank you!
Disclaimers:
The analysis shared through this channel are purely for educational and entertainment purposes only. They are by no means professional advice for individual/s to enter trades for investment or trading purposes.
The author/producer of these content shall not and will not be responsible for any form of financial/physical/assets losses incurred from trades executed from the derived conclusion of the individual from these content shared.
Thank you, and please do your due diligence before any putting on any trades!

GBP USD - FUNDAMENTAL ANALYSISThe Pound US Dollar (GBP/USD) exchange rate ended the weekly session on a high, quoted at 1.24453 as currency markets closed.
EUR/USD had also risen on Friday, bolstered by weakness in the US Dollar, sparked by Fed Chair Powell's US banking sector comments, profit-taking and a correction.
The Pound Sterling had been relatively resilient towards the end of the week but struggled to make any significant headway on the major crosses while US currency moves dominated global currency moves.
The US Dollar posted notable gains and the Pound to Dollar (GBP/USD) exchange rate posted steady losses to fresh 3-week lows just below the 1.2400 level.
A rally attempt faltered quickly on Friday with GBP/USD held close to 1.2400.
Dollar Secures Further Gains
ING noted; “GBP/USD is being driven almost entirely by the dollar leg at this stage, with comments by some Bank of England officials yesterday not having a sizeable FX impact.”
The US Dollar (USD) exchange rates were able to make further headway on Thursday with three significant catalysts.
The Philadelphia Fed manufacturing index recovered to -10.4 for May from -31.3 the previous month and stronger than consensus forecasts of -19.8, although new orders continued to contract.
Inflation readings were mixed with a slightly faster rate of increases for prices paid while prices received edged lower at a faster rate.
Companies are less optimistic over the outlook while pricing pressure are expected to be stronger.
Markets noted the risk of sticky inflation pressures.
US Initial jobless claims declined to 242,000 in the latest week from 264,000 previously and significantly below consensus forecasts of 254,000 while continuing claims were marginally lower at 1.80mn from 1.81mn previously.
The data overall eased concerns surrounding a weaker economy.
Dallas Fed President Logan stated that the central bank still has work to do to achieve price stability and she is concerned whether inflation is falling fast enough.
She recognises the risk of tightening too far or too fast, but added that she considers the data at this time does not support skipping a rate hike at the June meeting. Although the data in coming weeks could show it is appropriate to pause, the evidence is not there yet.
There was a repricing of interest rate expectations with Fed Funds rate futures indicating close to a 40% chance that there would be a further rate hike in June.
Markets were also optimistic that the US would reach a deal on raising the debt ceiling. The Treasury will issue a very high volume of bonds if a deal is reached and US yields continued to move higher.
Thierry Wizman, global FX and rates strategist at Macquarie commented; "It's pretty clear that some people were shorting the dollar as a hedge in anticipation of a crisis, but now with all the signals that we will find a resolution in the next few days, people are unwinding these positions so the dollar is strengthening."
ING added; “It's hard to buck the dollar's bullish momentum now, as we also think some substantial squeezing of short USD positions can be behind the move.”
According to MUFG; “if the US rates market continues to price a greater probability of a June hike, then further dollar gains over the short-term are likely.”
Pound Sterling Unmoved by 15-Month High in UK Consumer Confidence
The UK GfK consumer confidence index improved to –27 for May from –30 the previous month. This was in line with consensus forecasts and the strongest reading for 15 months.
Consumers overall were more confident over personal finances and the wider economic outlook and all major sub-indices improved on the month.
Joe Staton, GfK's client strategy director commented; "The overall trajectory this year is positive and might reflect a stronger underlying financial picture across the UK than many would think."
He still noted an element of caution; "But everybody must hold on tight as it could still be a rocky ride out of these tough times."
There are suspicions that the more positive UK outlook has been priced in.
According to UoB; “GBP is likely to weaken further; a clear break of 1.2390 will suggest it could drop to 1.2350, as low as 1.2300.”

GBP USD - FUNDAMENTAL ANALYSISDanske expects that the Bank of England will increase interest rates for a final time in June. It notes that at least one further rate hike is priced in by markets which will limit scope for Pound buying.
It does, however, consider that the Pound is slightly undervalued which will underpin the currency.

GBPUSD Sell Forecast | BOC Gov Macklem Speaks| 18th May 2023Fundamental Backdrop
BOC Gov Macklem Spoke yesterday
Higher-than-expected inflation erodes purchasing power
Uncertainty in the outlook for inflation creates instability and affect the currency's value.
External factors such as Russia's war on Ukraine and disruptions in food prices put pressure on the GBP.
Technical Confluences
Support at 1.24500
Next support at 1.23500
Idea
With the fundamentals weaking the GBP, I'm expecting price to break the support at 1.24500, before heading towards the next support at 1.23500
NOT FINANCIAL ADVICE DISCLAIMER
The trading related ideas posted by OlympusLabs are for educational and informational purposes only and should not be considered as financial advice. Trading in financial markets involves a high degree of risk, and individuals should carefully consider their investment objectives, financial situation, and risk tolerance before making any trading decisions based on our ideas.
We are not a licensed financial advisor or professional, and the information we are providing is based on our personal experience and research. We make no guarantees or promises regarding the accuracy, completeness, or reliability of the information provided, and users should do their own research and analysis before making any trades.
Users should be aware that trading involves significant risk, and there is no guarantee of profit. Any trading strategy may result in losses, and individuals should be prepared to accept those risks.
OlympusLabs and its affiliates are not responsible for any losses or damages that may result from the use of our trading related ideas or the information provided on our platform. Users should seek the advice of a licensed financial advisor or professional if they have any doubts or concerns about their investment strategies.

✨ NEW: GBPUSD ✨ Curve Analysis (8D) ✨SLO @ 141.75 ⏳
TP3 @ 1.3970
TP2 @ 1.3570
TP1 @ 1.2840
BSO @ 1.2540 📈
BLO @ 1.2455 📈
Technically, the analysis for GBPUSD is flat. This currency pair is currently trading at $1.2485, which is still below the Anchor of May 27, 2022 which is @ 1.2667. This suggests that the trend is bearish. However, the bulls broke the Anchor on Cinco De Mayo reaching $1.2680, which is a strong indication of buying opportunities brewing.
The RSI indicator is currently at 45
— The neutral zone.
— This suggests that the market is neither overbought nor oversold.
The MACD indicator
— The neutral zone
— The signal line crossing above the MACD line
— This suggests that the trend could be about to change to bullish.
Here are some of the factors that has and could affect the GBPUSD in the near future:
* The UK's interest rate decision on May 19th.
* The US's non-farm payrolls report on May 6th.
* The US's inflation report on May 11th.
* The UK's GDP report on May 12th.
Please note that this is not financial advice. You should always do your own research before making any investment decisions.

GBPUSD Potential BreakoutHey Traders, in today's trading session we are monitoring GBPUSD for a selling opportunity around 1.24400 zone, GBPUSD is trading in an uptrend and currently seems to be attempting to break it out, if we get dips below 1.244 support area we will be looking for a potential retrace of the trend.
Trade safe, Joe.

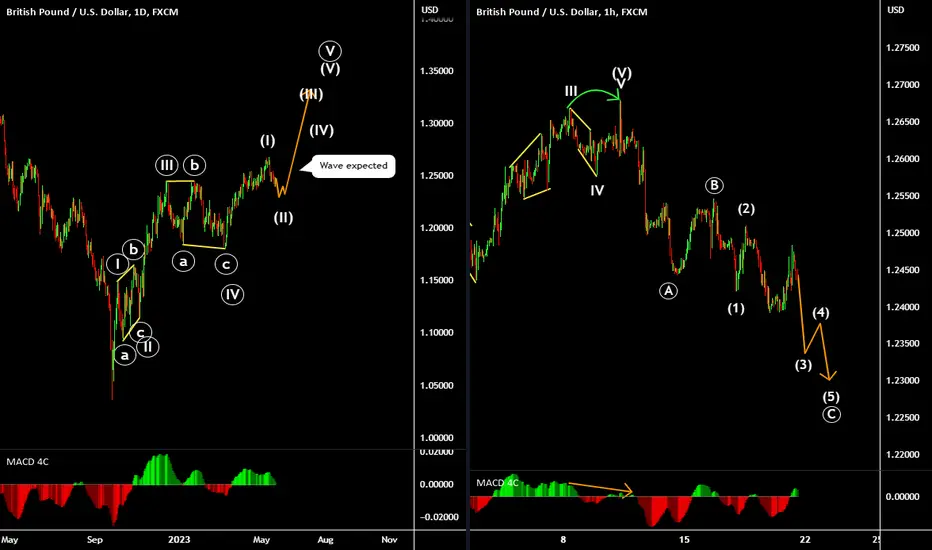
GBPUSD - Short Term Bearish Analysis/ExpectationThis expectation is a framework to look for a potential trading setup; I don't just execute based on these levels, I always wait for confirmations on lower timeframes
This Analysis was done using my complete Strategy which includes:
- Smart Money Concepts
- Multi Timeframe Liquidity and Market Structure
- Supply And Demand
- Auction Theory
- Volume Analysis
- Footprint
- Market Profile
- Volume Profile
- WYCKOFF
- ETC

GBPUSD Sell Forecast | 16th May 2023Fundamental Backdrop
The Claimant Count Change increased from 26.5K to 46.7K
This shows that the number of unemployed people has increased, indicating the weakening economic health
Technical Confluences
Support at 1.24500
Idea
With the fundamentals weaking the GBP, I'm expecting price to head towards the support at 1.24500
NOT FINANCIAL ADVICE DISCLAIMER
The trading related ideas posted by OlympusLabs are for educational and informational purposes only and should not be considered as financial advice. Trading in financial markets involves a high degree of risk, and individuals should carefully consider their investment objectives, financial situation, and risk tolerance before making any trading decisions based on our ideas.
We are not a licensed financial advisor or professional, and the information we are providing is based on our personal experience and research. We make no guarantees or promises regarding the accuracy, completeness, or reliability of the information provided, and users should do their own research and analysis before making any trades.
Users should be aware that trading involves significant risk, and there is no guarantee of profit. Any trading strategy may result in losses, and individuals should be prepared to accept those risks.
OlympusLabs and its affiliates are not responsible for any losses or damages that may result from the use of our trading related ideas or the information provided on our platform. Users should seek the advice of a licensed financial advisor or professional if they have any doubts or concerns about their investment strategies.

✨ NEW: GBPUSD ✨ POST USD NEWS ✨TP3 @ 1.3970
TP2 @ 1.3570
TP1 @ 1.2840
BSO @ 1.2540 ⏳
BLO @ 1.2455 ⏳
00:00 US Dollar Index Analysis
01:15 GBPUSD Curve Analysis
01:44 Entries and Targets
02:16 Sell Order (Pending)
002:53 Boost, Follow, Comment, Join

GBPUSD about to make a big move down?I've been closely monitoring current LTF price action and about to go short on this pair. We've retested last weeks broken dynamic support, and running out of steam right now.
I'm seeing DXY continuing to grow, to at least 105 in the coming week or so. BoE hawkish sentiment, failure to get inflation under control, despite hikes gives the mark no confidence, and therefor a risk off mentality.
My ultimate target is 1.185 area, but will be taking partials on the way down.
Happy trading!

GBP USD - FUNDAMENTAL ANALYSISUK: Labor data to keep Bank of England expectations hawkish
The Bank of England has made it clear that the decision on June rate hike will be underpinned by the two sets of wage and inflation data out before the next meeting. The first of these unemployment and wage numbers will be out on Tuesday, with consensus expectations not suggesting any let up in concerns yet. Expectations are for the unemployment rate in the three months to March to hold steady at 3.8%, employment change to remain at 160k from 169k and headline earnings growth to also remain steady at 5.8% from 5.9%, whilst the ex-bonus metric is seen firming up to 6.8% from 6.6%. Firmer data could bring the expectation for a June rate hike from Bank of England higher from a 69% probability for now and bring the focus also on next CPI release on May 24. EURGBP remains on the verge of a breakout on the downside after trading in a range since the start of the year.

Potential reversal Outlook on GBPUSD:
last week we managed to catch the drop of the pair two times exceeding 150 points.
looking at the pair we se that it has not managed to break above the resistance line. Now we see a reversal pattern rebounding off a key supply zone. Our view is still bearish but we will wait further confirmation before entering any trade.
If price closes below 1.26238 , we will look to enter a short position targeting 1.256. Closing below it could take us to test the demand area between 1.24373 and 1.24489.

GBPUSD Plummets after 12month HighAfter briefly breaking the 12-month high from May 2022 of 1.26670 this week, a wave of selling came in amid a big news week.
The Bank of England (BoE) jacked up the UK Bank Rate to 4.5%, marking the 12th hike in a row. Despite two dissenting votes, the committee expects more tightening if price pressures persist. This could mean the rate peaking around 4.75% by the end of 2023.
BoE expects the UK's inflation to drop sharply from April, but that they are ‘continuing to address the risk of more persistent strength in domestic price and wage setting, as represented by the upward skew in the projected distribution for CPI inflation.’
Meanwhile, BoE's forecast for UK growth is cautiously upbeat, predicting flat growth in the first half of the year and a slight uptick after that.
Over in the States, the US Dollar gained strength headed into the weekend as investors look for safety amid uncertainty. This comes after a regional US bank, PacWest, reported a substantial 10% deposit drop and the Michigan Consumer Sentiment report came in weak.
From a technical perspective, tapping new highs briefly but failing to hold, leading to a sharp sell-off and retracing 2 weeks worth of gains in 2 days could signal a significant shift for the Cable ahead. We've seen a clean downside channel break, and - while a retracement seems likely after such volatile selling into the weekend - lower highs and lower lows could be the blueprint for the days and weeks ahead.

GBPUSD Potential DownsidesHey Traders, in the coming week we are monitoring GBPUSD for a selling opportunity around 1.247 zone, GBPUSD was trading in an uptrend and successfully managed to break it out. currently waiting for a correction to see a potential retrace of the trend from 1.247 support and resistance zone.
Trade safe, Joe.

GBP USD - FUNDAMENTAL ANALYSISPound Sterling briefly dipped after the GDP data on Friday, but still found support on dips with GBP/USD around 1.2530 and GBP/EUR at 1.1475.
The Pound to Dollar (GBP/USD) exchange rate strengthened to 1.2640 in an immediate response to the Bank of England policy decision on Thursday.
There was, however, a notable reversal later in the session as risk appetite deteriorated and the dollar regained territory.
In this environment, GBP/USD posted sharp losses to lows at 1.2500.
Risk conditions will remain an important element. Carl Hammer, chief strategist at SEB commented; "We are entering a more defensive state generally."
Adam Cole, chief currency strategist at RBC Capital Markets, expects choppy trading rather than sustained dollar depreciation. He added; "We're not convinced that this is a sustainable trend yet. We'll have periods when the dollar does well and the dollar does badly."
Mixed GDP data, UK Lags in Global Terms
The latest GDP data recorded a 0.3% decline for March compared with expectations of no change and following no change in February.
The first quarter, however, recorded 0.1% growth and in line with expectations which means that the UK has again avoided a technical recession.
Services declined 0.5% for March after a 0.1% retreat in February with output in consumer-facing services dipping 0.8% on the month.
Production output increased 0.7%for the month with 0.2% growth in construction output.
According to Darren Morgan from the ONS; “The fall in March was driven by widespread decreases across the services sector. Despite the launch of new number plates, cars sales were low by historic standards – continuing the trend seen since the start of the pandemic – with warehousing, distribution and retail also having a poor month.”
He added; “These falls were partially offset by a strong month for manufacturing as well as growth in gas production and distribution and also in construction.”
The ONS estimated that GDP was 0.5% below the pre-pandemic peak and the worst performance within the G10 area.
Pantheon Macroeconomics economist Samuel Tombs noted that the UK is “still at the bottom of the G7 league table”.
Nevertheless, he added; “at least the magnitude of the underperformance is not increasing relative to other countries in Europe, which have faced a similarly enormous energy price shock.”
RSM UK economist Thomas Pugh, commented; “The 0.1% q/q rise in GDP in Q1 means the UK has probably avoided a recession altogether this year.”
Nevertheless, he added; “The big picture is that the economy is still 0.5% below its pre-pandemic level and is unlikely to regain that level until the end of the year at the earliest.”
According to Victoria Scholar, head of investment at interactive investor; “Stubbornly high inflation, negative real wage growth and general cost of living pressures are weighing on the consumer, and in turn the services industry which is typically a key growth engine for the UK economy.”
Tom Stevenson, personal investing director at Fidelity International also pointed to underlying weakness; "With the key services side of the economy continuing to slow in the face of higher borrowing costs and rising prices, it still feels like we’re walking through treacle."
He added; "With inflation still in double digits, it feels depressingly like a re-run of 1970s stagflation."
KPMG economist Yael Selfin also expressed caution; "While recession is probably no longer on the cards, vulnerabilities resulting from higher borrowing costs and tighter credit are likely to dampen business and household activity this year."
Ben Jones, CBI lead economist Ben Jones was slightly more positive; “The UK economy is proving more resilient than widely expected and it looks increasingly likely that the UK will avoid a recession this year. Underlying momentum appears to be firming, with our surveys showing growth expectations for the quarter ahead creeping back into positive territory for the first time in a year.
ING summarised the situation; “Strip out all of the volatility though, and the economy seems to be reasonably stagnant.”
BoE Debate will Continue
The Bank of England increased interest rates by 25 basis points to 4.50% at the latest policy meeting which was in line with consensus forecasts. The 7-2 vote for the move was also expected as Tenreyro and Dhingra again voted against any rate hike.
The bank now expects positive GDP growth in 2023 and 2024 with no quarters of negative growth. Overall, growth forecasts were revised higher by the largest extent since the bank gained independence in 1997.
The bank also raised inflation forecasts with an important impact from the strong increase in food prices. The CPI inflation rate is now forecast at close to 5.0% at the end of 2023 from 4.0% previously.
According to ING; While we don’t exclude one final June hike, our base case is that we have reached the peak of the BoE tightening cycle as inflation will start to rapidly decelerate this year.”
ING added; “For now, however, there aren’t many convincing reasons to call for GBP underperformance against its main peers in the near term.”
Commerzbank considers that expectations are liable to fluctuate; “In the end future data will be decisive for the BoE’s next rate decision though, in addition to the April inflation data the May data will also be published.”
It added; “If a swift fall were to become obvious here, as the BoE expects, it is likely to refrain from further rate hikes and that would put pressure on Sterling. However, the risk that the BoE will do more has certainly increased since yesterday.”
According to Credit Agricole; “The comments suggested that the BoE outlook whilst not as dire as in February has not improved significantly from the stagflationary scenario that the MPC has been predicting since May 2022.”
UoB expects further GBP/USD losses; “The burst in downward momentum indicates that the downside risk is building quickly. From here, we expect GBP to drop to 1.2445; if it can break below this major support level, it could trigger a rapid decline to 1.2390.”

GBP/USD -11/5/2023-• Despite hawkish message delivered by the BOE today, recent USD strength is putting pressure on the pound and all the majors
• We have a couple of Dojis in the recent past sessions which showed a slowing bullish momentum followed by a big bearish candlestick today
• Bears are testing the 20 SMA which has been supporting the prices for a while
• While there is a weakness prevailing, longer term trend is still bullish as long as the Pound is trading above the ascending trend line
• One critical support level is very important for the bulls to defend which is in the mid 1.24s (1.2450-1.2460) which is the previous December 2022 - January 2023 resistance and the trend line support
• Bears will do their best to secure several daily closes below the 20 SMA and the supporting trend line
• From a risk reward perspective, bulls might wait for a re-test of the trend line before getting in the market again
Traders, if you like this idea please comment and like ✅
Here to answer all your questions,
Good luck

GBPUSD Potential bullish reversal coming?Fundamental Analysis
GBP/USD market movers
The governor of the Bank of England, Andrew Bailey, recently spoke about how the inflation readings for April are expected to show a significant drop as the effects of higher fuel and food prices from last year are no longer in the equation. Although there are signs that inflation is easing, Bailey also mentioned that the secondary effects of high inflation are still present and that there are potential risks for inflation in the future.
Bank of England's recent policy meeting went as expected with no surprises. The BoE decided to raise interest rates by 25 basis points to 4.50%, which was the same decision made at the previous meeting. This decision was voted on by a 7-2 majority.
In the UK, inflation is currently at 10.1%, which is more than double the 4.9% reading in the US. The core inflation rates in both countries are closer, with the UK at 6.2% and the US at 5.5%. However, this suggests that the UK will likely continue to raise interest rates after the Federal Reserve (Fed) has stopped, which may benefit the Pound Sterling over the US Dollar as global investors tend to prefer currencies with higher interest rates to invest their money.
Looking at the US Dollar and the potential risks associated with the US debt ceiling default. US Treasury Secretary Janet Yellen recently warned that a failure to raise the debt ceiling could result in an "economic and financial catastrophe." This could have an impact on the US Dollar moving forward.
The US Bureau of Labor Statistics released the Producer Price Index (PPI) for April, with both the annual headline and core figures coming in slightly below expectations. Additionally, the US Department of Labor's weekly Initial Jobless Claims were higher than expected, with 264K new first-time unemployment claims filed.
Technical Analysis
From a technical perspective, from our point of view, GBP/USD remains in a long-term uptrend, advantaging long over short holders even if price was to break below the TL, which would means that the current correction will be longer and deeper before breaking the Highs of May 2022, please see chart analysis above for details.

GBPUSD Potential DownsidesHey Traders, in today's trading session we are monitoring GBPUSD for a selling opportunity around 1.26000 zone, GBPUSD was trading in an uptrend and successfully managed to break it out. Currently GBPUSD seems to be in a correction phase in which it is approaching the retrace zone at 1.26 support and resistance zone.
Trade safe, Joe.
