Gbp-usd

GBPUSD H4: Bearish outlook seen, further downside below 1.2170On the H4 time frame, prices are facing bearish pressure from the resistance zone at 1.2170, in line with the 50% Fibonacci retracement and 61.8% Fibonacci extension where we could see a further drop below this zone to the support zone at 1.1920. This support zone coincides with the graphical area and 100% Fibonacci extension. Failure to hold below the 1.2170 resistance zone could see prices push higher to the next resistance zone at 1.2280. Prices are holding below the Ichimoku cloud as well, supporting the bearish bias.

GBPUSD SELL BIAS (BEARISH!)Hello all!
In the case of GU, pair moved sideways like many others..
On HTF i am BEARISH, so on LTF I've marked a POI that i will monitor closely to take a SHORT position from!
Let's see!
Take care!

Possible breakdown below 1.20GBP is above 1.20. That is why I obstain from shorting it now. Its risky to short it for now. It is very strong support level. But price poked below it a few times (indicates weakness and future breakdown. The more price pokes through support the weaker it gets).
Trendline breakdown with a strong bearish candle indicates move lower. So do also lower low and lower highs.
Price might retest monthly close before it starts trending down.
IF price makes higher high on daily, it will end at 1.30.
FOR EDUCATIONAL PURPOSES ONLY.

GBP/USD forecast ahead of key inflation data It is prudent to examine the strength of the US dollar against the pound in the lead up to two very important inflation data reports. First is the US inflation data due on Wednesday morning at 2.30 am (NZDT). And second is the UK’s inflation data on Wednesday night at 8.00 pm (NZDT). The annual US inflation rate to January 2023 is expected to fall to about 6.2% from 6.5% in December of 2022, and in doing so will continue the decline of consumer prices for a seventh straight month. However, a smaller than expected decline in the US inflation data might shake a little more bulls off the GBP/USD frontline, after it dropped from 1.2400 to below 1.2030 last week, its weakest level since January 6, and breaking through its upward trendline. The decline in UK inflation is expected to fall from 10.55 to 10.2%, but it has been beating expectations and falling more than forecast in its previous 2 releases, so another beat might be on the cards and putting the GBP back on the front foot.
GBP/USD attempted to bounce back last Thursday after establishing support at 1.2015 but failed to close above the 200-EMA. This failed move meant the GBP/USD ended the week with a big red candle, engulfing the previous bullish candle that tried to move past the 200-EMA. The rejection at the 200-EMA means there is resistance at around 1.2121, which could be considered a lower high in the downtrend.
Stronger-than-expected US inflation or weaker-than-expected UK inflation could see GBP/USD breaking below 1.2018, with 1.1900 a potential target for the downward move. On the opposite side of the trade, GBP/USD may rise to 1.2189 or even 1.2318 from a swing perspective. Look for a closing above the 200-EMA and the 1.2121 resistance area for this to happen.

GBP USD Sell Idea Weekly AnalysisHello Traders !
Thank you for taking the time to check out my trading idea.
GBP/USD is in a Bearish orderflow, and there is also a recent imbalance of sell orders in the market that seems to have been filled. From then, price reacted in a way that indicates more red incoming.
First TP for current bearish trend is 1.1875
Please like, and share your comments as they help me grow as a trader on this journey as well.
Thanks .

GBPUSD | DECRYPTERS | POUNDHi people Welcome to Team Decrypters
We are looking For GBPUSD to sell /Short for short term As a Retracement

GBP/USD RANGE PLAYGBP/USD looks good to hit the target within this range it's currently in. Good bounce-off Demand/support. Cut trade and short below if the price starts to break down and fails to hold.

GBPUSD LongLong position on GBPUSD, Reverse head & shoulders present as well as a pennant on 15m which broke and held giving us more confirmation.

GBPUSD a short opportunity 🦐In technical analysis, a distribution block is often viewed as a sign that the market is losing steam after a strong bullish trend. This can be an indication that the market is starting to correct itself, and that the trend may be reversing.
In the case of GBP/USD on the 4 hour timeframe, the price breaks below the distribution block and If then will retests the previous support, which has now become resistance, it could be a sign to consider a short order according to Plancton's strategy. This is because the retest of the former support level at a lower price could indicate that the market is not able to sustain its previous bullish trend and that the bears are now in control.

GBPUSD H4: Bearish outlook seen, reversal below 1.2170On the H4 time frame, prices are approaching the resistance zone at 1.2170, in line with the Fibonacci confluence levels where we could see a reversal below this level. The 1.2170 resistance zone coincides with the graphical resistance zone, 38.2% Fibonacci retracement and 100% Fibonacci extension level. Prices are facing bearish pressure from the Ichimoku cloud as well.

GBPUSDJPY i do expect GBPUSD to rise through out this end of this week. i set my GU TP at 1.22600
SL 1.20100

GBPUSD Breakout and Potential RetraceHey traders, in today's trading session we are monitoring GBPUSD for a selling opportunity around 1.21 zone, once we will receive any bearish confirmation the trade will be executed.
Trade safe, Joe.

GBP/USD faces further weakness near termAs described in our last idea on GBP/USD a Double top occurred after the release of economic news.
Economist Lee Sue Ann and market strategist Quek Ser Leang at UOB Group believe that further declines in the GBP/USD exchange rate are still likely to occur over the coming weeks.
Key Quotes Day and Night: Even though we anticipated a decline in the value of the pound last Friday, we maintained that "1.2120 is unlikely to be in danger." GBP, however, lost more ground than was anticipated, falling as low as 1.2047. The slide has room to go down to the support of 1.2000 even if it is plainly oversold before stabilization is probable. The next support level at 1.1950 is probably out of reach right now. Resistance is at 1.2100, but stabilization of the GBP's weakening would only be indicated by a breach of 1.2150.

j.Hejazi | GBP/USD Double Top with Bearish SignalsThe GBP/USD currency pair has formed a double top pattern with a divergence on the MACD indicator, which has been confirmed. The price is currently heading towards the neckline, which is the key level of 1.18550. At this level, there are several factors that may provide support, including the 200-day moving average, the ascending weekly trendline, and the 23.60 Fibonacci level.
There is a high likelihood that the price may bounce off this zone of support, but if it breaks through 1.18550, it will be considered a sell signal.
Follow My Telegram Channel for Up-to-Date Buy/Sell Signals Based on This Analysis “frx_experts”
-------------------------------------------------------------------------
Let me know your thoughts in the comments, and show your support by liking the idea.
Please follow if you're interested in more ideas like this.
Your support is greatly appreciated!

Gbpusd bias to shortWith the potential reversal on usd...gbp should have follow through to go lower or pullback then go lower...
likewise for other pairs but looks at Gbpusd /nzdusd /audusd would be the weaker ones...

GBPUSD Running as expectedShort looking good for this pair.
I'm expecting a retrace back-up to the ascending dynamic trendline, then down to the previous low, retrace and then if we can break the neckline of the previous low a drop down to at least 1.165, but with the H&S I expect a bigger move, probably down to 1.137 area.

GBPUSD SELL BIAS (BEARISH?!)Hello all!
GBPUSD analysed for you!
I have summarised the potential moves to the downside, as of now the pair is bearish, BUT there is heavy liquidity sitting above as EQH.
In the case of the bearish move, it could be a liquidity grab, but we can only confirm once it retests the strong demand marked.
Enjoy!

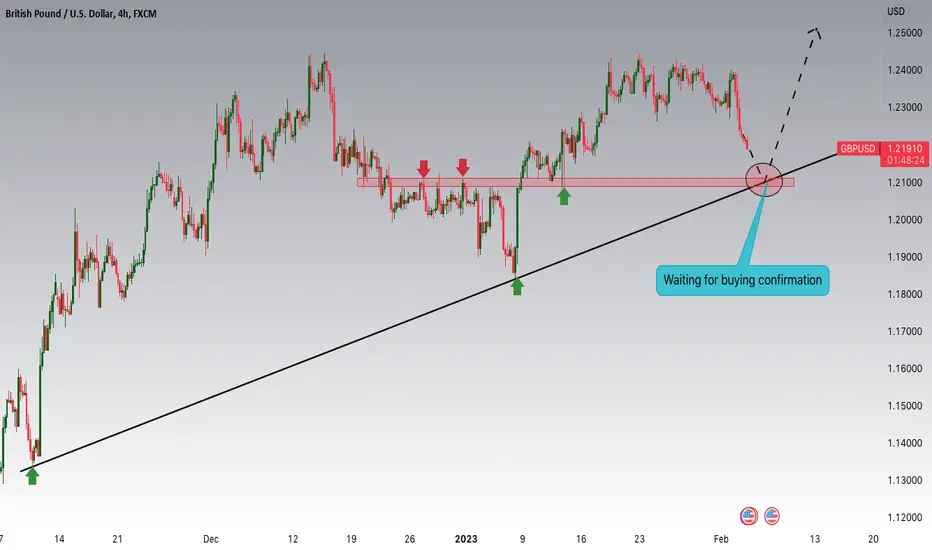
GBPUSD Potential UpsidesHey Traders, in today's trading session we are monitoring GBPUSD for a buying opportunity around 1.21 zone, once we will receive any bullish confirmation the trade will be executed.
Trade safe, Joe.
GBPUSD Potential for Bearish Drop | 3rd February 2023Looking at the H4 chart, my overall bias for GBPUSD is bearish due to the current price being below the Ichimoku cloud, indicating a bearish market.
Looking for a pullback sell entry at 1.22920, where the overlap resistance is. Stop loss will be at 1.24012, where the recent high is. Take profit will be at 1.20997, where the overlap support an 61.8% Fibonacci line is.
Any opinions, news, research, analyses, prices, other information, or links to third-party sites contained on this website are provided on an "as-is" basis, as general market commentary, and do not constitute investment advice. The market commentary has not been prepared in accordance with legal requirements designed to promote the independence of investment research, and it is therefore not subject to any prohibition on dealing ahead of dissemination. Although this commentary is not produced by an independent source, FXCM takes all sufficient steps to eliminate or prevent any conflicts of interest arising out of the production and dissemination of this communication. The employees of FXCM commit to acting in the clients' best interests and represent their views without misleading, deceiving, or otherwise impairing the clients' ability to make informed investment decisions. For more information about the FXCM's internal organizational and administrative arrangements for the prevention of conflicts, please refer to the Firms' Managing Conflicts Policy. Please ensure that you read and understand our Full Disclaimer and Liability provision concerning the foregoing Information, which can be accessed on the website.

GBPUSD Double Top rejection but Support cluster below.The GBPUSD pair is pulling back significantly after a Double Top rejection at 1.2455. The first Support offered is within the 1D MA50 (blue trend-line) and the bottom of the Channel Up is has been trading on since October.
If that holds, we'll take it as a short-term buy back to the 1.2455 Double Top Resistance. A closing above should further extend the rally to the 1.2675 May 27 High. However a break below the Channel Up, will be a sell break-out signal, targeting the 1D MA200 (orange trend-line) with the best long-term buy beyond that level being on the 1.1845 Support.
In both cases, we will only buy any further if the June 01 2021 Lower Highs - 1W MA200 (red trend-line) Resistance Cluster breaks.
-------------------------------------------------------------------------------
** Please LIKE 👍, FOLLOW ✅, SHARE 🙌 and COMMENT ✍ if you enjoy this idea! Also share your ideas and charts in the comments section below! **
-------------------------------------------------------------------------------
💸💸💸💸💸💸
👇 👇 👇 👇 👇 👇

GBP/USD faces rejection near 1.2400 - Double Top ?GBP/USD has lost its bullish vigor after Wednesday's recovery toward 1.2400. Prior to the Bank of England's (BOE) policy announcements, investors refrain from placing bets on future Pound Sterling strength, and the near-term technical outlook indicates a lack of buyer demand.
The gains in GBP/USD remain modest, especially when compared to EUR/USD, notwithstanding the intense selling pressure surrounding the US Dollar late on Wednesday.
The decision to hike the policy rate by 25 basis points was made, and FOMC Chairman Jerome Powell maintained that more rate rises will be appropriate. However, his admission of the disinflation in goods led to a decline in the US dollar. Powell also acknowledged that a quicker-than-anticipated decrease in inflation will be reflected in upcoming policy choices, which raises the prospect of a policy change later in the year.
The BOE is anticipated to increase its policy rate by 50 basis points to 4% from 3.5% on Thursday. Tenreyro and Dhingra, two BOE Monetary Policy Committee (MPC) members, voted in December to maintain rates at 3%.

GBPUSD can move higher? 🦐GBP/USD currency pair on the 4-hour timeframe see the formation of higher highs and higher lows, followed by a distribution pattern at the recent high.
This could indicate that the uptrend is still intact and that the market is undergoing a period of consolidation before potentially continuing its upward movement.
It appears that the pair is currently trading within a range between the recent highs and the 0.618 Fibonacci level, which is considered a key support level. The presence of daily support also suggests that there is a potential for the price to hold at these levels and continue to trade within the established range.
Technical analysis suggests that traders watch for a break above the recent highs according to Plancton's strategy to confirm the continuation of the bullish trend.
