Bearish reversal off pullback resistance?GBP/CAD is reacting off the pivot which is a pullback resistance and could drop to the 1st support which acts as a pullback support.
Pivot: 1.8425
1st Support: 1.8275
1st Resistance: 1.8502
Risk Warning:
Trading Forex and CFDs carries a high level of risk to your capital and you should only trade with money you can afford to lose. Trading Forex and CFDs may not be suitable for all investors, so please ensure that you fully understand the risks involved and seek independent advice if necessary.
Disclaimer:
The above opinions given constitute general market commentary, and do not constitute the opinion or advice of IC Markets or any form of personal or investment advice.
Any opinions, news, research, analyses, prices, other information, or links to third-party sites contained on this website are provided on an "as-is" basis, are intended only to be informative, is not an advice nor a recommendation, nor research, or a record of our trading prices, or an offer of, or solicitation for a transaction in any financial instrument and thus should not be treated as such. The information provided does not involve any specific investment objectives, financial situation and needs of any specific person who may receive it. Please be aware, that past performance is not a reliable indicator of future performance and/or results. Past Performance or Forward-looking scenarios based upon the reasonable beliefs of the third-party provider are not a guarantee of future performance. Actual results may differ materially from those anticipated in forward-looking or past performance statements. IC Markets makes no representation or warranty and assumes no liability as to the accuracy or completeness of the information provided, nor any loss arising from any investment based on a recommendation, forecast or any information supplied by any third-party.
GBP

Potential bearish drop?EUR/GBP has reacted off the pivot and could drop to the 1st support which acts as a pullback support.
Pivot: 0.8526
1st Support: 0.8447
1st Resistance: 0.8572
Risk Warning:
Trading Forex and CFDs carries a high level of risk to your capital and you should only trade with money you can afford to lose. Trading Forex and CFDs may not be suitable for all investors, so please ensure that you fully understand the risks involved and seek independent advice if necessary.
Disclaimer:
The above opinions given constitute general market commentary, and do not constitute the opinion or advice of IC Markets or any form of personal or investment advice.
Any opinions, news, research, analyses, prices, other information, or links to third-party sites contained on this website are provided on an "as-is" basis, are intended only to be informative, is not an advice nor a recommendation, nor research, or a record of our trading prices, or an offer of, or solicitation for a transaction in any financial instrument and thus should not be treated as such. The information provided does not involve any specific investment objectives, financial situation and needs of any specific person who may receive it. Please be aware, that past performance is not a reliable indicator of future performance and/or results. Past Performance or Forward-looking scenarios based upon the reasonable beliefs of the third-party provider are not a guarantee of future performance. Actual results may differ materially from those anticipated in forward-looking or past performance statements. IC Markets makes no representation or warranty and assumes no liability as to the accuracy or completeness of the information provided, nor any loss arising from any investment based on a recommendation, forecast or any information supplied by any third-party.

Falling towards pullback support?GBP/CHF is falling towards the pivot which has been identified as a pullback support and could bounce to the pullback resistance.
Pivot: 1.0889
1st Support: 1.0784
1st Resistance: 1.1075
Risk Warning:
Trading Forex and CFDs carries a high level of risk to your capital and you should only trade with money you can afford to lose. Trading Forex and CFDs may not be suitable for all investors, so please ensure that you fully understand the risks involved and seek independent advice if necessary.
Disclaimer:
The above opinions given constitute general market commentary, and do not constitute the opinion or advice of IC Markets or any form of personal or investment advice.
Any opinions, news, research, analyses, prices, other information, or links to third-party sites contained on this website are provided on an "as-is" basis, are intended only to be informative, is not an advice nor a recommendation, nor research, or a record of our trading prices, or an offer of, or solicitation for a transaction in any financial instrument and thus should not be treated as such. The information provided does not involve any specific investment objectives, financial situation and needs of any specific person who may receive it. Please be aware, that past performance is not a reliable indicator of future performance and/or results. Past Performance or Forward-looking scenarios based upon the reasonable beliefs of the third-party provider are not a guarantee of future performance. Actual results may differ materially from those anticipated in forward-looking or past performance statements. IC Markets makes no representation or warranty and assumes no liability as to the accuracy or completeness of the information provided, nor any loss arising from any investment based on a recommendation, forecast or any information supplied by any third-party.

Bullish bounce?GBP/CAD is reacting off the pivot which is a pullback support and could rise to the 1st resistance.
Pivot: 1.8323
1st Support: 1.8275
1st Resistance: 1.8502
Risk Warning:
Trading Forex and CFDs carries a high level of risk to your capital and you should only trade with money you can afford to lose. Trading Forex and CFDs may not be suitable for all investors, so please ensure that you fully understand the risks involved and seek independent advice if necessary.
Disclaimer:
The above opinions given constitute general market commentary, and do not constitute the opinion or advice of IC Markets or any form of personal or investment advice.
Any opinions, news, research, analyses, prices, other information, or links to third-party sites contained on this website are provided on an "as-is" basis, are intended only to be informative, is not an advice nor a recommendation, nor research, or a record of our trading prices, or an offer of, or solicitation for a transaction in any financial instrument and thus should not be treated as such. The information provided does not involve any specific investment objectives, financial situation and needs of any specific person who may receive it. Please be aware, that past performance is not a reliable indicator of future performance and/or results. Past Performance or Forward-looking scenarios based upon the reasonable beliefs of the third-party provider are not a guarantee of future performance. Actual results may differ materially from those anticipated in forward-looking or past performance statements. IC Markets makes no representation or warranty and assumes no liability as to the accuracy or completeness of the information provided, nor any loss arising from any investment based on a recommendation, forecast or any information supplied by any third-party.

GBP/NZD Long Setup🔹 GBP/NZD Long Setup
Price tapped into a clear demand zone and showed signs of rejection and potential reversal. I'm anticipating a bullish move toward the next resistance level.
📍 Entry Zone: Around 2.2440
🛑 Stop Loss: 2.2396
🎯 Target (TP): 2.2619
💡 Risk-Reward Ratio: Over 1:4

Bullish bounce?GBP/USD has bounced off the support level which is a pullback support that lines up wit the 71% Fibonacci retracement and could rise from this level to our take profit.
Entry: 1.3321
Why we like it:
There is a pullback support level that lines up with the 71% Fibonacci retracement.
Stop loss: 1.3281
Why we like it:
There is a pullback support level.
Take profit: 1.3385
Why we like it:
There is a pullback resistance level that is slightly above the 50% Fibonacci retracement.
Enjoying your TradingView experience? Review us!
Please be advised that the information presented on TradingView is provided to Vantage (‘Vantage Global Limited’, ‘we’) by a third-party provider (‘Everest Fortune Group’). Please be reminded that you are solely responsible for the trading decisions on your account. There is a very high degree of risk involved in trading. Any information and/or content is intended entirely for research, educational and informational purposes only and does not constitute investment or consultation advice or investment strategy. The information is not tailored to the investment needs of any specific person and therefore does not involve a consideration of any of the investment objectives, financial situation or needs of any viewer that may receive it. Kindly also note that past performance is not a reliable indicator of future results. Actual results may differ materially from those anticipated in forward-looking or past performance statements. We assume no liability as to the accuracy or completeness of any of the information and/or content provided herein and the Company cannot be held responsible for any omission, mistake nor for any loss or damage including without limitation to any loss of profit which may arise from reliance on any information supplied by Everest Fortune Group.

Bearish drop off overlap resistance?GBP/AUD has reacted off the pivot and could potentially drop to the 1st support.
Pivot: 2.1038
1st Support: 2.0639
1st Resistance: 2.1260
Risk Warning:
Trading Forex and CFDs carries a high level of risk to your capital and you should only trade with money you can afford to lose. Trading Forex and CFDs may not be suitable for all investors, so please ensure that you fully understand the risks involved and seek independent advice if necessary.
Disclaimer:
The above opinions given constitute general market commentary, and do not constitute the opinion or advice of IC Markets or any form of personal or investment advice.
Any opinions, news, research, analyses, prices, other information, or links to third-party sites contained on this website are provided on an "as-is" basis, are intended only to be informative, is not an advice nor a recommendation, nor research, or a record of our trading prices, or an offer of, or solicitation for a transaction in any financial instrument and thus should not be treated as such. The information provided does not involve any specific investment objectives, financial situation and needs of any specific person who may receive it. Please be aware, that past performance is not a reliable indicator of future performance and/or results. Past Performance or Forward-looking scenarios based upon the reasonable beliefs of the third-party provider are not a guarantee of future performance. Actual results may differ materially from those anticipated in forward-looking or past performance statements. IC Markets makes no representation or warranty and assumes no liability as to the accuracy or completeness of the information provided, nor any loss arising from any investment based on a recommendation, forecast or any information supplied by any third-party.

Bullish bounce?The Cable (GBP/USD) is falling towards the pivot and could bounce to the 1st resistance.
Pivot: 1.3338
1st Support: 1.3276
1st Resistance: 1.3442
Risk Warning:
Trading Forex and CFDs carries a high level of risk to your capital and you should only trade with money you can afford to lose. Trading Forex and CFDs may not be suitable for all investors, so please ensure that you fully understand the risks involved and seek independent advice if necessary.
Disclaimer:
The above opinions given constitute general market commentary, and do not constitute the opinion or advice of IC Markets or any form of personal or investment advice.
Any opinions, news, research, analyses, prices, other information, or links to third-party sites contained on this website are provided on an "as-is" basis, are intended only to be informative, is not an advice nor a recommendation, nor research, or a record of our trading prices, or an offer of, or solicitation for a transaction in any financial instrument and thus should not be treated as such. The information provided does not involve any specific investment objectives, financial situation and needs of any specific person who may receive it. Please be aware, that past performance is not a reliable indicator of future performance and/or results. Past Performance or Forward-looking scenarios based upon the reasonable beliefs of the third-party provider are not a guarantee of future performance. Actual results may differ materially from those anticipated in forward-looking or past performance statements. IC Markets makes no representation or warranty and assumes no liability as to the accuracy or completeness of the information provided, nor any loss arising from any investment based on a recommendation, forecast or any information supplied by any third-party.

GBPAUD / 1H / BULLHey There;
My GBPAUD target level is 2.10269
My target may come a bit late because this trade is a swing trade.
I would appreciate it very much if you do not miss your likes within the framework of Respect for Labor Thank you very much in advance

GBP/JPY Bullish Flag (29.04.2025)The GBP/JPY pair on the M30 timeframe presents a Potential Buying Opportunity due to a recent Formation of a Breakout Pattern. This suggests a shift in momentum towards the upside and a higher likelihood of further advances in the coming hours.
Possible Long Trade:
Entry: Consider Entering A Long Position around Trendline Of The Pattern.
Target Levels:
1st Resistance – 192.18
2nd Resistance – 192.70
🎁 Please hit the like button and
🎁 Leave a comment to support for My Post !
Your likes and comments are incredibly motivating and will encourage me to share more analysis with you.
Best Regards, KABHI_TA_TRADING
Thank you.

GBPNZD - Marco Trend Still Up!Hello TradingView Family / Fellow Traders. This is Richard, also known as theSignalyst.
📈GBPNZD has been overall bullish from a macro perspective trading within the rising channels in blue and orange.
Moreover, the green zone is a strong support, structure and demand.
🏹 Thus, the highlighted blue circle is a strong area to look for buy setups as it is the intersection of support and lower orange/blue trendlines acting non-horizontal support.
📚 As per my trading style:
As #GBPNZD approaches the blue circle zone, I will be looking for bullish reversal setups (like a double bottom pattern, trendline break , and so on...)
📚 Always follow your trading plan regarding entry, risk management, and trade management.
Good luck!
All Strategies Are Good; If Managed Properly!
~Rich
Disclosure: I am part of Trade Nation's Influencer program and receive a monthly fee for using their TradingView charts in my analysis.

Bearish drop off pullback resistance?GBP/JPY has reacted off the pivot and could drop to the 38.2% Fibonacci support.
Pivot: 191.76
1st Support: 189.40
1st Resistance: 193.84
Risk Warning:
Trading Forex and CFDs carries a high level of risk to your capital and you should only trade with money you can afford to lose. Trading Forex and CFDs may not be suitable for all investors, so please ensure that you fully understand the risks involved and seek independent advice if necessary.
Disclaimer:
The above opinions given constitute general market commentary, and do not constitute the opinion or advice of IC Markets or any form of personal or investment advice.
Any opinions, news, research, analyses, prices, other information, or links to third-party sites contained on this website are provided on an "as-is" basis, are intended only to be informative, is not an advice nor a recommendation, nor research, or a record of our trading prices, or an offer of, or solicitation for a transaction in any financial instrument and thus should not be treated as such. The information provided does not involve any specific investment objectives, financial situation and needs of any specific person who may receive it. Please be aware, that past performance is not a reliable indicator of future performance and/or results. Past Performance or Forward-looking scenarios based upon the reasonable beliefs of the third-party provider are not a guarantee of future performance. Actual results may differ materially from those anticipated in forward-looking or past performance statements. IC Markets makes no representation or warranty and assumes no liability as to the accuracy or completeness of the information provided, nor any loss arising from any investment based on a recommendation, forecast or any information supplied by any third-party.

Bitcoin Analysis Anticipated Bullish Rebound Toward $95,000! This 15-minute Bitcoin (BTC/USD) recent price action around key support and resistance zones. After a sharp dip to the lower green support area (~$92,500), the price is showing signs of a bullish reversal. The forecasted trajectory (highlighted in yellow) anticipates a corrective move before resuming an upward climb toward the $95,000 resistance target. Previous consolidation phases and a breakdown from a rising wedge pattern are also noted, suggesting a technical recovery is underway. Traders are watching for confirmation of this bullish setup.

Potentially bullish rise?GBP/NZD has reacted off the support level which is a pullback support and could rise from this level to our take profit.
Entry: 2.2393
Why we like it:
There is a pullback support level.
Stop loss: 2.2190
Why we like it:
There is a pullback support level.
Take profit: 2.2722
Why we like it:
There is a pullback resistance level that aligns with the 50% Fibonacci retracement.
Enjoying your TradingView experience? Review us!
Please be advised that the information presented on TradingView is provided to Vantage (‘Vantage Global Limited’, ‘we’) by a third-party provider (‘Everest Fortune Group’). Please be reminded that you are solely responsible for the trading decisions on your account. There is a very high degree of risk involved in trading. Any information and/or content is intended entirely for research, educational and informational purposes only and does not constitute investment or consultation advice or investment strategy. The information is not tailored to the investment needs of any specific person and therefore does not involve a consideration of any of the investment objectives, financial situation or needs of any viewer that may receive it. Kindly also note that past performance is not a reliable indicator of future results. Actual results may differ materially from those anticipated in forward-looking or past performance statements. We assume no liability as to the accuracy or completeness of any of the information and/or content provided herein and the Company cannot be held responsible for any omission, mistake nor for any loss or damage including without limitation to any loss of profit which may arise from reliance on any information supplied by Everest Fortune Group.

GBPNZD | 4H | SWING TRADEHey there my dear friends;
SIGNAL ALERT
BUY GBPNZD / 2,23220
🟢TP1: 2,23952
🟢TP2: 2,24909
🟢TP3: 2,27946
🔴SL: 2,20905
Enter low lot because it is high risk 🔽
RR / 2,00
Dear friends, your likes are always my biggest source of motivation for me to share analysis. For this reason, I would like to ask each and every one of my followers; please do not miss your likes.
I sincerely thank everyone who supports me with their likes.

GBPCAD - BULLISH MOVEHello Traders !
The GBPCAD broke the resistance level (1.83706 - 1.84150).
This key level becomes new support!
So, I expect a bullish move🚀
Let's wait for a retest...
____________
TARGET: 1.85720🎯

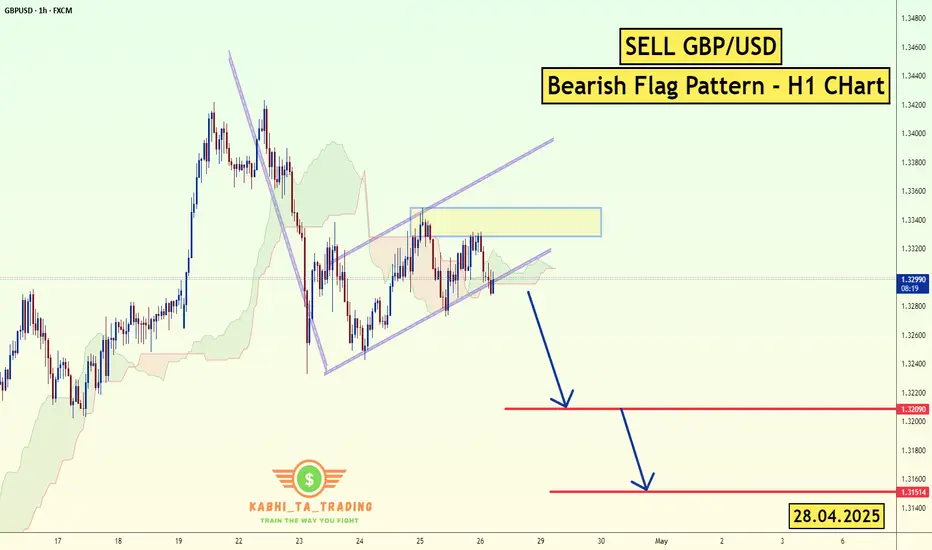
GBP/USD - H1 - Bearish Flag (28.04.2025)FX:GBPUSD The GBP/USD Pair on the H1 timeframe presents a Potential Selling Opportunity due to a recent Formation of a Bearish Flag Pattern. This suggests a shift in momentum towards the downside in the coming hours.
Possible Short Trade:
Entry: Consider Entering A Short Position around Trendline Of The Pattern.
Target Levels:
1st Support – 1.3209
2nd Support – 1.3151
🎁 Please hit the like button and
🎁 Leave a comment to support for My Post !
Your likes and comments are incredibly motivating and will encourage me to share more analysis with you.
Best Regards, KABHI_TA_TRADING
Thank you.
Fundamental Update :
on Monday as the trade tensions between the U.S. and China provided some relief to investors, while a stronger dollar further weighed on prices.
The U.S. dollar TVC:DXY rose 0.2% against a basket of currencies, making bullion more expensive for overseas buyers. TVC:DJI SP:SPX NASDAQ:IXIC also rising .
GBPUSD SELL NOW BUY LATER!Our previous idea played out perfectly once again! Currently, GBPUSD is showing signs of a pullback within a mini bearish trend. However, I still believe the overall structure remains bullish. I'll be watching for buying opportunities once this pullback completes. Stay patient and wait for confirmation!

Bulllish continuation for the Cable?GBP/USD is fallling towards the pivot and could bounce to the pullback resistance.
Pivot: 1.3110
1st Support: 1.3005
1st Resistance: 1.3415
Risk Warning:
Trading Forex and CFDs carries a high level of risk to your capital and you should only trade with money you can afford to lose. Trading Forex and CFDs may not be suitable for all investors, so please ensure that you fully understand the risks involved and seek independent advice if necessary.
Disclaimer:
The above opinions given constitute general market commentary, and do not constitute the opinion or advice of IC Markets or any form of personal or investment advice.
Any opinions, news, research, analyses, prices, other information, or links to third-party sites contained on this website are provided on an "as-is" basis, are intended only to be informative, is not an advice nor a recommendation, nor research, or a record of our trading prices, or an offer of, or solicitation for a transaction in any financial instrument and thus should not be treated as such. The information provided does not involve any specific investment objectives, financial situation and needs of any specific person who may receive it. Please be aware, that past performance is not a reliable indicator of future performance and/or results. Past Performance or Forward-looking scenarios based upon the reasonable beliefs of the third-party provider are not a guarantee of future performance. Actual results may differ materially from those anticipated in forward-looking or past performance statements. IC Markets makes no representation or warranty and assumes no liability as to the accuracy or completeness of the information provided, nor any loss arising from any investment based on a recommendation, forecast or any information supplied by any third-party.

Heading into pullback resistance?GBP/JPY is rising towards the resistance level which is a pullback resistance that lines up with the 71% Fibonacci retracement and the 161.8% Fibonacci extension and could reverse from this level to our take profit.
Entry: 192.34
Why we like it:
There is a pullback resistance that lines up with the 161.8% Fibonacci extension and the 71% Fibonacci retracement.
Stop loss: 194.82
Why we like it:
There is a pullback resistance.
Take profit: 189.96
Why we like it:
There is a pullback support level that aligns with the 38.2% Fibonacci retracement.
Enjoying your TradingView experience? Review us!
Please be advised that the information presented on TradingView is provided to Vantage (‘Vantage Global Limited’, ‘we’) by a third-party provider (‘Everest Fortune Group’). Please be reminded that you are solely responsible for the trading decisions on your account. There is a very high degree of risk involved in trading. Any information and/or content is intended entirely for research, educational and informational purposes only and does not constitute investment or consultation advice or investment strategy. The information is not tailored to the investment needs of any specific person and therefore does not involve a consideration of any of the investment objectives, financial situation or needs of any viewer that may receive it. Kindly also note that past performance is not a reliable indicator of future results. Actual results may differ materially from those anticipated in forward-looking or past performance statements. We assume no liability as to the accuracy or completeness of any of the information and/or content provided herein and the Company cannot be held responsible for any omission, mistake nor for any loss or damage including without limitation to any loss of profit which may arise from reliance on any information supplied by Everest Fortune Group.

GBPUSD 1.50 ?👀 Market Insight – GBP/USD
After a long time, I’ve revisited the currency pairs — and GBP/USD has caught my attention!
The setup is looking strong and is preparing for a move toward the 1.50 benchmark, sooner or later. 📈
Stay tuned — opportunities are lining up!

GBPUSD - Big Move Setting Up - Elliott Wave AnalysisGBPUSD is currently unfolding a 5-wave impulsive move according to Elliott Wave Theory.
At the moment, we are in Wave 4, which typically corrects against the larger trend.
Key Points:
Wave 2 was a simple correction, so based on alternation, Wave 4 is expected to be more complex (likely an ABC structure).
Wave 4 often retraces to the 38.2% Fibonacci level — in this case, aligning perfectly with a long-term ascending trendline, providing additional confluence for a potential buy zone.
Trade Plan:
- Monitor the ABC correction for completion near the 38.2% retracement.
- Look for bullish confirmation (trendline break, bullish structure shifts, BOS, etc.).
- Entries will be considered after clear signs of bullish pressure.
- Stoploss: Below the lows formed during the Wave 4 correction.
Targets:
First Target: 1.3400 (450 pips)
Second Target: 1.3750 (800 pips)
Summary:
Patience is key during the Wave 4 correction. Once the setup confirms, this could offer a strong risk-reward opportunity within the overall bullish impulsive structure.
See our past GBPUSD setups below:
Swing 1:
Swing 2:
Swing 3:

GBPCHF - Bull No More!Hello TradingView Family / Fellow Traders. This is Richard, also known as theSignalyst.
📈From a medium-term perspective, GBPCHF has been bullish trading within the rising channel marked in blue.
This week, GBPCHF has been approaching the upper bound of its channel.
Moreover, the red zone around $1.115 is a strong support turned resistance.
🏹 Thus, the highlighted red circle is a strong area to look for sell setups as it is the intersection of the upper blue trendline and resistance.
📚 As per my trading style:
As #GBPCHF approaches the red circle zone, I will be looking for bearish reversal setups (like a double top pattern, trendline break , and so on...)
📚 Always follow your trading plan regarding entry, risk management, and trade management.
Good luck!
All Strategies Are Good; If Managed Properly!
~Rich
Disclosure: I am part of Trade Nation's Influencer program and receive a monthly fee for using their TradingView charts in my analysis.
