GBP/AUD : SELL After Bearish Candle Confirmation !!BUY & SELL As Per Above Given Chart or
You Can Also set Own Risk reward.
Let see what Will be Next Move.
Warning- I m Not a Financial Advisor this idea Only For Educational Purpose Only.
Thank You !!
Gbpaudbuy


Aussie Strength Waning? - Ichimoku GBP/AUD Long Trade SetupAfter a long down trend, the pound finally found some footing. We are entering the kumo and I am watching for the possibility of a new bullish trend to form as the GBP tries to claw it's way back. As the week progresses I'll be watching for a bullish kumo breakout and completion of the kumo twist to bullish to help confirm it's time for an entry. I've set my entry at a flat spot on the kumo which should act as a good gauge if we'll make the move up or not. If we can close through that level we should try and climb quite a bit higher. If we fail to break through the kumo or hold price structure support, this setup may become invalidated.

GBPAUD HUGE DOWNTREND BREAKOUTGBPAUD was following a downtrend line, however it just broke out, has come back down to test a newly made support zone (RETEST) before making its way up...

GBPAUD LONGDouble Bottom - Weekly Ranging buy
Breakout of H1 Trendline and a quick retest.
Might have waited for a few hours for a better retest, but the psychological angst of missing a good trade kicked in. Now I am in the trade with a wide stoploss, because this pair WILL kick you out of a poorly executed trade.
REASON FOR ENTRY: The hourly quick retest candlestick was a bullish pinbar.
MESSY ANALYSIS:
This was my previous successful sell's analysis that I want to keep on my chart. Let's hope for the best.
TP could also go all the way up to form a triple top!


#GBPAUD Analysis with cool graphJust a cool graph, a distinct downward trend in the short term, only when the exit from the descending channel or one of the candles will rise above one of the lines (blue and red) will be possible to return to buy.
WIFE or FANCY WOMAN?Similar trade setup to my last post, We have a strong TL formed that keeps getting respected and price is at a key level.
So again this is another really good trade to keep your eye on to see if price breaks either our TL or respects it and breaks strong support, a break of either should produce explosive bullish or bearish movement.
This trade is like having a wife ( TL ) and a fancy woman ( Support ) on the side... you want to go with the TL ( wife ) as she has stood by you and respected you for along time but the support level looks tasty and you cant help but let your mind stray ;p
Always trade with caution and correct risk management.

GBPAUD 290 PIPS LONG Were long for gbpaud and we are hoping to bank 290 pips on this trade. Could take a while but it will get there.


GBPAUD - SELLERS FAKE - 21.05.2019DACAPITALTRADING V2.0:
WELCOME TO DACAPITAL TRADING, WE PROVIDE ANY KIND OF TECHNICAL AND FUNDAMENTAL ANALYSIS
FOR FOREX AND CRYPTO-CURRENCY MARKETS EVERY DAY!
-
1 HOUR
Bearish pullback towards previous support zone.
4 HOUR
Bearish market open below previous week lows.
DAILY
Found support now and need bullish movement!
DACapitalTrading V2.0
BUY GBPAUD
ENTRY @ 1.84810
SL @ 1.84040 (75 Pips)
TP @ 1.86120 (130 Pips)
RR: 1.70
Use half of normal Risk (0.5%)
(Remember to add a few pips to all levels - different Brokers!)
LEAVE US A LIKE AND COMMENT TO KEEP OUR CONTENT FOR FREE AND EVERYONE!
HAVE A GREAT WEEK
ALAN

GBPAUD - MORE DROP COMINGPlease share your thoughts and views on my analysis and don't forget to like it and share with others.

GBPAUD headed to 1.87500GBPAUD has arrived at support area and there can be seen that in the h4 candle that there is no momentum to the downside, hence i am seeing a good buy opportunity with an indication of an bullish engulf candle at my buy position .


COMMENT why you think we chose this setup.See how keeping thing simple and your charts clean can lead to spotting more setups and save you time? Half the information on the internet is purposely put up to confuse people so they loose money in the markets, if you look on the internet people will tell you that you need to use loads of different indicators to succeed in the markets, this is BULL#HIT!!! Price action, key support and resistance levels and trend lines are all you need!
So comment below why you think our reasoning is that this trade will make a bullish run.


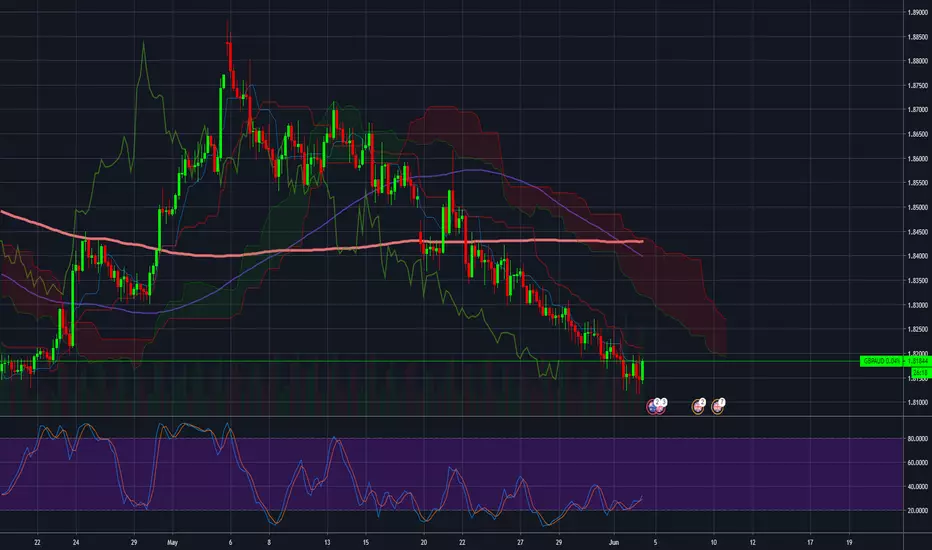
FREE 150 PIPS We can see a strong resistance turned support line ( green line ) price was using the as good strong support recently but managed to break through and now is using this level as support.
We are expecting price to bounce and make bullish movement and possibly hitting our TP area or resistance zone ( green box )
So go grab yourself a nice 150 pips on this bank holiday Monday and thank us later ;p

GBPAUD longLooking like it wants to test the lower levels, betting on a bounce in the box, looking for a test of lost support above


BUY GBPAUD ON 1HAnticipating shift in trend upwards as price action demonstrates a strong momentum swing up. Additionally, MACD + Stochastic + RSI provide additional support for my hypothesis


