Gbpaudlong

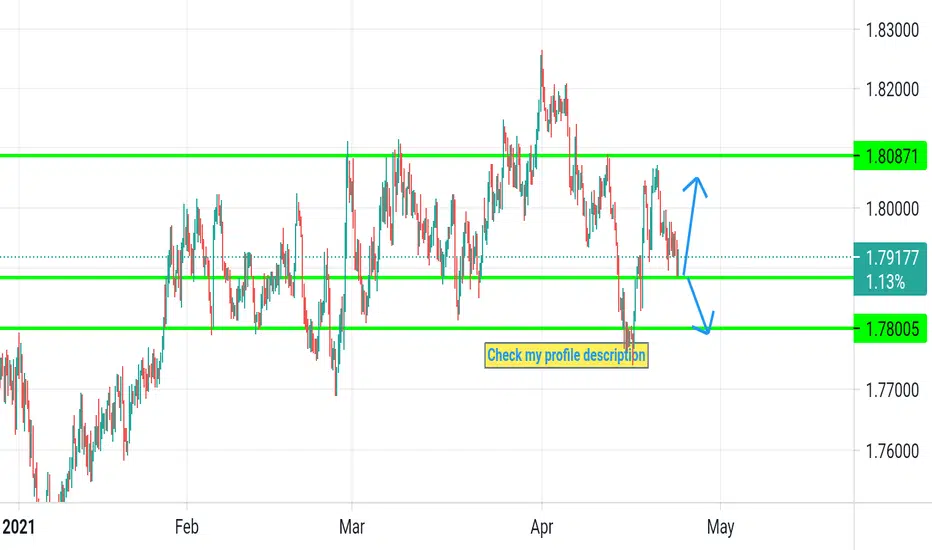
100 Pips on GbpaudIn this trade idea I am looking at Gbpaud respecting the support level found @ 1.78040. We are now pushing up the come and retest the trend line. Once we break above the micro resistance that was created @ 1.79050
.

GBPAUD BuyTrade (My View)A Nice Trade Opportunity Here With GBPAUD>>>>> Looking For Price To Test Upper Trendline.. SL Indicated On Chart (You Can Have Yours Slightly Lower..) TP 1$2 Indicated By Dotted Lines

Will we reject off the bottom zone or continue bearish?Daily directional bias is southward. We have some key levels that need to either be respected (FO = fake out) or rejected (BO = Break out)

GBP/AUD - Forecast 550 pip Take Profit
30 pip Stop Loss
Risk Ratio: 18.33
Risk on balance - 1.5%
Potential Gains - 27.49%

GBPAUD - LONG (6/5/2021)in this bullish trend, i decide to go long after i found divergence and bouncing off from the trendline support

GBP/AUD 2 New Long Setups Available To Catch More Than 300 Pips This is an educational + analytic content that will teach why and how to enter a trade
Make sure you watch the price action closely in each analysis as this is a very important part of our method
Disclaimer : this analysis can change at anytime without notice and it is only for the purpose of assisting traders to make independent investments decisions

GBPAUD is facing bullish pressure | 4 May 2021Prices are facing bullish pressure from our ascending trend line and support level, in line with our 61.8% retracement and 78.6% extension where we could see a bounce above this level . Ichiomku cloud and EMA are showing signs of bullish pressure as well.

GBPAUD is facing bullish pressure | 4 May 2021Prices are facing bullish pressure from our ascending trend line and support level , in line with our 61.8% retracement and 78.6% extension where we could see a bounce above this level . Ichiomku cloud and EMA are showing signs of bullish pressure as well.


GBPAUD Buy SignalHey traders, here is the analysis for the GBPAUD. Let me know if you guys have any questions in the comment section. If you guys like my analysis please hit like. Thanks. NOTE - Please do your own analysis before taking the trade.

GBPAUD daily candle is going up. Channel is formingThis pair's daily candle is going up from its channel and in 1 hour as well we can see the clear channel so we can expect till the next high.
Safe trades guys!

GBPAUD BuyTrade (My View)This Pair Just Bounced Off Support Nicely RSI Is Overbought Giving Us An Opportunity For Buy Trade Option GBPAUD ::: SL Indicated On Chart But As Always YoU Can Always Have Yours lightly Lower... TP INdicated By Dotted Lines.


GBPAUD Trading idea▪️GBPAUD D1 Analysis
▪️Wait Fibo + Candle Closing Confirmation
▪️Wait SELL Signal Confirmation
** GBPAUD ** nice trades for GBPAUD this week 19th to 23rd ApriHi all, hope you've all had a good weeks trading, really happy with this weeks trades, have a good weekend everyone.
Evening all, gold trade currently open,
The entry price, stop loss (in pipettes) and take profit are shown on the chart itself.
Just something I'm working on in Pine script, I'll share as many trading ideas as and when I can, so I can document my progress.
My name is Al, I'm 40 and from the UK.
I've been trading for a few years, my key goal is to automate my strategies and remove as many decisions as I can.
Any questions, feel free to drop me a direct message if I can help.
These ideas, aren't specific advice from me - so if you enter, of course do your own due diligence - always manage your risk like a pro too.
This is all for information and education.
Have a great day,
Al.
🙂
PS. Check my other 'Related Ideas' too.


GBP/AUD New Long Setup To Catch 250 PipsThis is an educational + analytic content that will teach why and how to enter a trade
Make sure you watch the price action closely in each analysis as this is a very important part of our method
Disclaimer : this analysis can change at anytime without notice and it is only for the purpose of assisting traders to make independent investments decisions

GBP/AUD long idea, price channel formationGBP/AUD is moving inside a price channel which is pretty straightforward.
Price is currently moving up from the support line.
A rise till 1.8270 is expected as price reaches the resistance line of the channel.

GBPAUD is approaching support, potential bouncePrice is facing bullish pressure from our first support in line with our 61.8% fibonacci retracement, horizontal pullback support and 127.2% fibonacci extension where we could see a bounce above this level to our first resistance target. Ichimoku cloud is showing signs of bullish pressure as well, in line with our bullish bias.


Long Long Long Price this week has on a daily time frame retraced and bounced perfectly off the 61.8 Fib level. I have entered a long position at 1.7750 however next week I will look to add to this as i do believe that we will head back to 1.8250 then on to 1.84/5 in the next 2 weeks.
Keep in mind price may bounce off trend line at 1.8000, which will indicate a short position back to 1.7750.
Lemme know what you think!

GBPAUD BuyTrade (My View)Second & Last Trade of The Week!!! A Nice Buy Opportunity... SL $ TP Indicated On Chart!!
