Easy Trends To followHere is the 1 Hour GBPAUD chart . This is a clear trend to see. downtrend motion, then it stops to consolidate sideways , before continuing the down trend motion.
Gbpaudshort

GBPAUD Overview week commencing on the 13th Dec. 2021Weekly chart - closed strong bearish engulfing 2 weekly candles. Could still some bearish for this week.
Daily Chart - broke minor level of support came back around the area of previous resistance and rejected (could we come lower or potentially start raging?)
Previous Daily candle - doji showing some indecision around the "minor" support which can now potentially become support.
H4 Chart - Previous level of support broken and being retested a potential resistance now, in line with 38.2% Fib level.
30m Chart - ABC corrective (just reach TP level and new level of resistance established), 2 approaches can be taken:
Aggressive approach: if a double top scenario happens then short at the double top!
Conservative approach: wait for bearish confirmation on 30m Chart break of support level (then retest as resistance) before shorting
Follow up as the week goes on....

GBPAUD daily short ideaGBPAUD reached my strategy lvl on the 0%, retesting after breaking structure. Targeting the 100% of the IPA

GBPAUD short potential for the weekAs we open the week following the bearish weekly last week, we can see we are nearing the red supply zone. The purple line there indicated a imbalance from the weekly TF. Today being Monday i can expect the price to be moving in the opposite direction that it intends to from the rest of the week. If the red zone rejects, we can see ourselves pushing all the way back down into 1.83000 for the week. However if broken we can continue back into the highs.


GBPAUDThe price will continue to go down
Until reaching the support area,
from which it begins to move in the upward direction to reach the target

GBPAUD Chart H1Here is my view for GBPAUD on H1. The price should go down, you can put a pending order on the Order block or find an entry on LTF within OB Zone. Trade Safe!

GBPAUD Prediction H1Here is my view for GBPAUD on H1. The price should go down, you can put a pending order on the Order block or find an entry on LTF within OB Zone. Trade Safe!

GBPAUDGBPAUD broke the main level, it is going to experience an exhaustion phase then move in the main trend. this level can hold price and push it to that phase then we can think to buy based on our trading paln.

GBPAUD possible sell - overbalanceThis is neutral ideal so far. I marked possible overbalance at the chart with possible sell zone. It's worth to keep an eye on this pair. We'll know more just after GDP news in the UK.

GBPAUDHello Traders Welcome back to another profit day
If you like my idea please give me a like and comment, That's will be a great appreciation to do more predictions
Here is the full analysis for this pair, Let me know in the comment section below if you have any questions, the entry will be taken only if all rules of the strategies will be satisfied. I suggest you keep this pair on your watchlist and see if the rules of your strategy are satisfied.
GBPAUD view with S & R
Remember this analysis is not 100% accurate No single analysis is To make a decision follow your own thoughts.
The information given is not a Financial Advice.
Please support this idea with a like, if you find it useful
have a good profit day guys


SUPPLY AND DEMAND - GBPAUDW1 Tf - short bias
Price reaching W1 Supply
Get ready for SELLS
D1 Direction
Fresh SWING opportunity if price reaches into D1 Supply zone
H4 Intermediate
No nice zone to sell from
H1 entry
Sell zone identified if price goes back to Supply zone
RR: 1:3
GBPAUD Price Prediction H1Here's my view for GBPAUD on H1. The price should go up, you can put a pending order on the Order Block or find an entry on LTF. Trade Safe!

GBPAUD, 4HA chart pattern of Double top is formed which is the indication of selling. Also, 0.786 Fibonacci level is acting as resistance and making confluence with double top.

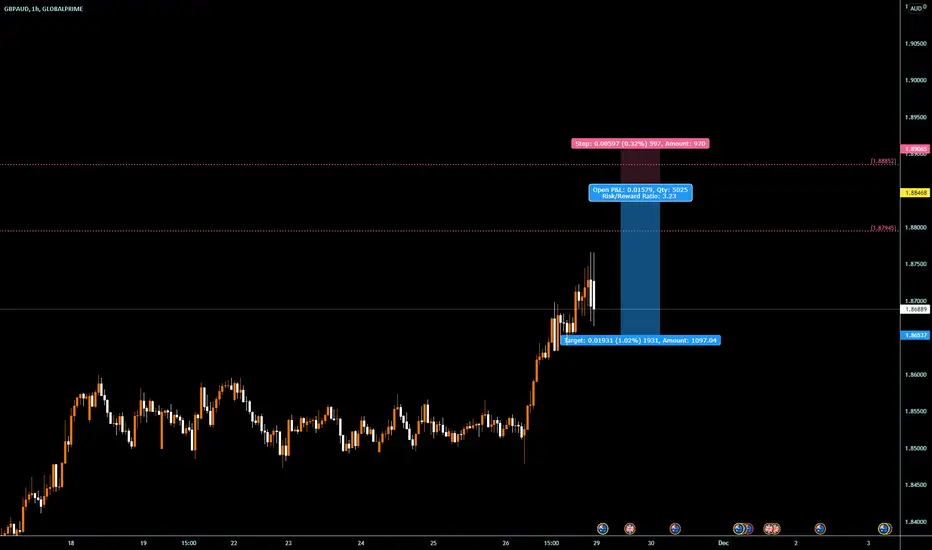
GBP/AUDSell: GBP / AUD
Sell limit: 1.88235
SL @ 1.88950
TP @ 1.86840
Max Risk: 2%
(When calculating, do not forget about different spreads from Brokers)
Leave comments or likes to keep our content free and alive.
Have a good week to everyone
It is not an investment recommendation

GBPAUD | BULLS TAKING CHARGE GBPAUD | BULLS TAKING CHARGE
GBPAUD is testing the horizontal support level which is also the trendline support.
Two scenario can play here;
(1) Buy at current price with SL 1.85937
(2) Sell if it breaks the horizontal support

FOREX ANALYSIS : GBPAUDFX:GBPAUD
The blue and red lines mean: I think prices can return in these areas.
Green lines mean: I think the price can reach these areas. They are therefore known as transaction targets.
If you want to use this deal, please risk only one percent of your account balance.

GBPAUD SHORT - Sell Entry - D1 ChartGBPAUD SHORT - Sell Entry - D1 Chart
Symbol: GBPAUD
Timeframe: D1
Type: SELL
Entry Price: Sell @ Market
Stop Loss: 1.87858
Take Profit: 1.82551
🔺 DISCLAIMER
🔺 For educational informational purposes only.
🔺 Analysis may change at any time without notice.
🔺 You must research and create your own trading plan.

GBPAUD > The Best Place for A Sell..Analysis on #GBPAUD
Watching GBPAUD when and if it will come to test my resistance structure level then i will drop a one-time frame to look for a sell entry as I believe the market will turn bearish from this zone as it did before
Like and comment will be hugely appreciated, thank you so much for your support.
Check today analysis below⠀
>>“ insanity doing the same thing over and over again and expecting different results" -/einstein

GBPAUD SHORTS RISKY 📉📉📉Expect the price to colapse from this area, i call this a risky entry because we go against the major HTF structure. Price took out liquidity above weekly high and should reverse a little bit till imbalance fill h4. On a medium-long term perspective i will look only for LONGS there.
What do you think ? Comment below..


GBPAUD Head and Shoulder 🔥🔥Hello Traders , Welcome to this analysis, we are looking at the DAY- timeframe.
My trading strategy is based on the simplicity .
Please don't forget to FOLLOW , LIKE and COMMENT .
If you like my analysis.
Thank you and Good Luck!
