GBPCAD: The Hunt for the Previous Month's LowLike a predator stalking its prey, the market often moves with a clear objective. For GBPCAD, the primary target is now the massive pool of liquidity resting below the Previous Month's Low. This isn't a random drop; it's a calculated hunt. This analysis lays out the plan to join the reversal after the hunt is complete.
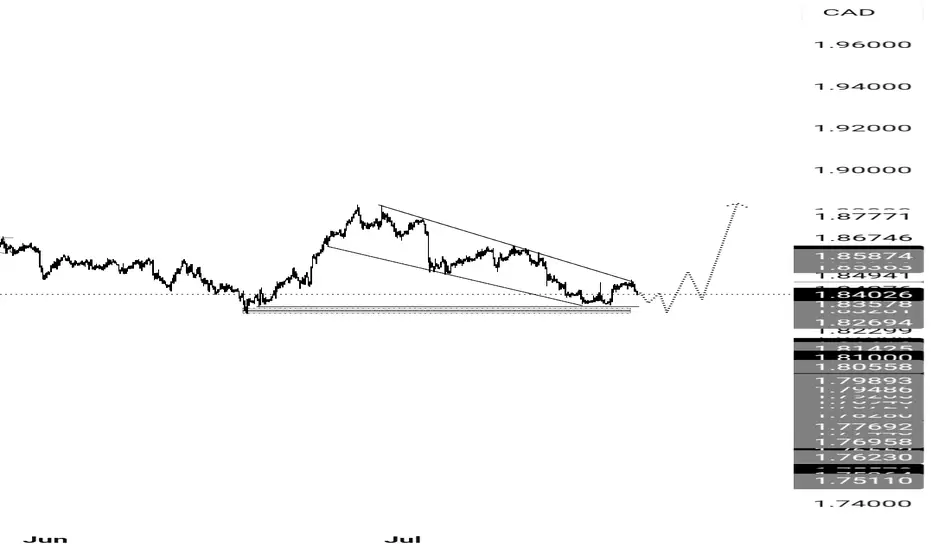
The price of GBPCAD is approaching a large pool of liquidity in the form of the Previous Month's Low (PML) , with the May 5th low located just below it. There is a high probability that this liquidity will be swept in the near future, because with only a few days left until the end of the month, the PML will no longer act as such a strong magnet for the price as it does now.
The capture of this liquidity would be accompanied by the mitigation of a daily order block in conjunction with a daily FVG . This confluence of factors could act as strong support for a potential price bounce, with a minimum target of a liquidity sweep of the Previous Week's High (PWH) .
SETUP CONDITIONS
The condition for the long setup to form would be a sharp downside liquidity sweep with a candle wick, which mitigates the upper part of the daily order block, followed by the start of a bullish order flow on a lower timeframe .
► Invalidation: Invalidation of the long scenario would be a daily candle body closing below the May 5th low, or a sharp drop to the middle of the daily order block.
~~~~~~~~~~~~~~~~~~~~~~~~~~~~~~~~~~~~~~~~~~~~~~~~~~~~~~~~~~~~~~~~~
The principles and conditions for forming the manipulation zones I show in this trade idea are detailed in my educational publication, which was chosen by TradingView for the "Editor's Picks" category and received a huge amount of positive feedback from this insightful trading community. To better understand the logic I've used here and the general principles of price movement in most markets from the perspective of institutional capital, I highly recommend checking out this guide if you haven't already. 👇
P.S. This is not a prediction of the exact price direction. It is a description of high-probability setup that become valid only if specific conditions are met when the price reaches the marked POI. If the conditions are not met, the setup are invalid. No setup has a 100% success rate, so if you decide to use this trade idea, always apply a stop-loss and proper risk management. Trade smart.
~~~~~~~~~~~~~~~~~~~~~~~~~~~~~~~~~~~~~~~~~~~~~~~~~~~~~~~~~~~~~~~~~
If you found this analysis helpful, support it with a Boost! 🚀
Have a question or your own view on this idea? Share it in the comments. 💬
► Follow me on TradingView to get real-time updates on THIS idea (entry, targets & live trade management) and not to miss my next detailed breakdown.
~~~~~~~~~~~~~~~~~~~~~~~~~~~~~~~~~~~~~~~~~~~~~~~~~~~~~~~~~~~~~~~~~
GBPCAD

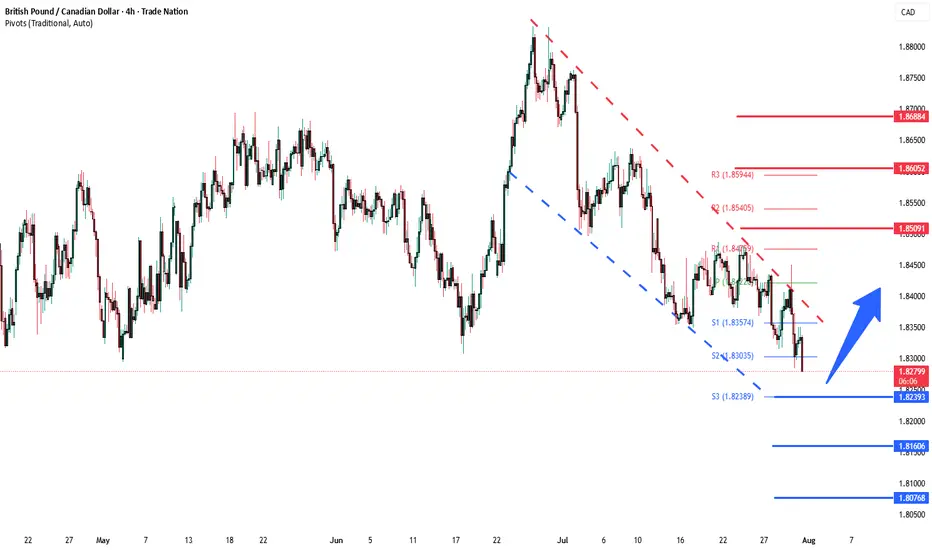
GBPCAD corrective pullback supported at 1.8240The GBPCAD remains in a bullish trend, with recent price action showing signs of a corrective pullback within the broader uptrend.
Support Zone: 1.8240 – a key level from previous consolidation. Price is currently testing or approaching this level.
A bullish rebound from 1.8240 would confirm ongoing upside momentum, with potential targets at:
1.8510 – initial resistance
1.8600 – psychological and structural level
1.8690 – extended resistance on the longer-term chart
Bearish Scenario:
A confirmed break and daily close below 1.8240 would weaken the bullish outlook and suggest deeper downside risk toward:
1.8160 – minor support
1.8076 – stronger support and potential demand zone
Outlook:
Bullish bias remains intact while the GBPCAD holds above 1.8240. A sustained break below this level could shift momentum to the downside in the short term.
This communication is for informational purposes only and should not be viewed as any form of recommendation as to a particular course of action or as investment advice. It is not intended as an offer or solicitation for the purchase or sale of any financial instrument or as an official confirmation of any transaction. Opinions, estimates and assumptions expressed herein are made as of the date of this communication and are subject to change without notice. This communication has been prepared based upon information, including market prices, data and other information, believed to be reliable; however, Trade Nation does not warrant its completeness or accuracy. All market prices and market data contained in or attached to this communication are indicative and subject to change without notice.
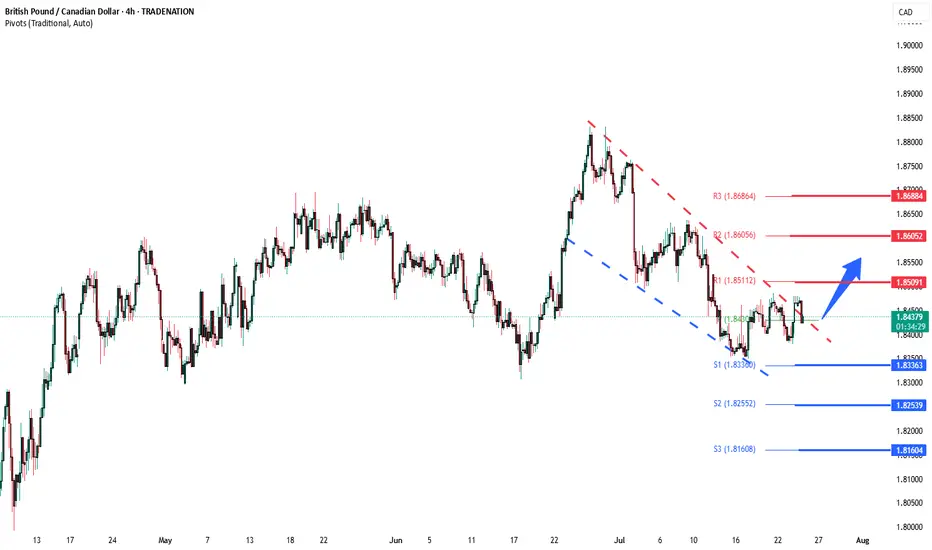
GBPCAD 4H The price appears to be forming a strong support zone around the 1.8350 level, as marked by the horizontal gray area. This level has been tested multiple times, suggesting accumulation and potential exhaustion of selling pressure.
🔄 Scenario: If the support holds, GBP/CAD could bounce and head towards the 1.8800–1.8900 area, as illustrated by the projected path.
✅ Bullish Bias if:
Price holds above 1.8350
Breakout above minor highs near 1.8450
Positive momentum from news or fundamentals
🚫 Invalidation:
Clean break below 1.8300 could trigger further downside.
---
⚠️ Disclaimer
> This chart is for educational and informational purposes only. It does not constitute financial advice or a recommendation to buy or sell any financial instrument. Always conduct your own research and consult a licensed financial advisor before making trading decisions.

GBPCAD At Support - High probability reversalGBPCAD descended with strength, and has now reached a strong support zone.
Price now hovers above and this zone and is a great indication to use for possible reversal move, that could send price into the 1.86100 level.
But if price breaks below support with momentum, then I’ll back off this bullish bias and reassess, and consider the reversal idea invalidated, with potential for further downside.
Just sharing my thoughts for the charts, this isn’t financial advice. Always confirm your setups and manage your risk properly.
Disclosure: I am part of Trade Nation's Influencer program and receive a monthly fee for using their TradingView charts in my analysis.

GBPCAD Will Go Down! Short!
Please, check our technical outlook for GBPCAD.
Time Frame: 1D
Current Trend: Bearish
Sentiment: Overbought (based on 7-period RSI)
Forecast: Bearish
The market is trading around a solid horizontal structure 1.833.
The above observations make me that the market will inevitably achieve 1.813 level.
P.S
Please, note that an oversold/overbought condition can last for a long time, and therefore being oversold/overbought doesn't mean a price rally will come soon, or at all.
Disclosure: I am part of Trade Nation's Influencer program and receive a monthly fee for using their TradingView charts in my analysis.
Like and subscribe and comment my ideas if you enjoy them!

GBP_CAD RISKY SETUP|LONG|
✅GBP_CAD is going down to retest
A horizontal support of 1.8320
Which makes me locally bullish biased
And I think that we will see a rebound
And a move up from the level
Towards the target above at 1.8380
LONG🚀
✅Like and subscribe to never miss a new idea!✅
Disclosure: I am part of Trade Nation's Influencer program and receive a monthly fee for using their TradingView charts in my analysis.

GBPCAD | One Kiss at 1.8390, and I’m All In!The big picture of GBPCAD is BUY possible up to 1.8550
See the H4 BUY range?
It slid love note to BUY into my DMs since 17/JulY. I didn't fall blindly since H4 SELL range came in like a jealous ex.
So I flipped to SELL and I shared my love signal with you here. (check my last week GBPCAD signal).
See that bottom black line at 1.8370?
It got a gentle kiss from the Daily candle (REJECTION).
Then 15m already whispered, "a sweet breakout"!
📌LONG STORY SHORT, I'M BUY AT 1.8390
If H4 comes and kisses 1.8390 (just a touch and wick), I’m BUYING — no more playing hard to get. 😘
TP? 1.8490 — that’s a sweet 100-pips date night!
But if it cuddles (closes by body) That’s it — my heart will be broken. 💔
WISH ME LUCK...or TISSUES! 😂!!!

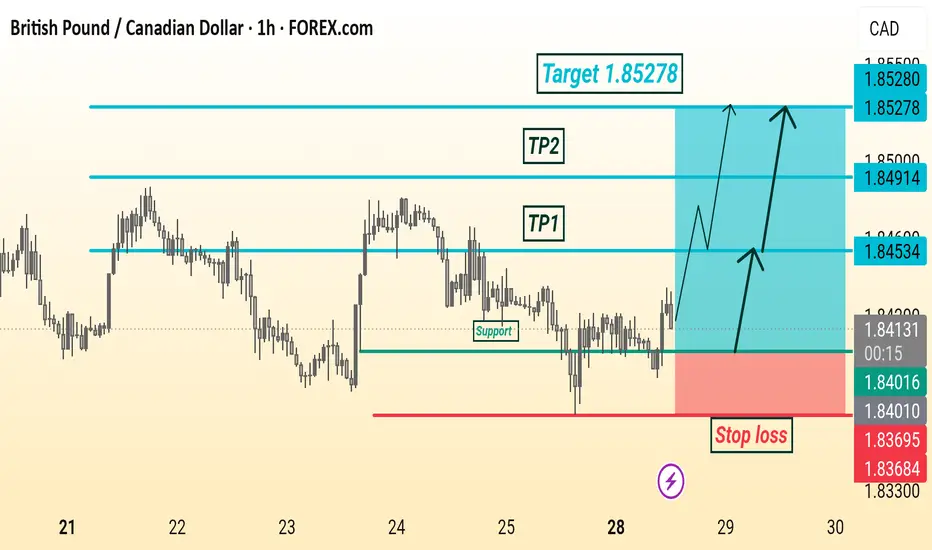
GBP/CAD Analysis Is Ready Move Will Be FlyThis is a bullish trade setup for GBP/CAD on the 1-hour chart. Price is expected to rise from the current level (1.84177) after bouncing from a support zone. The chart shows two potential take profit levels:
TP1 at 1.84534
TP2 at 1.84914
Final target is 1.85278, with a stop loss placed below support at 1.83684. Arrows suggest possible upward price movements
GBP/CAD - H4 - Bearish Flag (26.07.2025)The GBP/CAD Pair on the H4 timeframe presents a Potential Selling Opportunity due to a recent Formation of a Bearish Flag Pattern. This suggests a shift in momentum towards the downside in the coming Days.
Possible Short Trade:
Entry: Consider Entering A Short Position around Trendline Of The Pattern.
Target Levels:
1st Support – 1.8242
2nd Support – 1.8139
🎁 Please hit the like button and
🎁 Leave a comment to support for My Post !
Your likes and comments are incredibly motivating and will encourage me to share more analysis with you.
Best Regards, KABHI_TA_TRADING
Thank you.
Disclosure: I am part of Trade Nation's Influencer program and receive a monthly fee for using their TradingView charts in my analysis.

GBPCAD: Growth & Bullish Continuation
The price of GBPCAD will most likely increase soon enough, due to the demand beginning to exceed supply which we can see by looking at the chart of the pair.
Disclosure: I am part of Trade Nation's Influencer program and receive a monthly fee for using their TradingView charts in my analysis.
❤️ Please, support our work with like & comment! ❤️

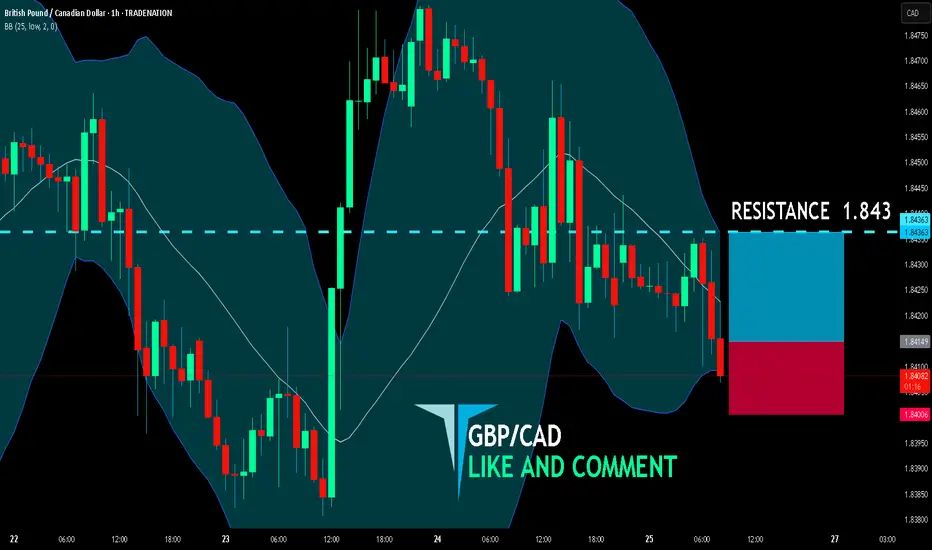
GBP/CAD BUYERS WILL DOMINATE THE MARKET|LONG
GBP/CAD SIGNAL
Trade Direction: long
Entry Level: 1.841
Target Level: 1.843
Stop Loss: 1.840
RISK PROFILE
Risk level: medium
Suggested risk: 1%
Timeframe: 1h
Disclosure: I am part of Trade Nation's Influencer program and receive a monthly fee for using their TradingView charts in my analysis.
✅LIKE AND COMMENT MY IDEAS✅
GBPCAD Bullish breakout supported at 1.8336The GBPCAD remains in a bullish trend, with recent price action showing signs of a corrective pullback within the broader uptrend.
Support Zone: 1.8336 – a key level from previous consolidation. Price is currently testing or approaching this level.
A bullish rebound from 1.8336 would confirm ongoing upside momentum, with potential targets at:
1.8510 – initial resistance
1.8600 – psychological and structural level
1.8690 – extended resistance on the longer-term chart
Bearish Scenario:
A confirmed break and daily close below 1.8336 would weaken the bullish outlook and suggest deeper downside risk toward:
1.8254 – minor support
1.8160 – stronger support and potential demand zone
Outlook:
Bullish bias remains intact while the GBPCAD holds above 1.8336. A sustained break below this level could shift momentum to the downside in the short term.
This communication is for informational purposes only and should not be viewed as any form of recommendation as to a particular course of action or as investment advice. It is not intended as an offer or solicitation for the purchase or sale of any financial instrument or as an official confirmation of any transaction. Opinions, estimates and assumptions expressed herein are made as of the date of this communication and are subject to change without notice. This communication has been prepared based upon information, including market prices, data and other information, believed to be reliable; however, Trade Nation does not warrant its completeness or accuracy. All market prices and market data contained in or attached to this communication are indicative and subject to change without notice.
GBPCAD Q3 | D24 | W30 | Y25📊GBPCAD Q3 | D24 | W30 | Y25
Daily Forecast🔍📅
Here’s a short diagnosis of the current chart setup 🧠📈
Higher time frame order blocks have been identified — these are our patient points of interest 🎯🧭.
It’s crucial to wait for a confirmed break of structure 🧱✅ before forming a directional bias.
This keeps us disciplined and aligned with what price action is truly telling us.
📈 Risk Management Protocols
🔑 Core principles:
Max 1% risk per trade
Only execute at pre-identified levels
Use alerts, not emotion
Stick to your RR plan — minimum 1:2
🧠 You’re not paid for how many trades you take, you’re paid for how well you manage risk.
🧠 Weekly FRGNT Insight
"Trade what the market gives, not what your ego wants."
Stay mechanical. Stay focused. Let the probabilities work.
FRGNT

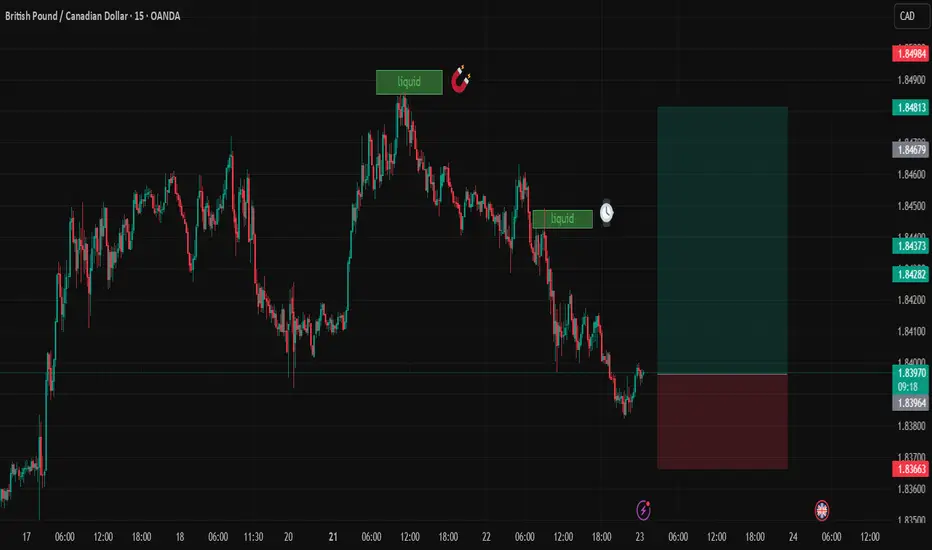
GBPCADDate:
July 23,2025
Session:
Tokyo and London session
Pair:
GBPCAD
Bias:
Long
2 liquidity pools that are waiting to be swept this week. Looks like price is gonna be magnetized towards these levels during London and Tokyo. The trade may even stretch into NYC.
Entry: 1.83970
Stop Loss: 1.83674
Target: 1.84811
RR: 2.82
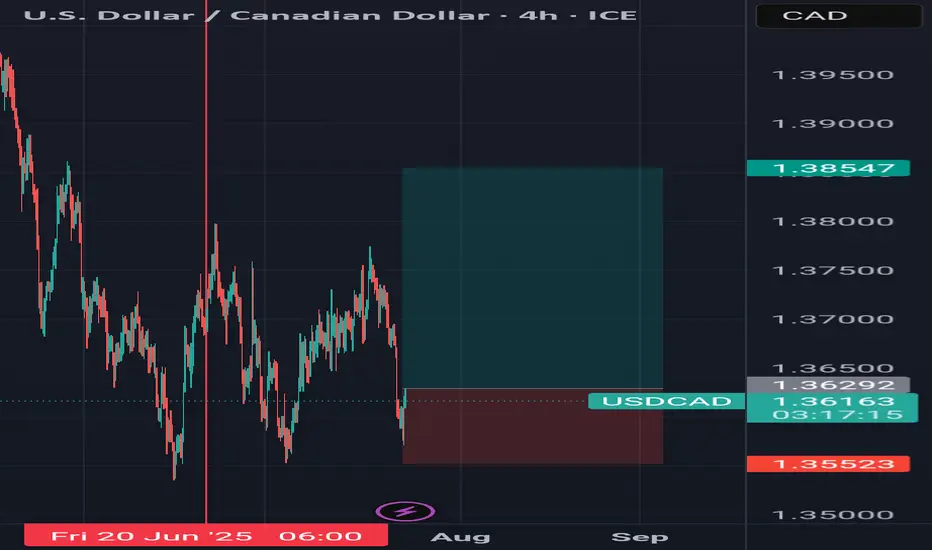
Buy usdcad Buy usdcad and gbpcad. You can set tp 1 at 1.37. Feel free to add Eurcad if daily candle closes as bullish on IDC chart. I'll keep you updated
LONG ON GBP/CADGBP/CAD is now at a major key area/demand zone after completing its pullback phase.
I expect price to now rise to the next level of supply or previous high.
looking to catch 200-400 pips throughout the week.

GBPCAD Is Very Bullish! Buy!
Please, check our technical outlook for GBPCAD.
Time Frame: 4h
Current Trend: Bullish
Sentiment: Oversold (based on 7-period RSI)
Forecast: Bullish
The market is approaching a significant support area 1.841.
The underlined horizontal cluster clearly indicates a highly probable bullish movement with target 1.848 level.
P.S
The term oversold refers to a condition where an asset has traded lower in price and has the potential for a price bounce.
Overbought refers to market scenarios where the instrument is traded considerably higher than its fair value. Overvaluation is caused by market sentiments when there is positive news.
Disclosure: I am part of Trade Nation's Influencer program and receive a monthly fee for using their TradingView charts in my analysis.
Like and subscribe and comment my ideas if you enjoy them!

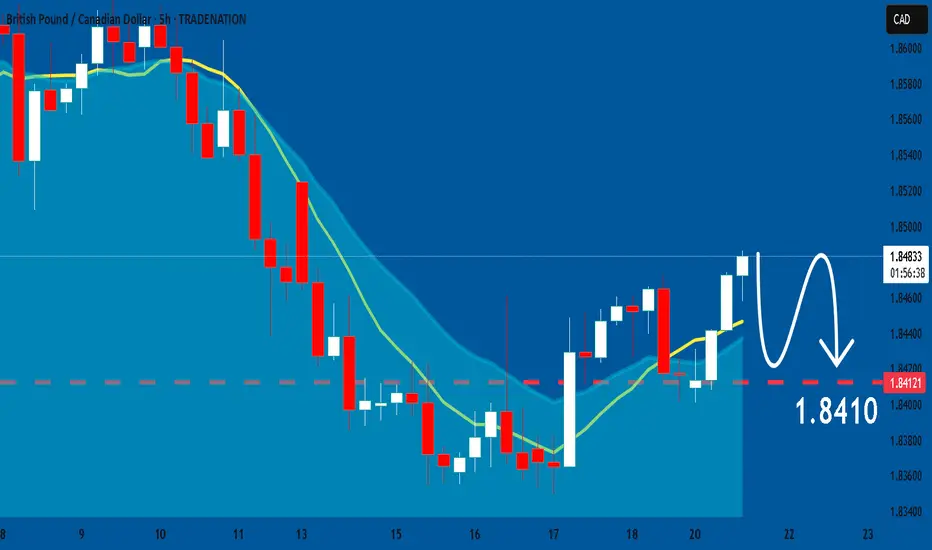
GBP/CAD Downtrend Setup – Clean Heist Entry Strategy🔥💷💣 THE GBP/CAD FOREX HEIST PLAN 💣💷🔥
Thief Trader Style – "Rob the Market, Not Each Other"
🧠 Smart Strategy | 🔍 Deep Analysis | 🎯 High Probability Plays | ⚔️ Risk-Controlled Attack
🌍 Hi! Hola! Ola! Bonjour! Hallo! Marhaba!
Dear Money Makers & Market Robbers, 🤑💰✈️
Welcome to another legendary forex robbery mission – this time, we’re planning the ultimate Pound vs. Loonie Heist (GBP/CAD). Powered by Thief Trading’s precision analysis (both technical & fundamental), this setup is designed for disciplined, stealthy traders who know how to attack at the right moment. Let’s take what’s ours from the market – the Thief way.
🔫 THE SETUP: GBP/CAD MARKET RAID
We’re eyeing a Short Entry near 1.83700 after the Moving Average Breakout Confirmation.
This ain’t just any pullback – this is a trap zone, a Police Barricade ATR Blue Zone, where liquidity fakes out the greedy bulls and invites a high-probability short for those with a thief’s vision.
Chart structure screams: overbought, slowing momentum, divergence + confluence = Bear Attack.
📍 Entry Plan:
💥 “The Heist is ON! Wait for the MA break… Then make your move at 1.83700!”
☑️ Sell Stop Orders – Just above the Moving Average or after key Support Break
☑️ Sell Limit Orders – For pullbacks at 15m or 30m TF near SWING H/L
☑️ Layered Entries / DCA Style – Multiple small entries for maximum control
☑️ Set Alerts! – Chart alarms keep your eyes sharp, your entries sharper.
🚨 Stop Loss Protocol (SL):
🛑 “No SL before breakout. You place early – you get burned.”
🗡️ After Breakout ONLY: SL near 1.84500, 4H Swing High
🛡️ Adapt based on your risk %, lot size, and number of open orders
🤫 Pro Tip: Smart SLs protect you, not limit you. Be like a ghost in the market.
🎯 Target Zone (TP):
📉 Initial Target: 1.82100
💨 “Get in, grab the bag, get out.”
You’re a thief – no greed, just precision. Exit before the alarms ring if the market flips!
🔎 Macro Factors Fueling the Bear Trend:
📉 Hawkish BOC tones down, GDP data contraction vibes
📈 GBP sentiment mixed; technical overbought signals dominate
🎭 Consolidation breakdown = High-Reward Entry Window
📰 News Awareness = Smart Survival:
⚠️ Avoid New Trades During Major News
📍 Use Trailing SLs to Protect Open Profits
🧨 Don’t get caught in the volatility trap – let the chaos work for you, not against you.
💥 BOOST THIS HEIST PLAN – ROBBERS UNITE 💥
Smash the “Boost” Button to power up our Thief Gang's momentum. Your support sharpens the edge for all fellow robbers in this daily market hustle.
🧠 Precision Plan
🧭 Risk-Aligned Entry
📈 Profitable Exit
That’s how Thief Traders operate.
🤑 Stay ready for the next drop. Another Forex bank is about to get robbed clean.
💣💰Let’s rob the charts – not each other.
— Thief Trader, Robbin’ with Logic & Style
🏴☠️📉📲

GBPCAD: Will Start Falling! Here is Why:
Remember that we can not, and should not impose our will on the market but rather listen to its whims and make profit by following it. And thus shall be done today on the GBPCAD pair which is likely to be pushed down by the bears so we will sell!
Disclosure: I am part of Trade Nation's Influencer program and receive a monthly fee for using their TradingView charts in my analysis.
❤️ Please, support our work with like & comment! ❤️
GBPCAD Q3 | D21 | W30 | Y25📊GBPCAD Q3 | D21 | W30 | Y25
Daily Forecast 🔍📅
Here’s a short diagnosis of the current chart setup 🧠📈
Higher time frame order blocks have been identified — these are our patient points of interest 🎯🧭.
It’s crucial to wait for a confirmed break of structure 🧱✅ before forming a directional bias.
This keeps us disciplined and aligned with what price action is truly telling us.
📈 Risk Management Protocols
🔑 Core principles:
Max 1% risk per trade
Only execute at pre-identified levels
Use alerts, not emotion
Stick to your RR plan — minimum 1:2
🧠 You’re not paid for how many trades you take, you’re paid for how well you manage risk.
🧠 Weekly FRGNT Insight
"Trade what the market gives, not what your ego wants."
Stay mechanical. Stay focused. Let the probabilities work.
FRGNT 📊

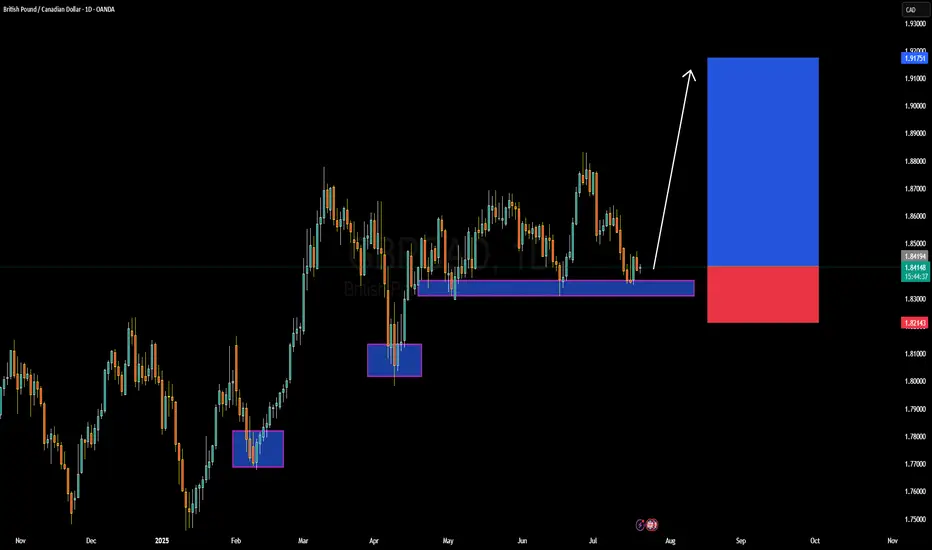
GBPCAD Forming Strong Bullish ReactionGBPCAD has once again tapped into a key daily demand zone that's held strong multiple times this year, forming a reliable support base around the 1.8200–1.8300 level. Price action has consistently respected this area, creating a clear bullish structure of higher lows following each test. The recent bounce indicates buyer interest is still strong, and I’ve entered long positions here with a high conviction that the bullish leg is about to resume. The risk-to-reward ratio on this setup is highly favorable, with upside potential targeting the 1.9150–1.9200 region.
From a macro perspective, the British pound remains supported by the Bank of England’s hawkish stance. Inflationary pressure in the UK remains sticky, keeping the door open for further rate hikes or at least prolonged tight monetary policy. On the flip side, the Canadian dollar is under slight pressure due to falling crude oil prices and the Bank of Canada's relatively more dovish outlook in recent statements, despite recent CPI upticks. This divergence in policy bias adds tailwind to the GBPCAD bullish bias.
Technically, this pair is respecting market structure with precision. Each bounce from the marked support zones has led to meaningful rallies, and current price behavior is following the same playbook. The consolidation over the past few sessions suggests accumulation, with a bullish breakout likely to follow. The marked blue target zone aligns with a clean price inefficiency and liquidity pool on the left side of the chart.
With momentum building and fundamental drivers favoring GBP strength, I expect a continuation move toward 1.9150 in the coming weeks. Patience and position management are key here, but the setup remains valid and in profit. Traders watching this zone should be alert for bullish confirmations and volume spikes to ride the next impulsive wave.
The GBPCAD is Unstoppable due to Strong Up TrendHello Traders
In This Chart GBPCAD HOURLY Forex Forecast By FOREX PLANET
today GBPCAD analysis 👆
🟢This Chart includes_ (GBPCAD market update)
🟢What is The Next Opportunity on GBPCAD Market
🟢how to Enter to the Valid Entry With Assurance Profit
This CHART is For Trader's that Want to Improve Their Technical Analysis Skills and Their Trading By Understanding How To Analyze The Market Using Multiple Timeframes and Understanding The Bigger Picture on the Chart

GBPCAD BUY IDEAPrice is forming a bullish channel,a break above the trendline and a retest should give us enough confirmation to join the bullish trend