GBPCAD Trading Plan - 20/Apr/2023Hello Traders,
Hope you all are doing good!!
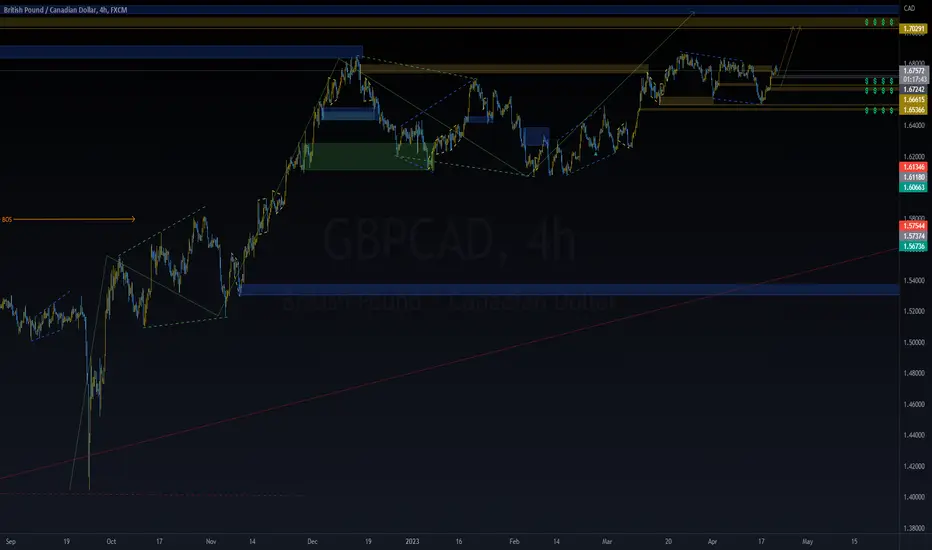
I expect GBPCAD to go Up after finishing the correction.
Look for your BUY setups.
Please follow me and like if you agree or this idea helps you out in your trading plan.
Disclaimer: This is just an idea. Please do your own analysis before opening a position. Always use SL & proper risk management.
Market can evolve anytime, hence, always do your analysis and learn trade management before following any idea.
Gbpcadbuy
GBPCAD Prediction H1Here is my view for GBPCAD on H1. The price could go bullish, you can put a pending order on the Order block or find an entry on LTF within OB Zone. Trade Safe!

GBP/CAD Creating New Higher Low, Can We Catch This New One ?This Is An Educational + Analytic Content That Will Teach Why And How To Enter A Trade
Make Sure You Watch The Price Action Closely In Each Analysis As This Is A Very Important Part Of Our Method
Disclaimer : This Analysis Can Change At Anytime Without Notice And It Is Only For The Purpose Of Assisting Traders To Make Independent Investments Decisions.

GBPCAD Trading Plan - 26/Feb/2023Hello Traders,
Hope you all are doing good!!
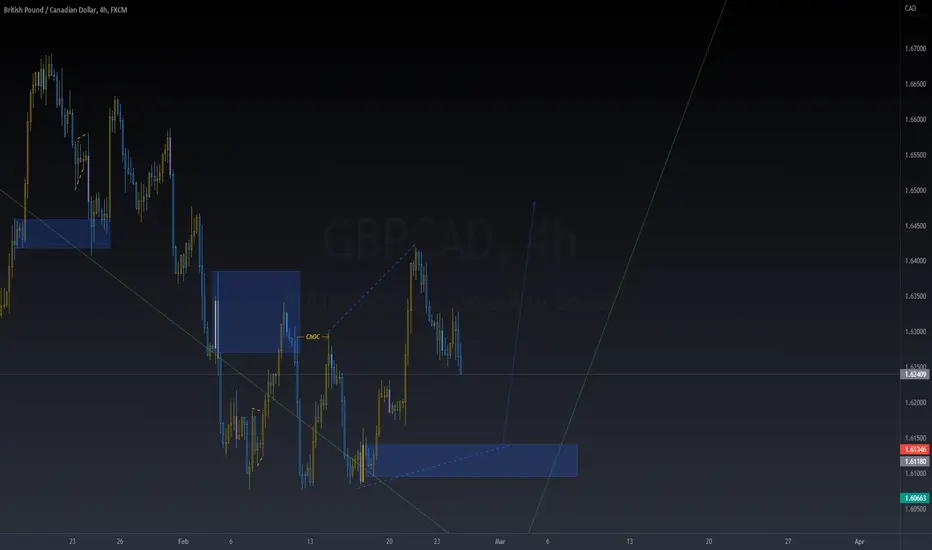
I expect GBPCAD to go Up after finishing the correction.
Look for your BUY setups.
Please follow me and like if you agree or this idea helps you out in your trading plan.
Disclaimer: This is just an idea. Please do your own analysis before opening a position. Always use SL & proper risk management.
Market can evolve anytime, hence, always do your analysis and learn trade management before following any idea.
GBPCAD Trading Plan - 8/Feb/2023Hello Traders,
Hope you all are doing good!!
I expect GBPCAD to go Up after finishing this correction.
Look for your BUY setups.
Please follow me and like if you agree or this idea helps you out in your trading plan.
Disclaimer: This is just an idea. Please do your own analysis before opening a position. Always use SL & proper risk management.
Market can evolve anytime, hence, always do your analysis and learn trade management before following any idea.

GBPCAD Idea H1Here is my view for GBPCAD on H1. The price could go bullish, you can put a pending order on the Order block or find an entry on LTF within OB Zone. Trade Safe!

GBPCAD : Long Trade , 1hGBPCAD buy Entry : 1.65038
Stop : 1.64266 , Target1 : 1.65820 , Target2 : 1.66580
Risk/Reward Ratio : 2

GBPCAD top-down analysis Hello traders, this is a complete multiple timeframe analysis of this pair. We see could find significant trading opportunities as per analysis upon price action confirmation we may take this trade. Smash the like button if you find value in this analysis and drop a comment if you have any questions or let me know which pair to cover in my next analysis.


GBPCAD Falling Wedge BreakoutWe can see a breakout of a falling wedge on the daily chart which could signal the end of a pull back.
We can see price is in up trend when we look left. With this being said we will only be looking
for buying opportunities in the direction of the bigger picture trend.

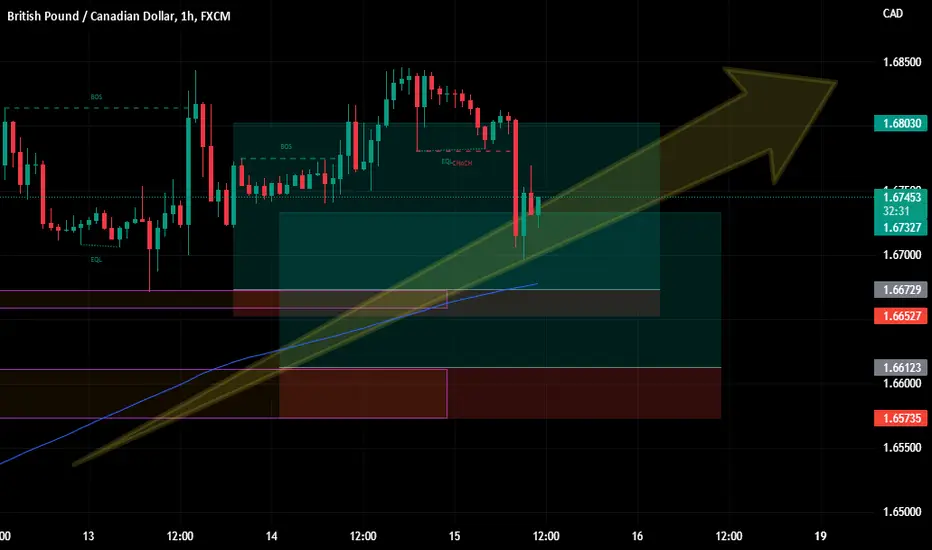
GBP/CAD LONG TRADE ...According to SMC , We have a two trades entry for long on GBP/CAD pair as following :
TRADE 1:
ENTRY @ 1.66729
SL @ 1.66527
TP @ 1.68030
RRR : 1:6.44
TRADE 2:
ENTRY @ 1.66123
SL @ 1.65735
TP @ 1.67327
RRR : 1:3.1
IF 1ST TRADDE IS ACTIVATED AND HIT TP , DON'T ENTER THE 2ND TRADE ...
GOOD LUCK GUYS ...
GBP/CAD LONG TRADE ...According to SMC , We have a two trades entry for long on GBP/CAD pair as following :
TRADE 1:
ENTRY @ 1.66526
SL @ 1.66364
TP @ 1.67080
RRR : 1:3.42
TRADE 2:
ENTRY @ 1.65868
SL @ 1.65724
TP @ 1.66484
RRR : 1:4.28
IF 1ST TRADDE IS ACTIVATED AND HIT TP , DON'T ENTER THE 2ND TRADE ...
GOOD LUCK GUYS ...

GBPCAD - Quick Scalp - Buy now! Let's scalp on GBPCAD!
Here's my entries:
🔷 Entry: 1.67300
✅ Take Profit: 1.67700
🔻 Stop Loss: 1.67120
This strategy is based on my 123 pattern retracement strategy!

GBPCAD top-down analysis, UPDATED!Hello traders, this is a complete multiple timeframe analysis of this pair. We see could find significant trading opportunities as per analysis upon price action confirmation we may take this trade. Smash the like button if you find value in this analysis and drop a comment if you have any questions or let me know which pair to cover in my next analysis.

GBPCAD BUY !!???Price make a nice change of character and confirmation from the big green candle there so i may took a trade in this pair. Always remember to took a trade with your own money management !!!

GBPCAD - Long from bullish orderblock ✅Hello traders!
‼️ This is my analysis on GBPCAD .
Here we are bullish from H4 timeframe perspective, so I am looking for longs. I expect price to continue the retracement and then to reject from bullish orderblock + institutional big figure 1.56000.
Like, comment and subscribe to be in touch with my content!

GBPCAD Long From Support!GBP-CAD is trading in an uptrend
Along the rising support line
And the pair is now about
To retest the support cluster
Of the rising and horizontal support
From where a bullish rebound
And a move up are to be expected

GBP/CADVery simple... Very clear
The general trend is downward and we are probably in the third downward wave, but it is possible that the price will move upwards in a corrective correction.
This is my personal opinion. Please do not trade based on my analysis and data.


GBPCAD Bullish Bias!GBP-CAD broke out of the falling channel
Which makes me bullish biased on the pair
But we need to wait for a pullback and retest of the level AT 1.51101
Before entering a long trad


GBP/CAD Finally Closed Above Our Res , Time To Long ?This Is An Educational + Analytic Content That Will Teach Why And How To Enter A Trade
Make Sure You Watch The Price Action Closely In Each Analysis As This Is A Very Important Part Of Our Method
Disclaimer : This Analysis Can Change At Anytime Without Notice And It Is Only For The Purpose Of Assisting Traders To Make Independent Investments Decisions.

GBPCAD BUY ANALYSISLooking at GBPCAD on 15M timeframe
Currently looking for long/buy position
We currently waiting for signals of reversal whereby we will then execute the trade
