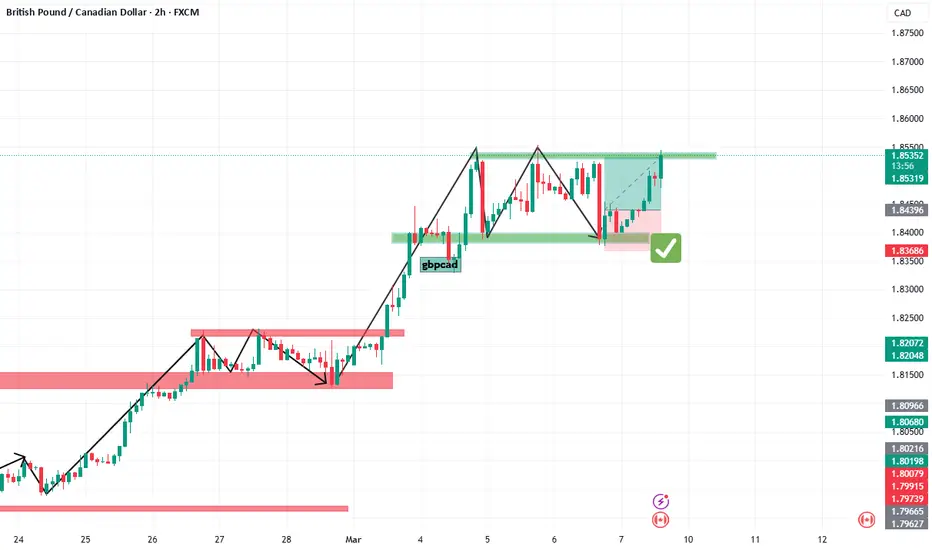
gbpcad resultgbpcad target hited.
This currency pair was in an uptrend and the target was touched.
thanks for support
Gbpcadidea
GBPCAD’s Bullish Surge: What’s Next? 💹 The GBPCAD has been in a strong bullish trend, reaching into previous highs on the daily timeframe—a key liquidity zone! 💰 This is a crucial area where smart money may take profits or induce a retracement before the next move.
📉 Given that price is currently overextended, I’m not looking to buy at these highs. Instead, I’ll be watching for a potential pullback into an unresolved imbalance, where we could see a high-probability long setup—if price action confirms the move. 🧐
💡 Patience is key in trading. Chasing price at extreme levels often leads to significant losses. I’ll be waiting for the right conditions to align before looking for an opportunity.
⚠️ Not financial advice. Always trade responsibly!
📊 Let me know your thoughts in the comments below.. 👇

GBPAUD Bullish Breakout!
HI,Traders !
GBP-AUD was trading in a
Narrowing wedge pattern
But now we are seeing a
Bullish breakout so we
Will be expecting a
Further bullish move up !
Comment and subscribe to help us grow !

GBPCAD Will Go Down!
HI,Traders !
GBP-CAD went up sharply
And hit a horizontal resistance
Level of 1.79851 so we are
Locally bearish biased
And as we are already
Seeing a bearish reaction
We will be expecting
A local bearish move down !
Comment and subscribe to help us grow !

GbpCad Short analysis This bias was from daily then H4 then H2.
I would have share the chart is H1 but H2 has more clarity and few candles than H1.
1.78866 is my point of interest I would have explained more on how I build my bias but just check this out, it's enough ss an insight. Kindly boost if you find this insightful 🫴

Scenario on GBPCAD 13.2.2025I see the GBPCAD market as follows: the first sfp short from the price of 1.785 and the next one is at the price of 1.795. If I look long, the first interesting level for me is around the support of 1.7695-1.7672. The next one comes out below this support and if the market breaks through it, I think we will go lower.

GBP/CAD "Pound vs Canadian" Forex Market Bullish Heist Plan🌟Hi! Hola! Ola! Bonjour! Hallo!🌟
Dear Money Makers & Thieves, 🤑 💰🐱👤
Based on 🔥Thief Trading style technical and fundamental analysis🔥, here is our master plan to heist the GBP/CAD "Pound vs Canadian" Forex market. Please adhere to the strategy I've outlined in the chart, which emphasizes long entry. Our aim is the high-risk Red Zone. Risky level, overbought market, consolidation, trend reversal, trap at the level where traders and bearish robbers are stronger. 🏆💸Be wealthy and safe trade.💪🏆🎉
Entry 📈 : "The vault is wide open! Swipe the Bullish loot at any price - the heist is on!
however I advise placing Buy Stop Orders above the breakout MA or Place Buy limit orders within a 15 or 30 minute timeframe. Entry from the most re cent or closest low or high level should be in retest.
Stop Loss 🛑: Thief SL placed at the recent / nearest low level Using the 4H timeframe,
SL is based on your risk of the trade, lot size and how many multiple orders you have to take.
Target 🎯: 1.85000 (or) Escape Before the Target
Scalpers, take note 👀 : only scalp on the Long side. If you have a lot of money, you can go straight away; if not, you can join swing traders and carry out the robbery plan. Use trailing SL to safeguard your money 💰.
📰🗞️Fundamental, Macro, COT, Sentimental Outlook:
GBP/CAD "Pound vs Canadian" Forex Market is currently experiencing a Bullish trend., driven by several key factors.
🟡Fundamental Analysis:
The UK's economic growth has been slow, but the Bank of England's interest rate decisions may provide support for the pound. Canada's economy has been affected by the decline in oil prices, which may impact the Canadian dollar.
🔴Macroeconomic Factors:
UK Inflation: 2.5% (August), expected to remain low
Canada Inflation: 2.1% (July), expected to rise
UK Unemployment: 3.9% (July), expected to remain low
Canada Unemployment: 5.7% (July), expected to rise
UK GDP Growth: 1.0% (Q2), expected to slow down
Canada GDP Growth: 1.3% (Q2), expected to slow down
🟤COT Report:
The Commitment of Traders (COT) report shows that institutional traders are net long on the GBP/CAD pair, indicating a bullish sentiment.
🟣Market Sentiment:
Bullish: 65%
Bearish: 35%
Neutral: 0%
Retail Trader Sentiment:
Long: 70%
Short: 30%
Institutional Trader Sentiment:
Long: 60%
Short: 40%
🟢Overall Outlook:
The GBP/CAD pair is likely to continue its bullish trend, driven by the UK's economic growth prospects and the Bank of England's interest rate decisions. A strong break above the resistance level could confirm the uptrend.
⚠️Trading Alert : News Releases and Position Management 📰 🗞️ 🚫🚏
As a reminder, news releases can have a significant impact on market prices and volatility. To minimize potential losses and protect your running positions,
we recommend the following:
Avoid taking new trades during news releases
Use trailing stop-loss orders to protect your running positions and lock in profits
📌Please note that this is a general analysis and not personalized investment advice. It's essential to consider your own risk tolerance and market analysis before making any investment decisions.
📌Keep in mind that these factors can change rapidly, and it's essential to stay up-to-date with market developments and adjust your analysis accordingly.
💖Supporting our robbery plan will enable us to effortlessly make and steal money 💰💵 Tell your friends, Colleagues and family to follow, like, and share. Boost the strength of our robbery team. Every day in this market make money with ease by using the Thief Trading Style.🏆💪🤝❤️🎉🚀
I'll see you soon with another heist plan, so stay tuned 🤑🐱👤🤗🤩

GBP/CAD "Pound vs Canadian" Forex Market Bearish Heist Plan🌟Hi! Hola! Ola! Bonjour! Hallo!🌟
Dear Money Makers & Thieves, 🤑 💰🐱👤
Based on 🔥Thief Trading style technical and fundamental analysis🔥, here is our master plan to heist the GBP/CAD "Pound vs Canadian" Forex market. Please adhere to the strategy I've outlined in the chart, which emphasizes long entry. Our aim is the high-risk Red Zone. Risky level, overbought market, consolidation, trend reversal, trap at the level where traders and bearish robbers are stronger. 🏆💸Be wealthy and safe trade.💪🏆🎉
Entry 📈 : "The vault is wide open! Swipe the Bullish loot at any price - the heist is on!
however I advise placing Buy Stop Orders above the breakout MA or Place Buy limit orders within a 15 or 30 minute timeframe. Entry from the most re cent or closest low or high level should be in retest.
Stop Loss 🛑: Thief SL placed at the recent / nearest low level Using the 4H timeframe,
SL is based on your risk of the trade, lot size and how many multiple orders you have to take.
Target 🎯: 1.85000 (or) Escape Before the Target
Scalpers, take note 👀 : only scalp on the Long side. If you have a lot of money, you can go straight away; if not, you can join swing traders and carry out the robbery plan. Use trailing SL to safeguard your money 💰.
📰🗞️Fundamental, Macro, COT, Sentimental Outlook:
GBP/CAD "Pound vs Canadian" Forex Market is currently experiencing a Bullish trend., driven by several key factors.
🟡Fundamental Analysis:
The UK's economic growth has been slow, but the Bank of England's interest rate decisions may provide support for the pound. Canada's economy has been affected by the decline in oil prices, which may impact the Canadian dollar.
🔴Macroeconomic Factors:
UK Inflation: 2.5% (August), expected to remain low
Canada Inflation: 2.1% (July), expected to rise
UK Unemployment: 3.9% (July), expected to remain low
Canada Unemployment: 5.7% (July), expected to rise
UK GDP Growth: 1.0% (Q2), expected to slow down
Canada GDP Growth: 1.3% (Q2), expected to slow down
🟤COT Report:
The Commitment of Traders (COT) report shows that institutional traders are net long on the GBP/CAD pair, indicating a bullish sentiment.
🟣Market Sentiment:
Bullish: 65%
Bearish: 35%
Neutral: 0%
Retail Trader Sentiment:
Long: 70%
Short: 30%
Institutional Trader Sentiment:
Long: 60%
Short: 40%
🟢Overall Outlook:
The GBP/CAD pair is likely to continue its bullish trend, driven by the UK's economic growth prospects and the Bank of England's interest rate decisions. A strong break above the resistance level could confirm the uptrend.
⚠️Trading Alert : News Releases and Position Management 📰 🗞️ 🚫🚏
As a reminder, news releases can have a significant impact on market prices and volatility. To minimize potential losses and protect your running positions,
we recommend the following:
Avoid taking new trades during news releases
Use trailing stop-loss orders to protect your running positions and lock in profits
📌Please note that this is a general analysis and not personalized investment advice. It's essential to consider your own risk tolerance and market analysis before making any investment decisions.
📌Keep in mind that these factors can change rapidly, and it's essential to stay up-to-date with market developments and adjust your analysis accordingly.
💖Supporting our robbery plan will enable us to effortlessly make and steal money 💰💵 Tell your friends, Colleagues and family to follow, like, and share. Boost the strength of our robbery team. Every day in this market make money with ease by using the Thief Trading Style.🏆💪🤝❤️🎉🚀
I'll see you soon with another heist plan, so stay tuned 🤑🐱👤🤗🤩

GBP/CAD Reversal Play: Riding the Support Zone to Triple TPIn this setup, I identified a strong support zone on the GBP/CAD 4-hour chart, marked in green. The price action tested this support multiple times, confirming its validity. Observing the bullish rejection wicks and the consolidation around this level, I anticipated a potential reversal.
I entered a long position at 1.78902, just above the support zone, ensuring a safe entry with confirmation of bullish momentum. My stop loss is placed slightly below the support at 1.77866 to protect against a false breakout while giving the trade enough breathing room.
For my take profit strategy, I set three target levels aligned with key resistance points:
Take Profit 1 at 1.79635 – This is the first resistance level, providing a conservative target.
Take Profit 2 at 1.79966 – A mid-level resistance, offering a balanced risk-reward ratio.
Take Profit 3 at 1.80379 – Targeting the upper resistance, maximizing potential gains if the bullish trend continues. OANDA:GBPCAD OANDA:GBPCAD

GBP/CAD Fall of the Pound A Bearish Trap Has Been Set Rising Channel Breakdown
The chart previously exhibited a rising channel with two parallel white trendlines containing the price movement.
The price broke below the channel, signaling a shift in market structure from bullish to bearish.
Bearish Momentum Confirmation After the breakdown, the price retested the lower trendline but failed to reclaim it, confirming resistance.
A strong bearish rejection followed, indicated by the red shaded area showing selling momentum.
Short Entry & Risk-Reward Setup
The short position was entered near 1.78981, slightly below the breakdown point.
The stop-loss is set at 1.80996, positioned above the breakdown level to avoid whipsaws.
The take-profit target is 1.75724, aligning with previous support and a logical demand zone.
Indicators & Confluence
EMA or Trend-Based Indicator. The red shading suggests the price is trending below a dynamic moving average, reinforcing bearish sentiment.
Bearish Candlestick Formation, A series of red candles and a retest failure further confirm selling pressure.
Trade Rationale & Risk-Reward Analysis
Trade Type: Short
Entry: 1.78981
Stop Loss: 1.80996 (~200 pips above entry)
Take Profit: 1.75724 ( 325 pips below entry) Always book Profit every 10%
Risk-Reward Ratio: 1:1.6 , indicating a solid risk-adjusted trade with a favorable reward potential.
This trade capitalizes on the bearish breakdown of the rising channel, with a clear stop-loss placement and a logical take-profit target. If momentum sustains, the price could continue trending lower towards 1.75724 or even extend further.

GBPCAD is ready For a BuyHello Traders
In This Chart nzdcad HOURLY Forex Forecast By FOREX PLANET
today GBPCAD analysis 👆
🟢This Chart includes_ (GBPCAD market update)
🟢What is The Next Opportunity on GBPCAD Market
🟢how to Enter to the Valid Entry With Assurance Profit
This CHART is For Trader's that Want to Improve Their Technical Analysis Skills and Their Trading By Understanding How To Analyze The Market Using Multiple Timeframes and Understanding The Bigger Picture on the Chart

GBPCAD - Idea for a buy !!Hello traders!
‼️ This is my perspective on GBPCAD.
Technical analysis: Here we are in a bullish market structure from 4H timeframe perspective, so I look for a long. My point of interest is imbalance filled + rejection from bullish OB and institutional big figure 1.78000.
Fundamental news: Tomorrow (GMT+2) we will see results Interest Rate on CAD. News with high impact on currency.
Like, comment and subscribe to be in touch with my content!

GBPCAD Scenario 1.1.2025According to the data we have available, it is possible that the market could move slightly up to the price level of 1.81500, since the market is forming as a range, it is quite likely to expect an SFP below the low and a subsequent move up to the aforementioned level. If it does not hold support at the level of 1.81600, it is possible that the market will move up even higher.

GBPCAD Under Pressure: Targeting Key Lows with Pullback Entry!GBPCAD is clearly facing downward pressure. On the daily timeframe, we can see the trend breaking previous lows. My target is the prior low levels, with entry anticipated on a pullback in the lower timeframe. This is not financial advice.

GBPCAD Short Term Sell IdeaH4 - Bearish trend pattern
Strong bearish momentum
Until the strong resistance zone holds I expect the price to move lower further after pullbacks.

GBPCAD - Idea for a sell !!Hello traders!
‼️ This is my perspective on GBPCAD.
Technical analysis: Here we are in a bearish market structure from 4H timeframe perspective, so I look for a short. My point of interest is imbalance filled and rejection from bearish OB + level 1.77000.
Fundamental news: This week on Wednesday (GMT+2) we will see results of yearly CPI on GBP, news with high impact on currency.
Like, comment and subscribe to be in touch with my content!

GBPCAD - Potential downside move !!Hello traders!
‼️ This is my perspective on GBPCAD.
Technical analysis: Here we are in a bearish market structure from 4H timeframe perspective, so I look for a short. I expect bearish price action as we can see a rejection from resistance zone + institutional big figure 1.80000 after price filled the imbalance.
Like, comment and subscribe to be in touch with my content!

GBPCAD Bearish Momentum: Technical Analysis and Trade Idea.👀 👉 The GBPCAD has broken market structure to the downside on both the daily and four-hour charts. I’m anticipating further bearish movement, ideally following a pullback into my Fibonacci 5261.8% zone. Keep this pair on your radar during the US session tonight, as an upcoming data release could influence its movement. If the data aligns favorably and price action unfolds as outlined in the video, there may be a potential opportunity. ⚠️ This content is for educational purposes only and does not constitute financial advice.

GBP/CAD "Pound vs Canadian Dollar" Forex Market Heist Plan🌟Hi! Hola! Ola! Bonjour! Hallo!🌟
Dear Money Makers & Robbers, 🤑 💰
Based on 🔥Thief Trading style technical and fundamental analysis🔥, here is our master plan to heist the GBP/CAD "Pound vs Canadian Dollar" Forex market. Please adhere to the strategy I've outlined in the chart, which emphasizes long & Short entry. 👀 So Be wealthy and safe trade 💪🏆🎉
Entry 📈 : You can enter a trade at any point.
Stop Loss 🛑: Using the 2H period, the recent / nearest Pullbacks.
Goal 🎯: Bullish Robbers TP 1.83700
Bearish Robbers TP 1.77800
Warning⚠️ : Our heist strategy is incompatible with Fundamental Analysis news 📰 🗞️. We'll wreck our plan by smashing the Stop Loss 🚫🚏. Avoid entering the market right after the news release.
Based on the fundamental analysis 📰 I would conclude that the GBP/CAD (British Pound/Canadian Dollar) pair is: Bullish
Reasons:
Interest rate differential: The Bank of England's (BoE) interest rate (3.5%) is higher than the Bank of Canada's (BoC) interest rate (3.0%), making the GBP more attractive to investors.
Economic growth: The UK's GDP growth (1.1%) is relatively stable, while Canada's growth (1.5%) is more dependent on external factors, such as oil exports.
Brexit uncertainty: The ongoing Brexit process has led to a decline in the GBP, making it undervalued and potentially due for a rebound.
Commodity prices: Canada's economy is heavily reliant on commodity exports, and a decline in commodity prices could negatively impact the CAD.
However, it's essential to consider the following risks:
Global economic slowdown: A slowdown in global economic growth, particularly in the US and China, could negatively impact the GBP.
Oil prices: A rise in oil prices could support the CAD, as Canada is a major oil exporter.
BoC's monetary policy: The BoC's dovish stance and potential interest rate cuts could support the CAD.
Bullish Scenario:
Stronger UK economic data, such as GDP growth and inflation, supports the GBP
Decline in commodity prices, particularly oil, supports the GBP
Bearish Scenario:
Global economic slowdown and rise in oil prices weigh on the GBP
BoC's dovish stance and potential interest rate cuts support the CAD
Please note that this is a general analysis and not personalized investment advice. It's essential to consider your own risk tolerance and market analysis before making any decisions.
Take advantage of the target and get away 🎯 Swing Traders Please reserve the half amount of money and watch for the next dynamic level or order block breakout. Once it is resolved, we can go on to the next new target in our heist plan.
Keep in mind that these factors can change rapidly, and it's essential to stay up-to-date with market developments and adjust your analysis accordingly.
💖Supporting our robbery plan will enable us to effortlessly make and steal money 💰💵 Tell your friends, Colleagues and family to follow, like, and share. Boost the strength of our robbery team. Every day in this market make money with ease by using the Thief Trading Style.🏆💪🤝❤️🎉🚀
I'll see you soon with another heist plan, so stay tuned 🫂

GBPCAD - Long active !!Hello traders!
‼️ This is my perspective on GBPCAD.
Technical analysis: Here we are in a bullish market structure from 4H timeframe perspective, so I look for a long. I expect bullish price action after price rejected from bullish order block. As well we have hidden divergence for a buy and on H1 we have regular divergence.
Like, comment and subscribe to be in touch with my content!

Scenario GBPCAD update levels 11.12.24.There is a lot of liquidity left in this market, so the correction was much larger than could be expected, but I still think that if the market maintains the level of support, which is located at the price level of 1.80700-1.80500, then a short set up is possible, there are many levels below us where it is possible that we should see for now but still waiting.

GBPCAD SELL | Idea Trading AnalysisGBPCAD is moving on support zone
The chart is above the support level, which has already become a reversal point twice.
We expect a decline in the channel after testing the current level.
We expect a decline in the channel after testing the current level
Hello Traders, here is the full analysis.
I think we can soon see more fall from this range! GOOD LUCK! Great SELL opportunity GBPCAD
I still did my best and this is the most likely count for me at the moment.
-------------------
Traders, if you liked this idea or if you have your own opinion about it, write in the comments. I will be glad ⚜️

GBPCAD - Long from bullish OB !!Hello traders!
‼️ This is my perspective on GBPCAD.
Technical analysis: Here we are in a bullish market structure from 4H timeframe perspective, so I look for a long. I expect price to continue the retracement to fill that huge imbalance and then to reject from bullish OB + institutional big figure 1.79000.
Like, comment and subscribe to be in touch with my content!
