GBPCHF Analysis As our followers know (see the pinned idea below), we previously entered a short from this level and took profit successfully 💰
Now that level has been broken and we’re patiently waiting for a pullback to enter a buy position 📈
Let’s wait for confirmation before jumping in! ⏳
For detailed entry points, trade management, and high-probability setups, follow the channel:
ForexCSP
GBPCHF

GBP/CHF BEARS ARE STRONG HERE|SHORT
Hello, Friends!
GBP/CHF pair is trading in a local uptrend which we know by looking at the previous 1W candle which is green. On the 3H timeframe the pair is going up too. The pair is overbought because the price is close to the upper band of the BB indicator. So we are looking to sell the pair with the upper BB line acting as resistance. The next target is 1.094 area.
Disclosure: I am part of Trade Nation's Influencer program and receive a monthly fee for using their TradingView charts in my analysis.
✅LIKE AND COMMENT MY IDEAS✅

GBPCHF Buy Trade IdeaHello Traders
In This Chart GBPCHF HOURLY Forex Forecast By FOREX PLANET
today GBPCHF analysis 👆
🟢This Chart includes_ (GBPCHF market update)
🟢What is The Next Opportunity on GBPCHF Market
🟢how to Enter to the Valid Entry With Assurance Profit
This CHART is For Trader's that Want to Improve Their Technical Analysis Skills and Their Trading By Understanding How To Analyze The Market Using Multiple Timeframes and Understanding The Bigger Picture on the Charts

GBPCHF Will Explode! BUY!
My dear subscribers,
GBPCHF looks like it will make a good move, and here are the details:
The market is trading on 1.0989 pivot level.
Bias - Bullish
My Stop Loss - 1.0948
Technical Indicators: Both Super Trend & Pivot HL indicate a highly probable Bullish continuation.
Target - 1.1062
About Used Indicators:
The average true range (ATR) plays an important role in 'Supertrend' as the indicator uses ATR to calculate its value. The ATR indicator signals the degree of price volatility.
Disclosure: I am part of Trade Nation's Influencer program and receive a monthly fee for using their TradingView charts in my analysis.
———————————
WISH YOU ALL LUCK

GBPCHF continuation of selling pressure below 1.1070The GBPCHF currency pair continues to display a bearish outlook, in line with the prevailing downward trend. Recent price action suggests a corrective pullback, potentially setting up for another move lower if resistance holds.
Key Level: 1.1070
This zone, previously a consolidation area, now acts as a significant resistance level.
Bearish Scenario (rejection at 1.1070):
A failed test and rejection at 1.1070 would likely resume the bearish momentum.
Downside targets include:
1.0910 – Initial support
1.0860 – Intermediate support
1.0810 – Longer-term support level
Bullish Scenario (breakout above 1.1070):
A confirmed breakout and daily close above 1.1070 would invalidate the bearish setup.
In that case, potential upside resistance levels are:
1.1125 – First resistance
1.1240 – Further upside target
Conclusion
GBPCHF remains under bearish pressure, with the 1.1070 level acting as a key inflection point. As long as price remains below this level, the bias favors further downside. Traders should watch for price confirmation around that level to assess the next move.
This communication is for informational purposes only and should not be viewed as any form of recommendation as to a particular course of action or as investment advice. It is not intended as an offer or solicitation for the purchase or sale of any financial instrument or as an official confirmation of any transaction. Opinions, estimates and assumptions expressed herein are made as of the date of this communication and are subject to change without notice. This communication has been prepared based upon information, including market prices, data and other information, believed to be reliable; however, Trade Nation does not warrant its completeness or accuracy. All market prices and market data contained in or attached to this communication are indicative and subject to change without notice.

GBP-CHF Support Ahead! Buy!
Hello,Traders!
GBP-CHF keeps falling but
A strong horizontal support
Level is ahead at 1.0921
From where we will be
Expecting a rebound
And a local bullish move up
Buy!
Comment and subscribe to help us grow!
Check out other forecasts below too!
Disclosure: I am part of Trade Nation's Influencer program and receive a monthly fee for using their TradingView charts in my analysis.

GBPCHF Breaks Rising Wedge – Reversal Targets 1.0940 and 1.0815GBPCHF has broken down from a rising wedge formation on the 4H chart, signaling a shift from bullish momentum to bearish control. The pattern break comes near the 50% retracement level, with price now trading below ascending trendline support. With fundamental headwinds weighing on the British pound and safe-haven demand supporting the Swiss franc, the setup favors a short bias targeting the 1.0940 and 1.0815 zones.
🔍 Technical Analysis
Pattern: Rising wedge → broken to the downside
Breakout Confirmation: Price has closed below the wedge support (trendline)
Key Support Levels:
1.0940 → 38.2% fib + previous structure support
1.0815 → 23.6% fib retracement + horizontal support zone
1.0608 → Full wedge base (longer-term target)
Resistance / Invalidation:
1.1150 – a close back above this level invalidates the breakdown
Candle Behavior:
Bearish structure forming with lower highs
Clean engulfing candle closed below wedge
📉 Bias: Bearish (confirmed technical reversal)
🌍 Fundamental Context
🇬🇧 British Pound (GBP)
UK CPI expected to rise (3.3% forecast), which may limit BoE cuts, but not bullish enough to support GBP
Political uncertainty resurfaces (Labour slipping in polls)
BoE speakers are split; no clear support from policy
🇨🇭 Swiss Franc (CHF)
Safe-haven flows rising on:
Global growth slowdown
Tensions between U.S.–Iran
Downgrade of U.S. debt → risk aversion favors CHF
SNB remains cautious, but CHF gains defensive strength in risk-off conditions
🎯 Trade Setup
Bias: Sell
Entry Zone: 1.1080–1.1100 (breakout confirmation)
Targets:
TP1: 1.0940
TP2: 1.0815
TP3: 1.0608 (extension target)
Stop Loss: Above 1.1150
⚠️ Risk Factors
CPI surprise tomorrow could cause GBP spikes — be cautious around the release
If equities rally hard or CHF weakens globally, price could retest the wedge structure before falling
BoE hawkish surprise could challenge short-term bearish bias
🧭 Conclusion
GBP/CHF has broken out of a rising wedge — a classic bearish reversal signal. The technical break aligns with macro weakness in GBP and CHF strength in a risk-off environment. Short trades remain valid below 1.1150, targeting a drop to 1.0940 and 1.0815 in the coming sessions.

GBP_CHF RESISTANCE AHEAD|SHORT|
✅GBP_CHF is going up now
But a strong resistance level is ahead at 1.1070
Thus I am expecting a pullback
And a move down towards the target of 1.1013
SHORT🔥
✅Like and subscribe to never miss a new idea!✅
Disclosure: I am part of Trade Nation's Influencer program and receive a monthly fee for using their TradingView charts in my analysis.

GBPCHF: Long Trade Explained
GBPCHF
- Classic bullish formation
- Our team expects pullback
SUGGESTED TRADE:
Swing Trade
Long GBPCHF
Entry - 1.1005
Sl - 1.0971
Tp - 1.1064
Our Risk - 1%
Start protection of your profits from lower levels
Disclosure: I am part of Trade Nation's Influencer program and receive a monthly fee for using their TradingView charts in my analysis.
❤️ Please, support our work with like & comment! ❤️

NNFX GBPCHF Short Full SignalSignal: GBPCHF Short — Full Signal
Context:Full Signal, price broke and closed below the zone signalling breakout
Probability: Normal - Buyer bias still exists.
Risk: 1% -> buyer bias flow in volume, strong signal breakout, other CHF long sentiment so reduce risk to potential split with AUDCHF breakout down the line. GBP short is potentially 3 days late from the original move in EURGBP
R:R Plan: Potentially 5R if range allows, 75% scale-out at TP for low probability & drawdown management.
Notes:
Took this trade due to its breakout nature and full signal from the judge fortress algo. Other GBP Short setups coming from EURGBP Long (late ranged) and AUDCHF short (pending order for continuation if breaks out) so I only put 1% risk on CHF Long to make room for AUDCHF 0.5% later if it breaks the pending order.

GBPCHF Sellers In Panic! BUY!
My dear subscribers,
This is my opinion on the GBPCHF next move:
The instrument tests an important psychological level 1.1095
Bias - Bullish
Technical Indicators: Supper Trend gives a precise Bullish signal, while Pivot Point HL predicts price changes and potential reversals in the market.
Target - 1.1111
About Used Indicators:
On the subsequent day, trading above the pivot point is thought to indicate ongoing bullish sentiment, while trading below the pivot point indicates bearish sentiment.
Disclosure: I am part of Trade Nation's Influencer program and receive a monthly fee for using their TradingView charts in my analysis.
———————————
WISH YOU ALL LUCK

GBPCHF Rising Wedge bearish breakout The GBP/CHF currency pair is currently exhibiting a bearish sentiment, aligned with the broader downtrend. Recent price action shows the market is in a sideways consolidation phase, indicating a potential pause before the next directional move.
Key Trading Level: 1.1230
This level marks a prior intraday consolidation zone and serves as a critical resistance area within the current trend context.
Bearish Scenario (on rejection from 1.1230):
A failed test of 1.1230 resistance would likely reinforce bearish momentum.
Downside support targets include:
1.1100 – Initial support
1.1050 – Next structural support
1.0980 – Long-term bearish target
Bullish Scenario (on breakout above 1.1230):
A confirmed breakout and daily close above 1.1230 would invalidate the bearish structure.
In that case, potential upside targets include:
1.1300 – Key resistance level
1.1370 – Higher resistance from previous reversal zones
Conclusion
The medium-term outlook for GBP/CHF remains bearish, with 1.1230 acting as a decisive pivot level. As long as price stays below this threshold, downside continuation toward 1.1100 and beyond remains favored. However, a clear breakout above 1.1230 on a daily closing basis would shift the sentiment and open the door for a bullish correction toward 1.1300–1.1370. Traders should monitor the 1.1230 level closely for directional confirmation.
This communication is for informational purposes only and should not be viewed as any form of recommendation as to a particular course of action or as investment advice. It is not intended as an offer or solicitation for the purchase or sale of any financial instrument or as an official confirmation of any transaction. Opinions, estimates and assumptions expressed herein are made as of the date of this communication and are subject to change without notice. This communication has been prepared based upon information, including market prices, data and other information, believed to be reliable; however, Trade Nation does not warrant its completeness or accuracy. All market prices and market data contained in or attached to this communication are indicative and subject to change without notice.

GBP-CHF Wait For Breakout! Buy!
Hello,Traders!
GBP-CHF formed a bullish
Triangle pattern so we are
Locally bullish biased and
IF we see a bullish breakout
Our bullish bias will be
Confirmed and we will be
Expecting a further
Bullish continuation
Buy!
Comment and subscribe to help us grow!
Check out other forecasts below too!
Disclosure: I am part of Trade Nation's Influencer program and receive a monthly fee for using their TradingView charts in my analysis.

GBP/CHF SENDS CLEAR BEARISH SIGNALS|SHORT
Hello, Friends!
The BB upper band is nearby so GBP-CHF is in the overbought territory. Thus, despite the uptrend on the 1W timeframe I think that we will see a bearish reaction from the resistance line above and a move down towards the target at around 1.091.
Disclosure: I am part of Trade Nation's Influencer program and receive a monthly fee for using their TradingView charts in my analysis.
✅LIKE AND COMMENT MY IDEAS✅

GBP/CHF BULLS ARE GAINING STRENGTH|LONG
Hello, Friends!
GBP/CHF is trending up which is obvious from the green colour of the previous weekly candle. However, the price has locally plunged into the oversold territory. Which can be told from its proximity to the BB lower band. Which presents a classical trend following opportunity for a long trade from the support line below towards the supply level of 1.112.
Disclosure: I am part of Trade Nation's Influencer program and receive a monthly fee for using their TradingView charts in my analysis.
✅LIKE AND COMMENT MY IDEAS✅

Bullish bounce off pullback support??GBP/CHF has bounced off the pivot and could rise to the pullback resistance.
Pivot: 1.1080
1st Support: 1.1056
1st Resistance: 1.1146
Risk Warning:
Trading Forex and CFDs carries a high level of risk to your capital and you should only trade with money you can afford to lose. Trading Forex and CFDs may not be suitable for all investors, so please ensure that you fully understand the risks involved and seek independent advice if necessary.
Disclaimer:
The above opinions given constitute general market commentary, and do not constitute the opinion or advice of IC Markets or any form of personal or investment advice.
Any opinions, news, research, analyses, prices, other information, or links to third-party sites contained on this website are provided on an "as-is" basis, are intended only to be informative, is not an advice nor a recommendation, nor research, or a record of our trading prices, or an offer of, or solicitation for a transaction in any financial instrument and thus should not be treated as such. The information provided does not involve any specific investment objectives, financial situation and needs of any specific person who may receive it. Please be aware, that past performance is not a reliable indicator of future performance and/or results. Past Performance or Forward-looking scenarios based upon the reasonable beliefs of the third-party provider are not a guarantee of future performance. Actual results may differ materially from those anticipated in forward-looking or past performance statements. IC Markets makes no representation or warranty and assumes no liability as to the accuracy or completeness of the information provided, nor any loss arising from any investment based on a recommendation, forecast or any information supplied by any third-party.

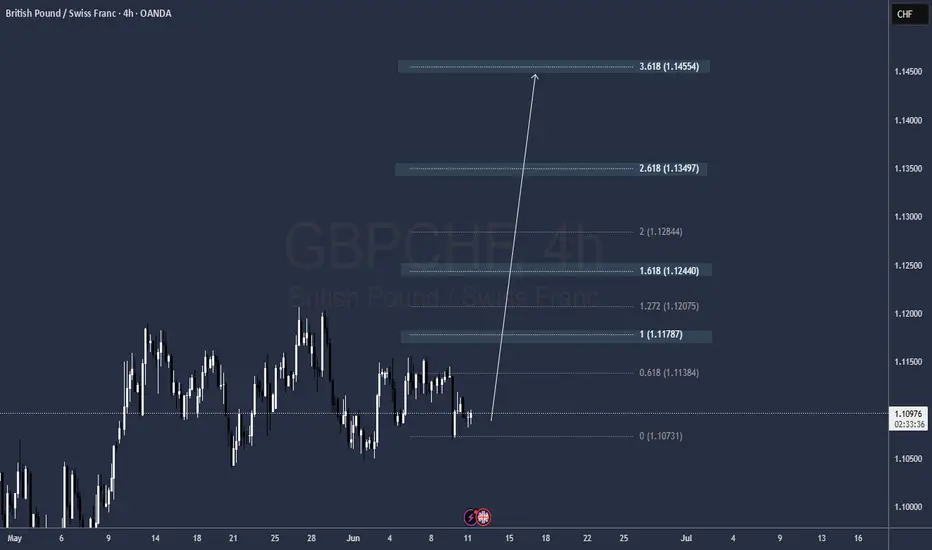
GBPCHFGBPCHF If the price can still stay above 1.10476, it is expected that the price will have a chance to adjust up. Consider buying the red zone
🔥Trading futures, forex, CFDs and stocks carries a risk of loss.
Please consider carefully whether such trading is suitable for you.
>>GooD Luck 😊
❤️ Like and subscribe to never miss a new idea!

Falling towards overlap support?GBP/CHF is falling towards the pivot, which is an overlap support, and could bounce to the 1st resistance, which acts as a pullback resistance.
Pivot: 1.1045
1st Support: 1.0921
1st Resistance: 1.1191
Risk Warning:
Trading Forex and CFDs carries a high level of risk to your capital and you should only trade with money you can afford to lose. Trading Forex and CFDs may not be suitable for all investors, so please ensure that you fully understand the risks involved and seek independent advice if necessary.
Disclaimer:
The above opinions given constitute general market commentary, and do not constitute the opinion or advice of IC Markets or any form of personal or investment advice.
Any opinions, news, research, analyses, prices, other information, or links to third-party sites contained on this website are provided on an "as-is" basis, are intended only to be informative, is not an advice nor a recommendation, nor research, or a record of our trading prices, or an offer of, or solicitation for a transaction in any financial instrument and thus should not be treated as such. The information provided does not involve any specific investment objectives, financial situation and needs of any specific person who may receive it. Please be aware, that past performance is not a reliable indicator of future performance and/or results. Past Performance or Forward-looking scenarios based upon the reasonable beliefs of the third-party provider are not a guarantee of future performance. Actual results may differ materially from those anticipated in forward-looking or past performance statements. IC Markets makes no representation or warranty and assumes no liability as to the accuracy or completeness of the information provided, nor any loss arising from any investment based on a recommendation, forecast or any information supplied by any third-party.

Bullish bounce off 61.8% Fibonacci support?GBP/CHF is falling towards the pivot, which is a pullback support and could bounce to the 1st resistance, which acts as a pullback resistance.
Pivot: 1.1093
1st Support: 1.1056
1st Resistance: 1.1180
Risk Warning:
Trading Forex and CFDs carries a high level of risk to your capital and you should only trade with money you can afford to lose. Trading Forex and CFDs may not be suitable for all investors, so please ensure that you fully understand the risks involved and seek independent advice if necessary.
Disclaimer:
The above opinions given constitute general market commentary, and do not constitute the opinion or advice of IC Markets or any form of personal or investment advice.
Any opinions, news, research, analyses, prices, other information, or links to third-party sites contained on this website are provided on an "as-is" basis, are intended only to be informative, is not an advice nor a recommendation, nor research, or a record of our trading prices, or an offer of, or solicitation for a transaction in any financial instrument and thus should not be treated as such. The information provided does not involve any specific investment objectives, financial situation and needs of any specific person who may receive it. Please be aware, that past performance is not a reliable indicator of future performance and/or results. Past Performance or Forward-looking scenarios based upon the reasonable beliefs of the third-party provider are not a guarantee of future performance. Actual results may differ materially from those anticipated in forward-looking or past performance statements. IC Markets makes no representation or warranty and assumes no liability as to the accuracy or completeness of the information provided, nor any loss arising from any investment based on a recommendation, forecast or any information supplied by any third-party.

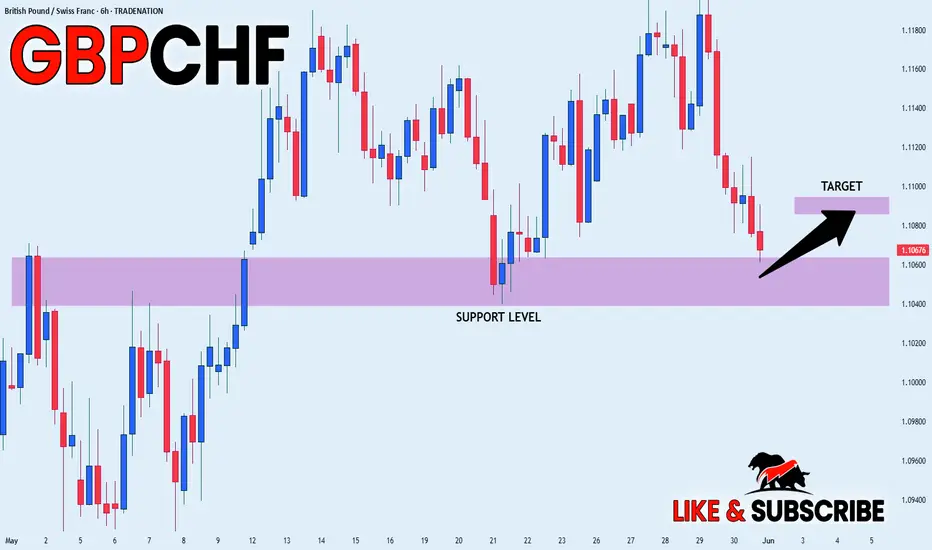
GBP_CHF POTENTIAL LONG|
✅GBP_CHF is going down now
But a strong support level is ahead at 1.1051
Thus I am expecting a rebound
And a move up towards the target of 1.1088
LONG🚀
✅Like and subscribe to never miss a new idea!✅
Disclosure: I am part of Trade Nation's Influencer program and receive a monthly fee for using their TradingView charts in my analysis.
GBPCHF: Bullish Continuation is Expected! Here is Why:
It is essential that we apply multitimeframe technical analysis and there is no better example of why that is the case than the current GBPCHF chart which, if analyzed properly, clearly points in the upward direction.
Disclosure: I am part of Trade Nation's Influencer program and receive a monthly fee for using their TradingView charts in my analysis.
❤️ Please, support our work with like & comment! ❤️

GBP-CHF Risky Long! Buy!
Hello,Traders!
GBP-CHF will soon hit
A wide horizontal support
Level around 1.1048 and
After the retest a local
Bullish rebound and a move
Up are to be expected
Buy!
Comment and subscribe to help us grow!
Check out other forecasts below too!
Disclosure: I am part of Trade Nation's Influencer program and receive a monthly fee for using their TradingView charts in my analysis.
