GBPCHF | Perspective for the new weekEnjoying a 250pips run in our direction on my last publication (see link below for reference purposes) on this pair, It appears we have another trading opportunity here-with.
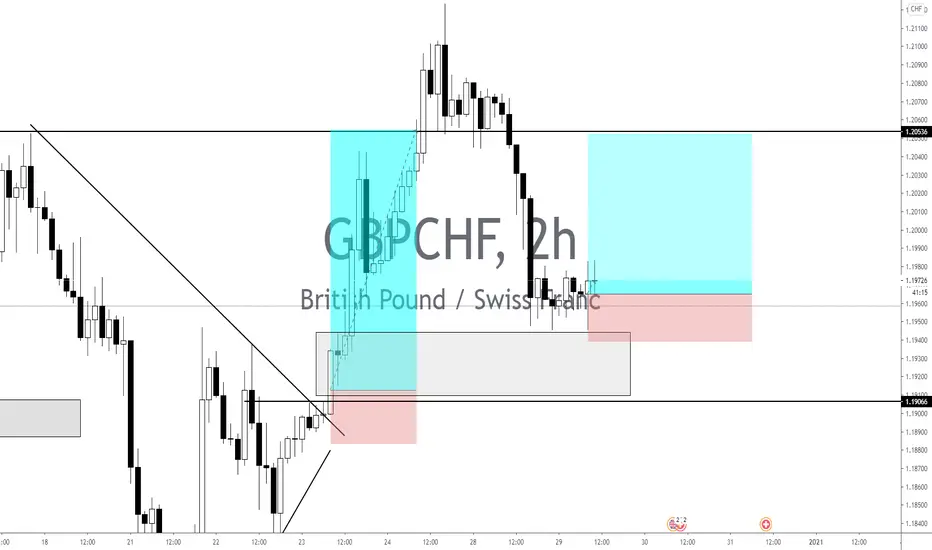
The Pound to Swiss Franc (GBP/CHF) exchange rate holds steady as the price continues to respect Demand level @ Fr1.19300 in the last couple of weeks. Even though the Sterling continues to struggle against many of its peers, Chancellor of the Exchequer - Rishi Sunak unveiled a £4.6 billion relief packaged for the retail and hospitality sectors which "might" be a buffer as I am expecting an appreciation in value in the coming week(s) despite a possible Swiss National Bank (SNB) intervention reiterated at their recent policy meeting of 2020.
Tendency: Uptrend ( Bearish )
Structure: Double Bottom | Breakout | Supply & Demand | (50/61.8%) Retracement
Observation: i. We experienced a successful Breakout of Fr1.19500 (23rd Dec, 2020) followed by a rejection of this level twice!
ii. Demand level @ Fr1.19500 has been holding strong for buyers in the last 13days as expectations of Higher Highs build up.
iii. It is also worthy to note that demand level is holding a 50% retracement (with the possibility of hitting 61.8% open) of the Impulse leg after the Double Bottom @ Fr1.17200.
iv. It is pertinent to state here that our "caution" tentacle MUST be on standby as we might expect retracement into Fr1.18560 for a buying window.
Trading plan: BUY confirmation with a minimum potential profit of 220 pips.
Risk/Reward : 1:3
Potential Duration: 3 to 7 days
NB: This speculation can be considered to make decisions on lower timeframes.
Watch this space for updates as price action is been monitored.
Risk Disclaimer:
Margin trading in the foreign exchange market (including foreign exchange trading, CFDs, etc.) has a high risk and is not suitable for all investors. The content of this speculation (including all data) is organized and published by me for the sole purpose of education and assistance in making independent investment decisions. All information herein is for your reference only and I take no responsibility.
You are hereby advised to carefully consider your investment experience, financial situation, investment objective, risk tolerance level, and consult your independent financial adviser as to the suitability of your situation prior to making any investment.
I do not guarantee its accuracy and is not liable for any loss or damage which may result directly or indirectly from such content or the receipt of any instruction or notification therewith.
Past performance is not necessarily indicative of future results.
Gbpchfanalysis


GBPCHF - ArtworkThis pair is perfect for analyzing.
You will notice the previous structure got attacked and GBPCHF was forced to create new double top highs.
I still think this pair will follow the route of the ascending channel after bouncing from the horizontal line, we just need to give it time.


GBPCHF Long Trade SetupHey traders, here is the analysis for the GBPCHF. NOTE - Please do your own analysis before taking the trade. Let me know if you guys have any questions in the comment section. If you guys like my analysis please hit like. Thanks.


BUY BUY BUYHello team, we currently in a buy in this bullish symmetric triangle. In an uptrend, price action finds first resistance, which will be the highest high in the
pattern, where it reverses direction and goes downwards till finding first support, which
will be the lowest low in the pattern.
• Price action reverse direction from support going upwards, till finding the second
resistance , which must to be lower than the first resistance .
• Price action reverse direction from resistance going downwards, till finding the second
support , which must to be higher than the first support .
• The pattern is completed when price action reverse direction from and goes upwards till
it breaks the triangle's upper border at point .


BUY as we can see price was not able to form a new lows now we can all see price broke my downtrend resistant now it formed a new high which indicate a new trend so i would go for a buy to catch the 3 run of the trend

GBPCHF BUYING FROM SUPPORTAs we can see gbpchf has reached @ strong support zone and now we are buying this pair with a small risk and higher rewards
as you can see we had a huge gain on our previous analysis on GBPCHF ALL TP3 HIT
friend we need ur love and ur love is just push like and comments
follow us for more updates


GBP/CHF SELL IDEAHey tradomaniacs,
welcome to a new free trading-setup.
Note: This is meant to be a preparation! As always we will have to wait for a confirmation!
Important:
ALL POUND-TRADES are currently very risky as Brexit-Negotiations are to be continued and the outcome is not clear.
Since a No-Deal is more likely to happen and technical aspects for GBP/CHF are very bearish we could consider to give this trade a try with a low risk.
GBP/CHF: Daytrade-Preparation
Market-Sell: 1,18755
Stop-Loss: 1,19350
Point-Of-Risk-Reduction: 1,18215
Take-Profit: 1,17535
Stop-Loss: 60 pips
Risk: 0,5%
Risk-Reward: 2,0
LEAVE A LIKE AND A COMMENT - I appreciate every support! =)
Peace and good trades
Irasor
Wanna see more? Don`t forget to follow me.

GBPCHF uptrend setupprice direction: UPTREND
potential target price: 1.2023
**Disclaimer** the content on this analysis is subject to change at any time without notice, and is provided for the sole purpose of assisting traders to make independent investment decisions.
Traders!! if you like my ideas and do take the same trade as I do, please write it in a comment so we can manage the trade together.
_____________________________________________________________________________________________________________________
Thank you for your support ;)
GWBFX

GBPCHF, SELL On H4Trend : Down
Tendency : Downward
Below Resistance
After retest and confirmation
=> SELL


GBPCHF | perspective for the new weekHopes of Brexit deal wanes again; GBPCHF sinking back towards lows as it finds a haven for selling pressure around Fr1.20300.
Tendency: Downtrend ( Bearish )
Structure: Breakdown | Supply & Demand | Harmonic (AB = CD)
Observation: i. Since completion of Double Top pattern in late Nov. 2020, price continues to risk further decline.
ii. Previous safe haven for Buyers was finally broken last week as price tested Fr1.19100 before making a corrective move.
iii. As price touches 50% retracement of AB leg, a possible Harmonic pattern AB = CD appears to metamorphosize in the coming week(s).
iv. AB = CD pattern shall guide me through the path price action takes in the coming week.
ii. ABCD pattern parameters explained below;
a. Impulse A-to-B will be in harmony with the potential C-to-D leg.
b. The B- to-C leg is at 50% currently (with a possible 61.8 or 78.6% in the future)Fibonacci retracement of the A-to-B leg.
c. The C-to-D leg is expected to fall within 127.2 - 1.414% Fib. ext. of the A-to-B move.
Trading plan: SELL confirmation with a minimum potential profit of 250 pips.
Risk/Reward: 1:3
Potential Duration: 1 to 5 days
NB: This speculation can be considered to make decisions on lower timeframes.
Watch this space for updates as price action is been monitored.
Risk Disclaimer:
Margin trading in the foreign exchange market (including foreign exchange trading, CFDs, etc.) has a high risk and is not suitable for all investors. The content of this speculation (including all data) is organized and published by me for the sole purpose of education and assistance in making independent investment decisions. All information herein is for your reference only and I take no responsibility.
You are hereby advised to carefully consider your investment experience, financial situation, investment objective, risk tolerance level, and consult your independent financial adviser as to the suitability of your situation prior to making any investment.
I do not guarantee its accuracy and is not liable for any loss or damage which may result directly or indirectly from such content or the receipt of any instruction or notification therewith.
Past performance is not necessarily indicative of future results.

GBPCHF BUY OPPORTUNITYI suppose GBPCHF will increase from the point shown in the idea post to the higher levels in daily timeframe.


GBPCHF SELL PLANGBPCHF H4 CHART.
If you find my analysis useful, you can support it by liking and commenting.
