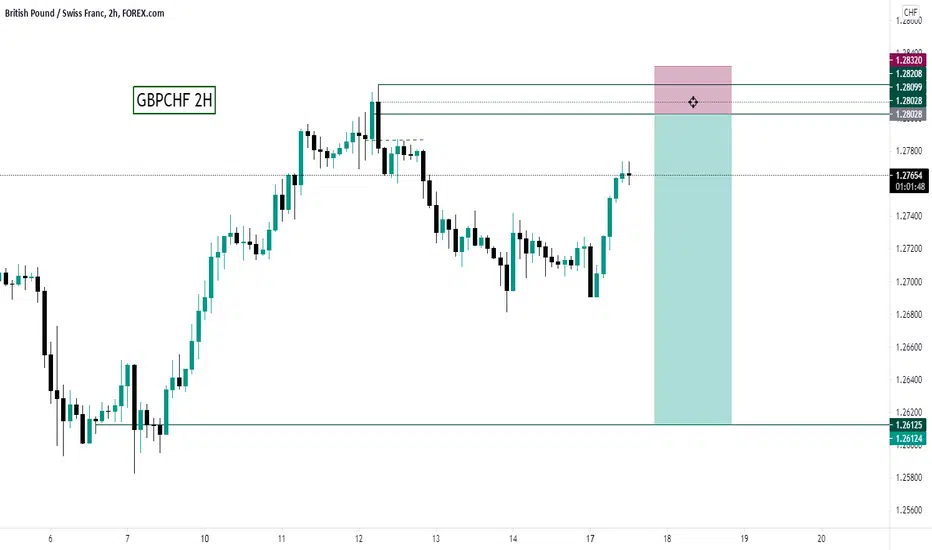
GBPCHF Preparing for SHORT ✅Lovely order on GBPCHF R:R 1:5
‼️Attention‼️ As soon as we get 50%✅ in profit, SL❌ to entry point & Save profit
Clear setup
@FxShzd trading style doesn't care about win rate only thing cares is Risk to Reward
Lets make trading simple W/ @FxShzd
Any question comment bellow
Gbpchfsell


Trading Idea Regrading GBPCHF Currency PairIn My Opinion This is another High Probability Trading Set Up Regarding GBPCHF Currency Pair.

GBPCHF H4 TIMEFRAME ANALYSIS (SELL)We expect to sell this pair because it is experiencing a strong resistance upward and the New Jerusalem Indicator is turning red so we sell while hoping to make profit of 5R (risk to reward ratio). We KNOW WHAT WE ARE DOING AND WE DO WHAT THE MARKET IS DOING. This is more than an institutional analysis. Invest at your own risk. Hope you will come back with happy face on this one also. More success for you. All the best.

Set up sell limit with GBPCHFH1 Time Frame
Structure: Downtrend
Divergence signal
Break Key level
-------------------------------------------------------------------------
Set up Sell Limit:
Sell limit: 1.27150
Stop Loss: 1.27596
Take Profit: 1.25719
-------------------------------------------------------------------------
Wish you all have a good trading day!

GbpChf- to fall from resistanceAfter 3 weeks of consolidation, GbpChf broke under support last week
At this moment the pair has come to confirm this break and there is a high probability of a new leg down
A daily close above this now resistance would negate this scenario

🔴 GBPCHF [H4] Looking for sideway 🔴 GBPCHF Looking for sideway
Now GBPCHF prices in TF H4 have a sideway so the easiest trade is to follow this pattern.
Open Sell when price hits resistance and PA Bearlish occurs and open Buy when price hits support.
🚩🚩 Stoploss should be above the support or resistance as the pattern formed.
find more forex & crypto weekly forcast on my youtube channel
Goodluck Trader
Ton Trader
💲💲💲💲💲💲💲💲💲💲

GBPCHF, 4hr tf, sell the end of wave-4
This pair also retracing to complete wave-4. Just like my other setup i shared today. Check it out as well.
We might see another drop soon from this pair. As this trade providing 4R trade setup, it is worth to try it.
Sell GBPCHF 1.2690
Stop loss 1.2725
Take profit 1.2535 (4.4R)
Use only 1-2% risk
Good luck

GBPCHF BEARISH GBPCHF was preparing for another crash. Already 100,200 EMA dynamic support axes have been broken. It can be a bit risky deal

GBPCHF-Short#GBPCHF market is moving in horizontal channel. And has not able to cross support. So the market is going to sell in the H4 timeframe.

GBPCHF is in BEARISHThe market has rejected its major resistance and from that level market is started to fall to its very near support.

GBPCHF shorts into 1.2680GBPCHF is at weekly resistance and has just formed a bearish engulfing formation pattern. I believe it is overstretched to the upside and that a retracement is inbound. 90 pip target. Let's see how it goes!


GBPCHF: short opportunityHi Traders,
This is my view on this pair for the next few days.
#GBPCHF
SELL 1.2756
SL 1.27838
TP 1.262
I remind you that this is only a forecast based on what current data are.
Therefore the following signal will be activated only if specific rules are strictly respected.
If you follow my strategy you will be able to identify the right filters and triggers to enter correctly the market and avoid fake signals.
I really hope you liked this video and I would like to know what do you think about this analysis, so please use the comment section below this video to give me your point of view.
Thank You
———————————
Pietro from Trading Kitchen

GBPCHF 90% WILL IGNORE THIS SETUPbreak of structure for potential downside movement {plus the daily time frame the price is approaching the equal highs meaning we might see sellers ,
THE WAY IN WHICH WE WILL USE TO APPROACH THIS IS ALWAYS BY BEING REACTIVE AND NOT PREDICITVE - NO CONFRIMATION - NO ENTRY .
GBPCHF SHORT IDEAas we can see price forming a double top pattern. we can look for a sell here as price respected the resistance before and we can see a big falling till around 200+ pips and going with a 1:3 .lets see what market gives us

GBPCHF: short opportunity on DailyHi Traders,
This is my view on this cross for the next few days.
#GBPCHF
SELL 1.27645
SL 1.30053
TP 1.2285
I remind you that this is only a forecast based on what current data are.
Therefore the following signal will be activated only if specific rules are strictly respected.
If you follow my strategy you will be able to identify the right filters and triggers to enter correctly the market and avoid fake signals.
I really hope you liked this video and I would like to know what do you think about this analysis, so please use the comment section below this video to give me your point of view.
Thank You
———————————
Pietro from Trading Kitchen

GBPCHF LONG TERM PROJECTIONgbpchf needs a correction wave in weekly /daily timeframe.. impulse move is almost exhausted

GBPCHF - SHORT; SELL it!This pair should tank from here for the better part of this Century - and may be even the next.

GBPCHF: SELL NOWGBPCHF has broken the support and become resistance.
I have position for sell.
Sell
1.27860 - 1.28058
TP1: 1.26947
TP2: 1.25911
SL: 1.28189
Good Luck

THE MELTDOWN Hello team, GBPCHF has been in an uptrend for several weeks. We have side in a distribution stage. will be having a short bias on this pair as the bearish engulfing has printed.
Always be reactive and never predictive


GBPCHF 4H 340pip SELL. For week starting 29.3.21Wagwarn my slimes please leave feedback to help me improve and trade safe.
We're looking at GBPCHF here which is very very overbought so we're looking at a nice sell. We may be abit late to this move but market open will delay if a bit for sure with some volatility and spread AIDS.
Price has been ranging since the 11th March and we've seen that resistance tested 6 times since then telling us it's super strong so we can definitely expect price to reject this time around. I'll be looking to short this right after the next candle close after market open (as long as the spreads have reduced).
We can see hidden bearish divergence which is much stronger on the stochastic than it is on the actual price chart - let's remember divergence is binary so it's happening or it isn't. Our stochastic indicator is super high at 92.5 (at it's peak) which is the highest it's been in a long while so we can definitely expect a big sell move on it's way.
TDI is supporting this move nicely, The red line has recently crossed over the green line right at the top of the channel just under the top band, showing that the bulls have taken over and that price is currently overbought. The red line broke out above the Bollinger bands (shark out of the water) which is another indication price is massively overbought meaning a sell is coming. Even further, the TDI's Bollinger bands are diverging, showing that volatility is increasing- hopefully this is the end of the ranging period.
I would set my TPs as so:
TP1: 1.287 60pips
TP2: 1.278 150pips
TP3 (runner): 1.2587 340pips
If you ask me this move is going to happen on monday or tuesday so keep a careful eye on this pair as these confluences are interesting.
Have a good week
Vince / Vmoney
