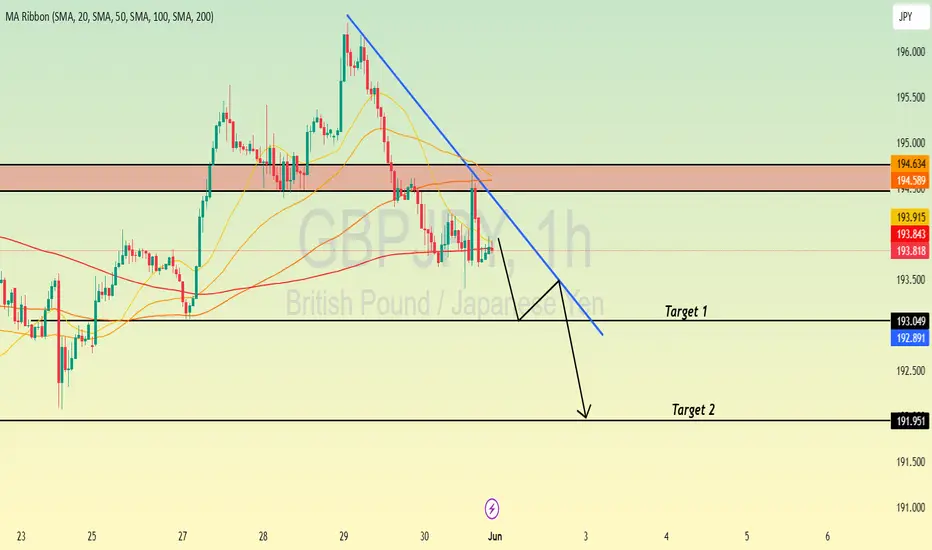
GBPJPY LONG FORECAST Q2 W23 D3 Y25GBPJPY LONG FORECAST Q2 W23 D3 Y25
Professional Risk Managers👋
Welcome back to another FRGNT chart update📈
Diving into some Forex setups using predominantly higher time frame order blocks alongside confirmation breaks of structure.
Let’s see what price action is telling us today!
💡Here are some trade confluences📝
✅Daily order block
✅15' order block
✅Intraday breaks of structure
✅4H 50 EMA rejection
🔑 Remember, to participate in trading comes always with a degree of risk, therefore as professional risk managers it remains vital that we stick to our risk management plan as well as our trading strategies.
📈The rest, we leave to the balance of probabilities.
💡Fail to plan. Plan to fail.
🏆It has always been that simple.
❤️Good luck with your trading journey, I shall see you at the very top.
🎯Trade consistent, FRGNT X
GBPJPY

GBPJPY Potential UpsidesHey Traders, in the coming week we are monitoring GBPJPY for a buying opportunity around 193.300 zone, GBPJPY is trading in an uptrend and currently is in a correction phase in which it is approaching the trend at 193.300 support and resistance area.
Trade safe, Joe.

GBP/JPY Dips in Tokyo & London—What’s Next for Price Action?FenzoFx—GBP/JPY dipped from 194.6 during the Tokyo and London sessions, now trading around 193.1. Price is testing support near the May 27 low, ahead of the New York session.
A bounce from 193.0 could push GBP/JPY toward 193.5, with a bullish wave possible if price closes above that level, targeting 194.6. However, stabilizing below 193.0 would invalidate this outlook, with the next bearish target at 192.5.

Yen Strength Persists: GBP/JPY Faces Downward PressureGBPJPY is dropping in worth vs the Japanese Yen since the Federal Reserve in the US is expected to lower interest rates while the Bank of Japan might increase them. This increases the appeal of the yen for investors. One pound will get you 193.54 Yen today, having dropped as low as 193.44 earlier today. Experts expect this negative trend to persist as long as the price remains below 194.60.
With the Fed keeping higher rates (4.25%-4.5%) and hinting at a conservative approach to rate cuts given ongoing inflation, the Federal Reserve and the Bank of Japan are on opposite monetary policy directions. The BOJ has kept its policy rate much lower (0.5%), but hinted at possible tightening. Particularly in the USD/JPY pair, this separation has affected currency volatility, with possible yen appreciation should the BOJ turn hawkish or the Fed become more dovish. Key drivers for investor strategies are market expectations and economic data releases in both countries, however some experts argue that the impact of this difference may be less strong than in past cycles because of more general global economic conditions.
The GBP/JPY pair is trading below 55 and 200 EMA (Short-term) and above 365 EMA (long-term on the 1-hour chart, confirming a mixed trend. Any violation below 193.40 indicates the intraday trend is weak. A dip to 192.85/192/191.70/191 /190 is possible. Immediate resistance is at 194.30, a breach above this level targets of 194.60/195/196.50/.
Market Indicators (1- hour)
CCI (50)- Bearish
Directional movement index - Bearish
Trading Strategy: Sell on rallies
It Is good to sell on rallies around 194 with SL around 195 for a TP of 192.

GBPJPY Is Very Bullish! Long!
Please, check our technical outlook for GBPJPY.
Time Frame: 7h
Current Trend: Bullish
Sentiment: Oversold (based on 7-period RSI)
Forecast: Bullish
The price is testing a key support 192.683.
Current market trend & oversold RSI makes me think that buyers will push the price. I will anticipate a bullish movement at least to 194.257 level.
P.S
We determine oversold/overbought condition with RSI indicator.
When it drops below 30 - the market is considered to be oversold.
When it bounces above 70 - the market is considered to be overbought.
Disclosure: I am part of Trade Nation's Influencer program and receive a monthly fee for using their TradingView charts in my analysis.
Like and subscribe and comment my ideas if you enjoy them!

GBPJPY: Bullish 5-0 Setup on the 4-Hourly ChartFrom a higher-timeframe perspective, GBPJPY might seem like it's perfect for a shorting opportunity, but that doesn't mean there aren't great opportunities to go long as well.
Right now, on the 4-hourly chart, I've spotted an interesting Bullish 5-0 setup. To many traders, this might look like an invalid entry. But here’s the catch—if you know how to interpret candlestick patterns correctly, this is exactly the kind of setup that can pay off.
Here’s the Plan:
Bullish 5-0 Pattern Entry: Keep an eye on candlestick confirmations at the current zone.
Risk Management: Identify the key levels clearly—once price reaches these levels, shift your stops to entry to achieve a risk-free trade.
Key Reminder:
It’s not always about being right in direction; it’s about spotting clear entry setups, managing your risk effectively, and protecting your capital.
👉 Golden Rule: Secure a risk-free trade as soon as possible!
Have you traded the Bullish 5-0 before? Do you have similar experiences spotting opportunities against the broader trend?
Let’s discuss below! Happy trading, everyone! 🚀

GBP)JPY) Technical analysis setup Read The ChaptianSMC trading point update
Technical analysis of GBP/JPY (British Pound / Japanese Yen) on the 3-hour timeframe using Smart Money Concepts (SMC) and structure-based patterns.
---
Market Overview
Current Price: 193.808
EMA 200: 193.100 (acting as dynamic support)
RSI (14): 42.24 → Neutral/Bearish territory
---
Two Possible Scenarios (Bullish & Bearish)
Bullish Scenario
Zone of Interest: 193.1–193.5 (support area)
Price is hovering just above the support level and 200 EMA.
Double green arrows mark previous rejections = demand zone.
If price respects support and forms a higher low:
Possible rally to:
First Target: 196.415
Second Target: 198.838
Bearish Scenario
If price breaks below the yellow support zone and 200 EMA:
Clean path down to:
Target Point: 190.098 (marked strong support zone)
---
Zones of Importance
Support Level: 193.0–193.5 (minor support, under retest)
Strong Support Level: ~190.1 (high probability bounce zone)
Target Resistances:
196.415 (intermediate high)
198.838 (major resistance / swing high)
---
Trade Plan Summary
Direction Entry Zone SL Target R/R Potential
Long 193.1–193.5 Below 193.0 196.4 / 198.8 1:2 to 1:3+
Short Below 193.0 Above 194.0 190.1 1:2+
Mr SMC Trading point
---
Additional Notes
Watch price action closely at the support zone before entry.
RSI shows some bearish momentum but not oversold yet.
The outcome may be influenced by JPY strength and macro events (check economic calendar).
pales support boost 🚀 analysis follow)

GBPJPY is in the Down TrendHello Traders
In This Chart GBPJPY HOURLY Forex Forecast By FOREX PLANET
today GBPJPY analysis 👆
🟢This Chart includes_ (GBPJPY market update)
🟢What is The Next Opportunity on GBPJPY Market
🟢how to Enter to the Valid Entry With Assurance Profit
This CHART is For Trader's that Want to Improve Their Technical Analysis Skills and Their Trading By Understanding How To Analyze The Market Using Multiple Timeframes and Understanding The Bigger Picture on the Charts
Double Reject @ March Resistance Spells Good News For GJ BearsOANDA:GBPJPY struggles to reach Higher Prices then that of the High created on March 27th and leads me to believe we could see a Double Top Pattern in the making!
Confirmation of the Pattern will come when:
1) Price declines back to 191.877
&
2) Makes a Breakout of the Confirmation
Once the Pattern is Confirmed and Breakout is Validated:
- This should deliver great Short opportunities as a Double Top Breakout & Retest Set-up!

GBPJPY Weekly overview Jun 1, 2025 – Jun 7, 2025BOJ Gov Ueda Speaks could make market move faster in its direction. avoid trading around his speech.
*******************************************************************
The indicated levels are determined based on the most reaction points and the assumption of approximately equal distance between the zones.
Some of these points can also be confirmed by the mathematical intervals of Murray.
You can enter with/without confirmation. IF you want to take confirmation you can use LTF analysis, Spike move confirmation, Trend Strength confirmation and ETC.
SL could be placed below the zone or regarding the LTF swings.
TP is the next zone or the nearest moving S&R, which are median and borders of the drawn channels.
*******************************************************************
Role of different zones:
GREEN: Just long trades allowed on them.
RED: Just Short trades allowed on them.
BLUE: both long and short trades allowed on them.
WHITE: No trades allowed on them! just use them as TP points

GBPJPY - Monday's Action Could Spark Upside MoveThe GBP/JPY pair is currently positioned at a critical juncture around the 193.902 level, sitting near important support zones that have been highlighted on the chart. The currency pair has shown considerable volatility over the past month, with price action oscillating between well-defined support and resistance levels, creating a clear range-bound structure. As we approach Monday's trading session, the focus will be on whether the current support level can withstand any potential selling pressure. If this support zone holds firm and buyers step in to defend these levels, we could see a significant move to the upside, potentially targeting the upper resistance zone around the 196+ area that has previously capped rallies. The technical setup suggests that a successful defense of support could trigger renewed bullish momentum, making Monday's price action crucial for determining the pair's short-term directional bias and whether it can break out of its recent consolidation pattern.
Disclosure: I am part of Trade Nation's Influencer program and receive a monthly fee for using their TradingView charts in my analysis.

GBP-JPY Growth Ahead! Buy!
Hello,Traders!
GBP-JPY is trading in an
Uptrend along the rising
Support line and the pair
Will soon retest is to we
Will be expecting a rebound
And a bullish move up on Monday
Buy!
Comment and subscribe to help us grow!
Check out other forecasts below too!
Disclosure: I am part of Trade Nation's Influencer program and receive a monthly fee for using their TradingView charts in my analysis.

GBPJPY Technical Analysis! SELL!
My dear subscribers,
This is my opinion on the GBPJPY next move:
The instrument tests an important psychological level 195.61
Bias - Bearish
Technical Indicators: Supper Trend gives a precise Bearish signal, while Pivot Point HL predicts price changes and potential reversals in the market.
Target - 193.94
My Stop Loss - 196.32
About Used Indicators:
On the subsequent day, trading above the pivot point is thought to indicate ongoing bullish sentiment, while trading below the pivot point indicates bearish sentiment.
Disclosure: I am part of Trade Nation's Influencer program and receive a monthly fee for using their TradingView charts in my analysis.
———————————
WISH YOU ALL LUCK

GBP_JPY RISING SUPPORT|LONG|
✅GBP_JPY is trading along the rising support
And as the pair will soon retest it
I am expecting the price to go up
To retest the supply levels above at 194.500
LONG🚀
✅Like and subscribe to never miss a new idea!✅
Disclosure: I am part of Trade Nation's Influencer program and receive a monthly fee for using their TradingView charts in my analysis.

GBPJPY Is Very Bullish! Buy!
Take a look at our analysis for GBPJPY.
Time Frame: 4h
Current Trend: Bullish
Sentiment: Oversold (based on 7-period RSI)
Forecast: Bullish
The market is testing a major horizontal structure 193.933.
Taking into consideration the structure & trend analysis, I believe that the market will reach 195.006 level soon.
P.S
The term oversold refers to a condition where an asset has traded lower in price and has the potential for a price bounce.
Overbought refers to market scenarios where the instrument is traded considerably higher than its fair value. Overvaluation is caused by market sentiments when there is positive news.
Disclosure: I am part of Trade Nation's Influencer program and receive a monthly fee for using their TradingView charts in my analysis.
Like and subscribe and comment my ideas if you enjoy them!

GBPJPYHello everyone,
Today’s first trade signal comes from GBPJPY. I’ve set three different target levels for this trade. Feel free to close the position at any of these levels depending on your strategy.
🔍 Trade Details:
✔️ Timeframe: 15-Minute
✔️ Risk-to-Reward Ratio: 1:1 / 1:1.50 / 1:2
✔️ Trade Direction: Sell
✔️ Entry Price: 193.987
✔️ Take Profit: 193.602
✔️ Stop Loss: 194.179
🔔 Disclaimer: This is not financial advice. I’m simply sharing a trade I’ve taken based on my personal trading system, strictly for educational and illustrative purposes.
📌 Interested in a systematic, data-driven trading approach?
💡 Follow the page and turn on notifications to stay updated on future trade setups and advanced market insights.

GBPJPY INTRADAY capped at 196.50The GBP/JPY currency pair continues to display a bearish outlook, in line with the prevailing downward trend. Recent price action suggests a corrective pullback, potentially setting up for another move lower if resistance holds.
Key Level: 196.50
This zone, previously a consolidation area, now acts as a significant resistance level.
Bearish Scenario (rejection at 196.50):
A failed test and rejection at 196.50 would likely resume the bearish momentum.
Downside targets include:
194.20 – Initial support
193.00 – Intermediate support
191.90 – Longer-term support level
Bullish Scenario (breakout above 196.50):
A confirmed breakout and daily close above 196.50 would invalidate the bearish setup.
In that case, potential upside resistance levels are:
197.50 – First resistance
198.30 – Further upside target
Conclusion
GBP/JPY remains under bearish pressure, with the 196.50 level acting as a key inflection point. As long as price remains below this level, the bias favors further downside toward the 194.20–191.90 region. However, a sustained break above 196.50 would shift sentiment bullish, targeting 197.50 and beyond. Traders should watch for price confirmation around 196.50 to assess the next move.
This communication is for informational purposes only and should not be viewed as any form of recommendation as to a particular course of action or as investment advice. It is not intended as an offer or solicitation for the purchase or sale of any financial instrument or as an official confirmation of any transaction. Opinions, estimates and assumptions expressed herein are made as of the date of this communication and are subject to change without notice. This communication has been prepared based upon information, including market prices, data and other information, believed to be reliable; however, Trade Nation does not warrant its completeness or accuracy. All market prices and market data contained in or attached to this communication are indicative and subject to change without notice.

Trading balanceTrading balance The price of the asset has rebounded from the balance zone. With the prospect of growth into the resistance zone.
GBP/JPY Elliott Wave Count Warns of Impending Sell-OffThe GBP/JPY pair has just completed a 5-wave downtrend, which ended around early April. Since then, the price has been moving higher in what appears to be a typical A-B-C corrective pattern — a common move that occurs after a major downtrend in Elliott Wave Theory.
We are currently in the final wave (C) of this correction, and within that, it appears that Wave 5 of C is now unfolding. This final wave appears to be nearing its end, and the price is approaching a strong resistance area between 196.813 and 197.513.
T1: 193.735
T2: 192.133
SL: 198.252
❌ Invalidation Level:
If the price closes above 198.252, this Elliott Wave count is likely wrong. That could mean the market is preparing for a bigger rally instead.

USDCAD BULLISH OR BEARISH DETAILED ANALYSIS ??USDCAD continues to follow the predicted bearish path, currently trading around 1.38300, and still moving gradually toward our target zone of 1.34300. After a strong bearish impulse from the 1.40391 supply zone, price has consistently formed lower highs, confirming selling pressure and market intent. The recent bounce was shallow, and price is respecting previous resistance levels perfectly, validating the bearish continuation setup.
Fundamentally, the Canadian dollar is gaining strength off rising oil prices and improving economic data from Canada, while the US dollar remains under pressure as the market begins pricing in a potential Fed rate cut in the second half of 2025. With softer US economic indicators including lower consumer confidence and slowing GDP growth, the momentum clearly favors CAD in this pair. The divergence in monetary policy outlooks between the Bank of Canada and the Federal Reserve adds further downside bias to USDCAD.
Technically, the structure remains bearish, with a clean breakdown below the 1.3900 psychological level and clear rejection at the 1.40300 resistance zone. Market liquidity appears to be shifting below the current price, and with the pair printing consistent lower highs and lower lows, there's significant space toward our target zone near 1.34128. A rejection from the minor pullback zone between 1.38800–1.39000 could provide another entry opportunity for trend continuation traders.
USDCAD remains a high-probability short setup in line with both technical structure and current fundamentals. As long as price stays below the 1.40300 resistance, I expect the bearish trend to continue with increased momentum as we approach summer liquidity shifts. This trade is already deep in profit and aligns with key institutional selling zones, making 1.34300 a realistic and conservative target in the coming weeks.

GBP/JPY 4H Chart Analysis – Bullish Channel Setup📈 Trend:
Price is moving in an ascending channel
🔵 Support line below
🔴 Resistance line above
---
Key Zones & Levels:
📍 Demand Zone (Buy Area):
Between 191.753 – 194.016
Price might bounce here before continuing up
🔵 Likely pullback expected here
🎯 Target Point:
202.500
🚀 If price respects the demand zone, this is the upside target
🟢 Entry Point:
Around 193.964 – 194.016
Optimal buying zone before the projected rise
❌ Stop Loss:
Below 191.700
🛑 Placed to minimize losses if price breaks down
---
Indicators:
📉 EMA (70):
Currently at 192.816
✅ Acting as dynamic support
---
Trade Plan Summary:
🔄 Wait for a retracement into the Demand Zone
🛒 Enter long near 193.964
⛔ Stop loss at 191.700
🎯 Target at 202.500

GBP/JPY) Bullish pullback analysis Read The ChaptianSMC trading point update
Tchnical analysis for GBP/JPY (British Pound / Japanese Yen) on the 4-hour timeframe. Here’s a breakdown of the trading idea and structure:
---
Key Technical Elements:
1. Support Zones:
Orderblock Zone (small yellow box near 192.15): Price is currently hovering around this area, which acts as a demand zone.
Main Support Level (larger yellow zone around 190.00): A deeper pullback may test this level if the orderblock fails.
2. EMA 200 (192.167):
Price is fluctuating around the 200 EMA, showing indecision.
A strong bounce above this moving average could indicate bullish momentum resuming.
3. RSI Indicator:
RSI is neutral (~47.80), leaving room for upside movement without being overbought.
4. Projected Price Path:
Two potential bullish scenarios:
A bounce from the orderblock leads straight to a rally.
A deeper dip into the support level forms a double bottom or liquidity grab, followed by a strong reversal.
5. Target Point:
The projection shows price rising to 196.368, which is a prior high and significant resistance.
---
Trade Idea Summary:
Bias: Bullish
Entry Zone:
Primary: Around 192.15 (orderblock)
Secondary (deeper entry): Around 190.00 (support level)
Confirmation: Bullish engulfing candle or strong wick rejection near entry + price reclaiming 200 EMA
Target: 196.368
Invalidation: Break and close below 189.80 (support zone violated)
Mr SMC Trading point
---
Risk Management & Notes:
Good R:R potential if entering near support with a stop below 189.80.
Watch for confirmation before entry — especially if price dips to the lower support.
Macroeconomic events (UK or Japan central bank decisions) could impact volatility.
Pales support boost 🚀 analysis follow)

GBPJPY is Holding above the SupportHello Traders
In This Chart GBPJPY HOURLY Forex Forecast By FOREX PLANET
today GBPJPY analysis 👆
🟢This Chart includes_ (GBPJPY market update)
🟢What is The Next Opportunity on GBPJPY Market
🟢how to Enter to the Valid Entry With Assurance Profit
This CHART is For Trader's that Want to Improve Their Technical Analysis Skills and Their Trading By Understanding How To Analyze The Market Using Multiple Timeframes and Understanding The Bigger Picture on the Charts
