NZDCAD BULLISH OR BEARISH DETAILED ANALYSIS ??NZDCAD is currently coiling within a textbook bullish flag formation after an aggressive impulsive leg to the upside. Price action remains tight inside this consolidation structure, respecting both trendline resistance and support. As we approach the apex of this flag, I’m closely watching for a breakout confirmation to trigger the next bullish continuation leg toward the 0.8600 target.
From a macro perspective, the New Zealand dollar is gaining strength following the RBNZ’s firm stance on keeping rates elevated due to persistent inflation risks, particularly in housing and services. On the flip side, the Canadian dollar is showing relative weakness as oil prices stall and the Bank of Canada shifts toward a more dovish tone amid weaker economic data and slowing consumer spending. This divergence in central bank policy and economic outlook is building a strong fundamental case for NZDCAD upside.
Technically, the structure remains clean. The market formed a strong bullish engulfing rally earlier in April, and since then has entered a symmetrical correction with higher lows forming under compression. This is a classic continuation setup with strong momentum buildup underneath. A breakout above the 0.8280–0.8300 zone with volume would likely trigger institutional interest and drive price rapidly toward the 0.8600 level, which aligns with the measured move of the flag.
This is a high-probability trade idea supported by both technical and fundamental convergence. With risk well-defined below 0.8135 and momentum favoring the bulls, NZDCAD is one of my top setups going into June. Breakout traders and swing traders alike should keep this pair on the radar as the next bullish expansion looks imminent.
GBPJPY

GBPJPY: Will Price Touch a Major Psychological Point Of 200? The GBPJPY currency pair is currently struggling to break through the 194 region as the Japanese yen (JPY) consolidates, making the future price trajectory uncertain. This situation has significantly complicated trading JPY pairs.
Analysing historical price behaviour in similar circumstances can provide insights into potential future movements, but it’s crucial to conduct thorough research before engaging in trading. Past performance doesn’t guarantee adherence to chart trends.
The Japanese yen (JPY) also exhibits a negative correlation with the US dollar (USD). Given our bullish stance on the DXY index in the coming days, we anticipate substantial pressure on the JPY, potentially leading to a significant decline. It’s also worth considering the GBP, which has surged to prominence as one of the most sought-after currencies since the market opened earlier today.
In the meantime, we recommend setting two take-profit targets: one at 197 and another at 199. These levels are likely to witness substantial bearish volume entering the market.
We wish you successful trading and emphasise the importance of adhering to safety protocols.
We appreciate your unwavering support and encourage you to contribute by liking, commenting, or sharing our ideas.
Team Setupsfx_
❤️🚀

GBPJPY - Expecting Bullish Continuation In The Short TermH1 - Strong bullish move.
Higher highs on the moving averages of the MACD.
No opposite signs.
Expecting further continuation higher until the two Fibonacci support zones hold.
If you enjoy this idea, don’t forget to LIKE 👍, FOLLOW ✅, SHARE 🙌, and COMMENT ✍! Drop your thoughts and charts below to keep the discussion going. Your support helps keep this content free and reach more people! 🚀
--------------------------------------------------------------------------------------------------------------------
Disclosure: I am part of Trade Nation's Influencer program and receive a monthly fee for using their TradingView charts in my analysis.

GBPUSD BULLISH OR BEARISH DETAILED ANALYSISGBPUSD has played out exactly as forecasted, completing a clean bullish leg from the Fibonacci confluence zones and breaking through the key 1.3430 resistance level. The structure remains strongly bullish, and after this minor retest, I’m anticipating another impulsive wave to the upside, with the next target sitting firmly at the 1.3900 level. The pair continues to respect both structure and momentum, showing consistent demand on dips.
Fundamentally, the British pound continues to gain strength backed by sticky inflation data and hawkish tone from the Bank of England. With UK CPI remaining elevated and core services inflation running hot, the BoE is being forced to hold its tightening bias. This contrasts sharply with the Federal Reserve, where recent data shows signs of softening labor markets and cooling price pressure, bringing rate cut expectations back on the table for the second half of 2025.
Technically, GBPUSD has cleanly respected all key fib levels from the previous correction. The breakout above 1.3430 has flipped structure into bullish continuation, and the market has already begun forming higher highs and higher lows on both daily and 4H timeframes. As long as price holds above the 1.3430–1.3450 retest zone, the bullish outlook remains intact with high-probability momentum toward 1.3900.
In current market sentiment, GBPUSD remains one of the strongest trending pairs, with institutions adding to long exposure as the dollar index weakens. As a professional trader, I remain long-biased and look to scale in on lower timeframe retracements. This is a textbook continuation play backed by both technicals and macro momentum. Let the trend work—bulls remain in full control.

GBPJPY H1 | Bearish Reversal Based on the H1 chart, the price is rising toward our sell entry level at 193.49, a pullback resistance.
Our take profit is set at 192.83, a pullback support that aligns with the 61.6% Fibo retracement.
The stop loss is set at 194.19, a swing high resistance.
High Risk Investment Warning
Trading Forex/CFDs on margin carries a high level of risk and may not be suitable for all investors. Leverage can work against you.
Stratos Markets Limited (tradu.com ):
CFDs are complex instruments and come with a high risk of losing money rapidly due to leverage. 63% of retail investor accounts lose money when trading CFDs with this provider. You should consider whether you understand how CFDs work and whether you can afford to take the high risk of losing your money.
Stratos Europe Ltd (tradu.com ):
CFDs are complex instruments and come with a high risk of losing money rapidly due to leverage. 63% of retail investor accounts lose money when trading CFDs with this provider. You should consider whether you understand how CFDs work and whether you can afford to take the high risk of losing your money.
Stratos Global LLC (tradu.com ):
Losses can exceed deposits.
Please be advised that the information presented on TradingView is provided to Tradu (‘Company’, ‘we’) by a third-party provider (‘TFA Global Pte Ltd’). Please be reminded that you are solely responsible for the trading decisions on your account. There is a very high degree of risk involved in trading. Any information and/or content is intended entirely for research, educational and informational purposes only and does not constitute investment or consultation advice or investment strategy. The information is not tailored to the investment needs of any specific person and therefore does not involve a consideration of any of the investment objectives, financial situation or needs of any viewer that may receive it. Kindly also note that past performance is not a reliable indicator of future results. Actual results may differ materially from those anticipated in forward-looking or past performance statements. We assume no liability as to the accuracy or completeness of any of the information and/or content provided herein and the Company cannot be held responsible for any omission, mistake nor for any loss or damage including without limitation to any loss of profit which may arise from reliance on any information supplied by TFA Global Pte Ltd.
The speaker(s) is neither an employee, agent nor representative of Tradu and is therefore acting independently. The opinions given are their own, constitute general market commentary, and do not constitute the opinion or advice of Tradu or any form of personal or investment advice. Tradu neither endorses nor guarantees offerings of third-party speakers, nor is Tradu responsible for the content, veracity or opinions of third-party speakers, presenters or participants.

GBP-JPY Resistance Cluster! Sell!
Hello,Traders!
GBP-JPY made a retest
Of the resistance cluster
Of the rising and horizontal
Resistance lines around 193.989
And we are already seeing a
Bearish reaction so we will be
Expecting a further bearish
Move down
Sell!
Comment and subscribe to help us grow!
Check out other forecasts below too!
Disclosure: I am part of Trade Nation's Influencer program and receive a monthly fee for using their TradingView charts in my analysis.

GBPJPY BULLISH OR BEARISH DETAILED ANALYSISGBPJPY has successfully broken out of a long-term descending trendline on the 3D timeframe, which had capped price action for months. The breakout is now confirmed with multiple candle closes above the trendline and a retest holding firm around 190.500. This shift in structure signals a major bullish reversal, and I’m now targeting the 199.600 level as the next potential upside objective.
From a fundamental perspective, the British pound is strengthening amid persistent inflationary pressures in the UK, which are keeping the Bank of England firmly in the hawkish camp. With CPI still elevated and wage growth remaining sticky, the BoE has little room to cut rates aggressively anytime soon. In contrast, the Bank of Japan continues to hold a dovish tone with ultra-accommodative monetary policy, offering a wide interest rate differential that favors GBP longs, especially in carry trade setups.
Technically, this setup offers a clean risk-reward profile. The breakout above the descending structure combined with a strong support zone around 190.500 gives this move a solid foundation. We’re seeing momentum build with higher highs and higher lows forming across multiple timeframes. As long as GBPJPY holds above the 190.000 zone, the bullish bias remains valid and the path toward 199.600 looks open and sustainable.
Traders should keep a close eye on short-term pullbacks as potential re-entry zones. With a macro tailwind behind GBP strength and continued JPY weakness, this pair is primed for further upside. I’m riding this bullish wave with a medium-term outlook and adjusting my position based on intraday market behavior.

Trading balanceTrading balance The price of the asset has rebounded from the balance zone. With the prospect of growth into the resistance zone.

GBPJPYHello everyone,
Today’s first trade signal comes from GBPJPY. I’ve set three different target levels for this trade. Feel free to close the position at any of these levels depending on your strategy.
🔍 Trade Details:
✔️ Timeframe: 15-Minute
✔️ Risk-to-Reward Ratio: 1:1 / 1:1.50 / 1:2
✔️ Trade Direction: Sell
✔️ Entry Price: 193.838
✔️ Take Profit: 194.018
✔️ Stop Loss: 193.658
🔔 Disclaimer: This is not financial advice. I’m simply sharing a trade I’ve taken based on my personal trading system, strictly for educational and illustrative purposes.
📌 Interested in a systematic, data-driven trading approach?
💡 Follow the page and turn on notifications to stay updated on future trade setups and advanced market insights.

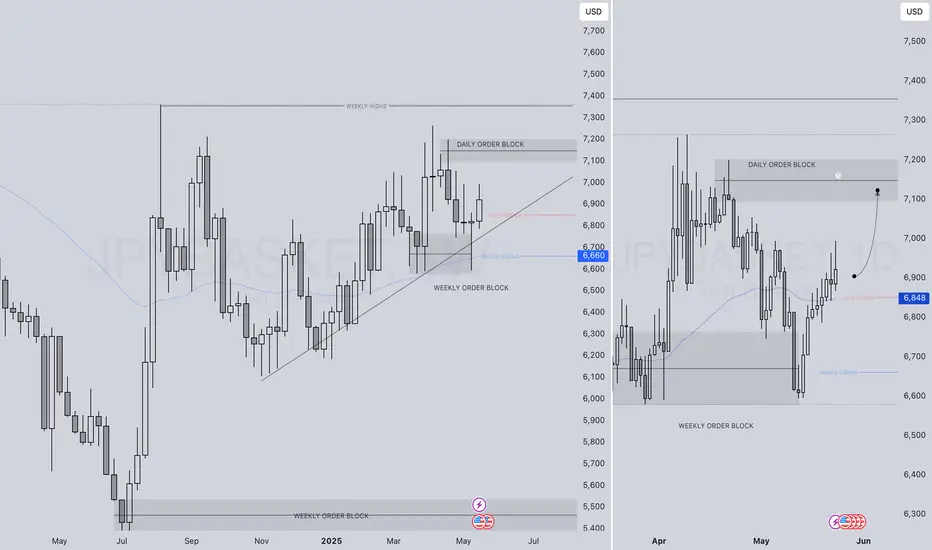
WHO LOVES A STRONG JPY ( YEN )BASKET FORECAST Q2 W22 Y25WHO LOVES A STRONG JPY ( YEN )BASKET FORECAST Q2 W22 Y25
Professional Risk Managers👋
Welcome back to another FRGNT chart update📈
Diving into some Forex setups using predominantly higher time frame order blocks alongside confirmation breaks of structure.
Let’s see what price action is telling us today!
✅The JPY Basket tracks the overall strength of the JPY against a weighted average of other currencies.
✅It can be used as an indicator of YEN strength which can be a tool for analysing and potentially hedging for or against the Index.
✅ Pairs to watch - GBPJPY, USDJPY EURJPY, CADJPY, AUDJPY
🔑 Remember, to participate in trading comes always with a degree of risk, therefore as professional risk managers it remains vital that we stick to our risk management plan as well as our trading strategies.
📈The rest, we leave to the balance of probabilities.
💡Fail to plan. Plan to fail.
🏆It has always been that simple.
❤️Good luck with your trading journey, I shall see you at the very top.
🎯Trade consistent, FRGNT X
GBPJPY - Bullish Breakout Likely
The GBP/JPY 4-hour chart shows a strong bullish trend that propelled the pair from 190.50 support in early May to peaks near 196.50, followed by a healthy consolidation phase around the 192.00-194.00 range. This sideways price action has allowed momentum to reset while maintaining the underlying upward structure, with the pair successfully holding above key support at 192.00. The current positioning near the upper boundary of the consolidation range, combined with signs of renewed buying interest, suggests the correction is nearing completion. The technical setup favors a bullish breakout, with the higher probability scenario pointing toward a resumption of the uptrend targeting the previous high around 196.50 and potentially extending toward the 197.00 resistance zone.
Disclosure: I am part of Trade Nation's Influencer program and receive a monthly fee for using their TradingView charts in my analysis.

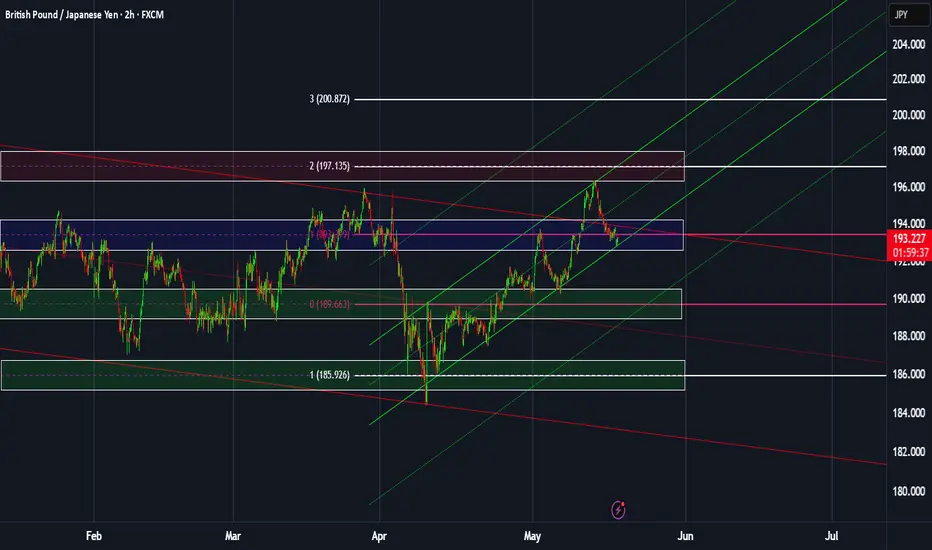
GBPJPY: Weekly overview + Significant zonesHello dear traders,
The indicated levels are determined based on the most reaction points and the assumption of approximately equal distance between the zones.
These points can also be confirmed by the mathematical intervals of Murray.
After reacting to the following zones, you can enter the trade. Place the stop loss slightly above/below the zone to which the reaction was shown. The profit point is the next zone.
The drawn channels and their medians can also be considered as moving support and resistance. I usually use them as target points. I've doubled the short-term channel because it was so thin ;-).
* I don't use 189.663 zone to take short! There are too many moving S&R around it.
This analysis is valid until the end of the week.
**************************************
Important news that could change the direction of the trade:
Wed: Great Britain CPI of April.
GBPJPY Channel Down making a Lower High rejectionThe GBPJPY pair rose aggressively since the last time we gave our buy signal (April 11, see chart below), quickly hitting our conservative 109.250 Target:
The price has since made a Lower High rejection at the top of the Channel Down but remains supported by the 1D MA50 (blue trend-line). Once broken and it closes a 1D candle below it, we will have bearish break-out signal. Our Targe will be 185.250, which will be the standard -5.85% decline that all 3 previous Bearish Legs had within the Channel Down.
-------------------------------------------------------------------------------
** Please LIKE 👍, FOLLOW ✅, SHARE 🙌 and COMMENT ✍ if you enjoy this idea! Also share your ideas and charts in the comments section below! This is best way to keep it relevant, support us, keep the content here free and allow the idea to reach as many people as possible. **
-------------------------------------------------------------------------------
💸💸💸💸💸💸
👇 👇 👇 👇 👇 👇

GBPJPY Bulls wake Up! Clean swing buy opportunity ahead! Price after the recent swing high as indicated on the chart (yellow circles)
It has since retraced to to 61.8 retracement level and has rejected with one bullish candle and currently rejecting again. There is a high probability to see some buy pressure ahead of next weeks trading sessions to the up side to target of 195.78 and beyond.

GBPJPY SELL Analysis Idea!!!!⸻
Pair: GBPJPY
Timeframe: 1 Hour (1H)
Bias: Bearish (Sell Setup)
⸻
Technical Analysis:
1. Price Structure & Market Context:
• The chart shows a clear downtrend from the previous swing high near 196.000.
• Price has since formed a lower high within the red supply zone, reinforcing bearish pressure.
• Several liquidity grabs and rejections are visible near the red supply zone, indicating sellers are defending this level aggressively.
2. Key Zones & Levels:
• Supply Zone (Red Area): 193.243–193.594 — significant selling pressure observed.
• Buyers Above Zone: Price has failed to sustain above 193.243 despite attempts, confirming bearish strength.
• Break of Structure (BOS): At 192.824, confirming bearish momentum.
• Support Zones (Green Areas):
• First target area: 192.307
• Second target area: 191.272 — potential extended target if momentum continues downward.
3. Entry & Confirmation:
• Current Price: 193.168
• Price is rejecting the supply zone and failing to break above the 193.243 resistance line.
• Confirmation of sell setup co mes from:
• Bearish rejections at supply
• Price forming a lower high (193.100 HL level)
• BOS and retest pattern playing out
4. Trade Plan (Sell Idea):
• Sell Entry: Between 193.150–193.243 (rejection zone)
• Stop Loss: Above 193.594 (invalidate the supply zone rejection)
• Take Profit 1 (TP1): 192.307
• Take Profit 2 (TP2): 191.272 (extended target)
⸻
Confluence Factors:
• Price is respecting supply zone.
• Repeated bearish rejections and liquidity sweeps above key levels.
• BOS supports shift in structure to bearish.
⸻
Conclusion:
GBPJPY is showing strong signs of bearish control, with multiple rejections from the supply zone and a BOS indicating momentum shift. A sell from the current levels offers a good risk-to-reward setup, targeting the support zones below.

Bearish drop off pullback resistance?GBP/JPY is rising towards the pivot and could drop to the 1st support, which is a pullback support.
Pivot: 193.76
1st Support: 191.56
1st Resistance: 194.80
Risk Warning:
Trading Forex and CFDs carries a high level of risk to your capital and you should only trade with money you can afford to lose. Trading Forex and CFDs may not be suitable for all investors, so please ensure that you fully understand the risks involved and seek independent advice if necessary.
Disclaimer:
The above opinions given constitute general market commentary, and do not constitute the opinion or advice of IC Markets or any form of personal or investment advice.
Any opinions, news, research, analyses, prices, other information, or links to third-party sites contained on this website are provided on an "as-is" basis, are intended only to be informative, is not an advice nor a recommendation, nor research, or a record of our trading prices, or an offer of, or solicitation for a transaction in any financial instrument and thus should not be treated as such. The information provided does not involve any specific investment objectives, financial situation and needs of any specific person who may receive it. Please be aware, that past performance is not a reliable indicator of future performance and/or results. Past Performance or Forward-looking scenarios based upon the reasonable beliefs of the third-party provider are not a guarantee of future performance. Actual results may differ materially from those anticipated in forward-looking or past performance statements. IC Markets makes no representation or warranty and assumes no liability as to the accuracy or completeness of the information provided, nor any loss arising from any investment based on a recommendation, forecast or any information supplied by any third-party.

GJ-Fri-23/05/25 TDA-Wide consolidation incoming?Analysis done directly on the chart
Follow for more, possible live updates!
Not everyday is a good trading day,
you are not forced to take trades every
single day. More trades is not equal
to better results.
Not financial advice, DYOR.
Market Flow Strategy
Mister Y

GBP/JPY Holds Key Support as Bullish Momentum BuildsA bullish setup has emerged on GBP/JPY, with recent price action suggesting bullish momentum is building. With GBP strengthening against USD, GBP/JPY may present a higher-probability bullish scenario compared to USD/JPY in the near term (though this also looks bullish to my eyes over the near term).
GBP/JPY held above key moving averages midweek. GBP/JPY failed to close below its 200-day SMA on both Wednesday and Thursday, while yesterday’s session also respected support at the 50-day EMA and the 192.00 handle.
Momentum indicators support the bullish case, with the daily RSI trading above 50 after rebounding from its most oversold level in six weeks.
As long as prices hold above Thursday’s low, bulls may look for a retest of the cycle highs near 196.00.
** Please note that Japan's CPI data drops in >30 minutes **
Matt Simpson, Market Analyst at City Index and Forex.com

GBPJPY Technical Analysis! BUY!
My dear followers,
I analysed this chart on GBPJPY and concluded the following:
The market is trading on 193.04 pivot level.
Bias - Bullish
Technical Indicators: Both Super Trend & Pivot HL indicate a highly probable Bullish continuation.
Target - 193.32
About Used Indicators:
A super-trend indicator is plotted on either above or below the closing price to signal a buy or sell. The indicator changes color, based on whether or not you should be buying. If the super-trend indicator moves below the closing price, the indicator turns green, and it signals an entry point or points to buy.
Disclosure: I am part of Trade Nation's Influencer program and receive a monthly fee for using their TradingView charts in my analysis.
———————————
WISH YOU ALL LUCK

GBPJPY What Next? SELL!
My dear friends,
Please, find my technical outlook for GBPJPY below:
The instrument tests an important psychological level 193.17
Bias - Bearish
Technical Indicators: Supper Trend gives a precise Bearish signal, while Pivot Point HL predicts price changes and potential reversals in the market.
Target - 192.71
About Used Indicators:
Super-trend indicator is more useful in trending markets where there are clear uptrends and downtrends in price.
Disclosure: I am part of Trade Nation's Influencer program and receive a monthly fee for using their TradingView charts in my analysis.
———————————
WISH YOU ALL LUCK

XAUUSD and GBPJPY analysis todayHello traders, this is a complete multiple timeframe analysis of this pair. We see could find significant trading opportunities as per analysis upon price action confirmation we may take this trade. Smash the like button if you find value in this analysis and drop a comment if you have any questions or let me know which pair to cover in my next analysis.

USDJPY BULLISH OR BEARISH DETAILED ANALYSISUSDJPY is trading around the 143.00 level, and we’re now closely eyeing a potential breakdown. After a prolonged uptrend driven by policy divergence between the Fed and the BoJ, the pair appears to be losing bullish momentum. Structurally, the pair has formed a lower high, and sellers are starting to step in near resistance. A clean break below the 142.00–141.50 zone could open the path toward my downside target at 135.00.
On the fundamental side, recent data suggests a shift in sentiment. The US dollar is under pressure as markets increasingly price in a Fed pause or even rate cuts by the end of the year, following soft retail sales and labor market figures. Meanwhile, the Japanese yen is gaining ground amid rising speculation that the Bank of Japan could adjust its ultra-loose policy sooner than expected. The BoJ’s recent bond purchase tapering and Governor Ueda's hints at tightening are starting to shift market flows back toward the yen.
Technically, USDJPY is at a critical juncture. The pair is testing a key trendline support that has held for months, but price action is showing signs of exhaustion. Volume is thinning on the rallies, and bearish divergence is visible on multiple indicators, including RSI and MACD. If the pair breaks below the current structure, we could see accelerated downside action toward the 135.00 target, which aligns with previous consolidation zones and fib retracement levels.
This setup offers a strong short opportunity with clear invalidation and solid risk-to-reward potential. The macro narrative is shifting in favor of the yen, and technicals are lining up with this view. I’ll be watching the coming sessions for confirmation of breakdown and potential entries. This could be the start of a broader correction after a strong bullish cycle.

GJ-Thu-22/05/25 TDA-Multiple 4hS tapped, PMI news incoming!Analysis done directly on the chart
Follow for more, possible live updates!
Multiple 4hS tapped, PMI news incoming,
the PMI releases will determine how price
will move today.
Not financial advice, DYOR.
Market Flow Strategy
Mister Y
