GBPJPY Will Go Lower From Resistance! Sell!
Take a look at our analysis for GBPJPY.
Time Frame: 2h
Current Trend: Bearish
Sentiment: Overbought (based on 7-period RSI)
Forecast: Bearish
The market is on a crucial zone of supply 195.398.
The above-mentioned technicals clearly indicate the dominance of sellers on the market. I recommend shorting the instrument, aiming at 194.206 level.
P.S
We determine oversold/overbought condition with RSI indicator.
When it drops below 30 - the market is considered to be oversold.
When it bounces above 70 - the market is considered to be overbought.
Disclosure: I am part of Trade Nation's Influencer program and receive a monthly fee for using their TradingView charts in my analysis.
Like and subscribe and comment my ideas if you enjoy them!
GBPJPY

USDJPY and GBPJPY Analysis todayHello traders, this is a complete multiple timeframe analysis of this pair. We see could find significant trading opportunities as per analysis upon price action confirmation we may take this trade. Smash the like button if you find value in this analysis and drop a comment if you have any questions or let me know which pair to cover in my next analysis.

GBP/JPY SELLERS WILL DOMINATE THE MARKET|SHORT
GBP/JPY SIGNAL
Trade Direction: short
Entry Level: 193.409
Target Level: 190.219
Stop Loss: 195.512
RISK PROFILE
Risk level: medium
Suggested risk: 1%
Timeframe: 1D
Disclosure: I am part of Trade Nation's Influencer program and receive a monthly fee for using their TradingView charts in my analysis.
✅LIKE AND COMMENT MY IDEAS✅

GBPJPY Take Profit Hit!Dear traders, we had a real sniper entry today. As soon as the trade was executed, price began to drop immediately—allowing us to secure profits at both 1:1.5 and 1:2 Risk-to-Reward levels. Clean execution, clean result.
This was my first and last trade of the day.
See you again tomorrow with new opportunities!

GBPJPYHello Traders,
Today’s first setup comes from GBPJPY. Based on current market conditions, I’ve identified a high-probability sell opportunity. The trade has already been executed on my end, with a Risk-to-Reward Ratio set between 1:1.5 and 1:2, depending on your individual risk appetite.
🔍 Trade Details:
✔️ Timeframe: 15-Minute
✔️ Risk-to-Reward Ratio: 1:1.50 / 1:2
✔️ Trade Direction: Sell
✔️ Entry Price: 193.564
✔️ Take Profit: 193.256
✔️ Stop Loss: 193.768
🔔 Disclaimer: This is not financial advice. I'm simply sharing a trade I’m personally taking, based on my own methodology. It is intended purely for educational purposes.
📌 If you're interested in a more systematic and data-driven approach to trading:
💡 Follow the page and turn on notifications to stay up to date with future trade ideas and market breakdowns.

GJ-Fri-16/05/25 TDA-Finally Gap filled completely, interesting!Analysis done directly on the chart
Follow for more, possible live trade updates!
Push, set back, recharge.
Push again, set back, recharge again.
Rinse and repeat.
Not financial advice, DYOR.
Market Flow Strategy
Mister Y

GBPJPY SHORT FORECAST Q2 W20 D16 Y25GBPJPY SHORT FORECAST Q2 W20 D16 Y25
Professional Risk Managers👋
Welcome back to another FRGNT chart update📈
Diving into some Forex setups using predominantly higher time frame order blocks alongside confirmation breaks of structure.
Let’s see what price action is telling us today!
💡Here are some trade confluences📝
✅Weekly order block rejection
✅Daily order block rejection
✅Intraday 15' order blocks
✅Higher time frame bearish structure
🔑 Remember, to participate in trading comes always with a degree of risk, therefore as professional risk managers it remains vital that we stick to our risk management plan as well as our trading strategies.
📈The rest, we leave to the balance of probabilities.
💡Fail to plan. Plan to fail.
🏆It has always been that simple.
❤️Good luck with your trading journey, I shall see you at the very top.
🎯Trade consistent, FRGNT X

GBPJPY | 12.05.2025SELL 194.800 | STOP 197.000 | TAKE 192.000 | Trump has announced a deal with the UK. The deal will lift some of the tariffs he imposed on British goods such as cars, steel and aluminium. In return, the US has secured concessions that will provide greater access to US industries such as agriculture and a reduction in digital tax.
The Pound will also react to upcoming UK labour market data on Tuesday and GDP data on Thursday. Economists expect these data to show that the economy grew by 0.1 per cent in March after growing by 0.5 per cent in the previous month.

USDJPY and GBPJPY Further drop?Hello traders, this is a complete multiple timeframe analysis of this pair. We see could find significant trading opportunities as per analysis upon price action confirmation we may take this trade. Smash the like button if you find value in this analysis and drop a comment if you have any questions or let me know which pair to cover in my next analysis.

DeGRAM | GBPJPY broke through and fixed above the channel📊 Technical Analysis
● Price has broken the 8‑month descending channel’s roof and reclaimed the last swing‑high at 194, turning it into support and signalling a trend reversal.
● The move launches from a bullish pennant; its measured target and the channel’s midline converge in the 196 – 197.8 resistance zone.
💡 Fundamental Analysis
● UK average earnings held above 6 % y/y in April, curbing BoE‑cut speculation and keeping gilt yields elevated.
● Japan’s Q1 GDP shrank and the BoJ left policy ultra‑loose, widening the UK–JP rate gap and pressuring the yen.
✨ Summary
Channel breakout plus strong UK data and soft JPY bias favour a long GBP/JPY: aim for 196 → 197.8, risk managed on a daily close back below 194.
-------------------
Share your opinion in the comments and support the idea with like. Thanks for your support!

GJ-Thu-15/05/25 TDA-Gap is starting to get filled! Interesting!Analysis done directly on the chart
Follow for more, possibly live trade updates!
Keep grinding, only when you are carrying your
own buckets of water, you'll feel every drop significantly!
Not financial advice, DYOR.
Market Flow Strategy
Mister Y

GJ-Wed-14/05/25 TDA-Higher high, higher low to next DR 197.240?Analysis done directly on the chart
Follow for more, possible live trade updates!
Does anybody know if gaps will always be filled or not?
Based on what criteria if it will be filled or not?
Appreciate the responses!
Comment down below!
Not financial advice, DYOR.
Market Flow Strategy
Mister Y

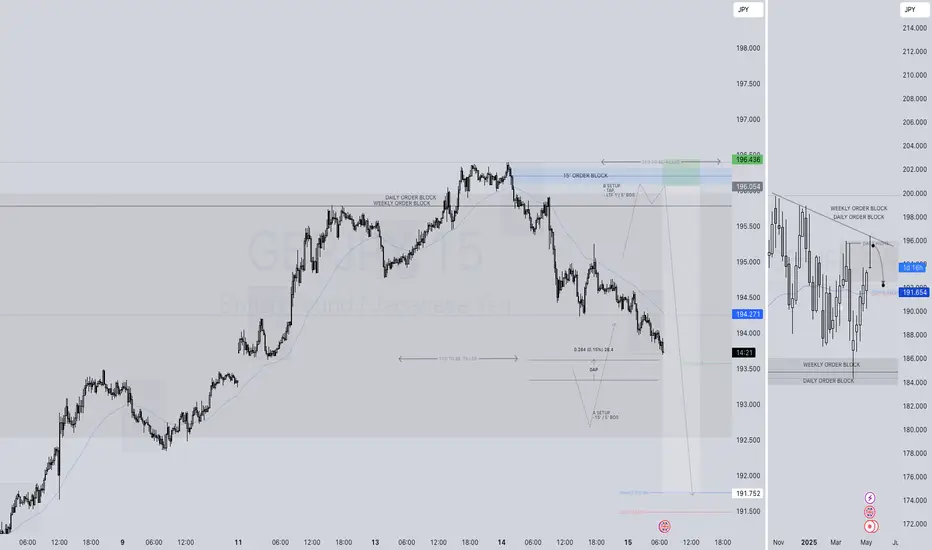
GBPJPY SHORT FORECAST Q2 W20 D15 Y25GBPJPY SHORT FORECAST Q2 W20 D15 Y25
Professional Risk Managers👋
Welcome back to another FRGNT chart update📈
Diving into some Forex setups using predominantly higher time frame order blocks alongside confirmation breaks of structure.
Let’s see what price action is telling us today!
💡Here are some trade confluences📝
✅Weekly order block rejection
✅Daily order block rejection
✅Intraday 15' order blocks
✅Gap fill
🔑 Remember, to participate in trading comes always with a degree of risk, therefore as professional risk managers it remains vital that we stick to our risk management plan as well as our trading strategies.
📈The rest, we leave to the balance of probabilities.
💡Fail to plan. Plan to fail.
🏆It has always been that simple.
❤️Good luck with your trading journey, I shall see you at the very top.
🎯Trade consistent, FRGNT X
GB{JPY H4 | Bearish ContinuationBased on the H4 chart, the price could potentially rise toward our sell entry level at 194.75, a pullback resistance
Our take profit is set at 192.49, a pullback support that aligns close to the 61.8% Fibo retracement.
The stop loss is set at 196.99, a swing high resistance.
High Risk Investment Warning
Trading Forex/CFDs on margin carries a high level of risk and may not be suitable for all investors. Leverage can work against you.
Stratos Markets Limited (tradu.com):
CFDs are complex instruments and come with a high risk of losing money rapidly due to leverage. 63% of retail investor accounts lose money when trading CFDs with this provider. You should consider whether you understand how CFDs work and whether you can afford to take the high risk of losing your money.
Stratos Europe Ltd (tradu.com):
CFDs are complex instruments and come with a high risk of losing money rapidly due to leverage. 63% of retail investor accounts lose money when trading CFDs with this provider. You should consider whether you understand how CFDs work and whether you can afford to take the high risk of losing your money.
Stratos Global LLC (tradu.com):
Losses can exceed deposits.
Please be advised that the information presented on TradingView is provided to Tradu (‘Company’, ‘we’) by a third-party provider (‘TFA Global Pte Ltd’). Please be reminded that you are solely responsible for the trading decisions on your account. There is a very high degree of risk involved in trading. Any information and/or content is intended entirely for research, educational and informational purposes only and does not constitute investment or consultation advice or investment strategy. The information is not tailored to the investment needs of any specific person and therefore does not involve a consideration of any of the investment objectives, financial situation or needs of any viewer that may receive it. Kindly also note that past performance is not a reliable indicator of future results. Actual results may differ materially from those anticipated in forward-looking or past performance statements. We assume no liability as to the accuracy or completeness of any of the information and/or content provided herein and the Company cannot be held responsible for any omission, mistake nor for any loss or damage including without limitation to any loss of profit which may arise from reliance on any information supplied by TFA Global Pte Ltd.
The speaker(s) is neither an employee, agent nor representative of Tradu and is therefore acting independently. The opinions given are their own, constitute general market commentary, and do not constitute the opinion or advice of Tradu or any form of personal or investment advice. Tradu neither endorses nor guarantees offerings of third-party speakers, nor is Tradu responsible for the content, veracity or opinions of third-party speakers, presenters or participants.

GBPJPY - Looking To Sell Pullbacks In The Short TermM15 - Bearish divergence followed by the most recent uptrend line breakout.
Lower lows on the moving averages of the MACD.
No opposite signs.
Expecting pullbacks and bearish continuation until the strong resistance zone holds.
If you enjoy this idea, don’t forget to LIKE 👍, FOLLOW ✅, SHARE 🙌, and COMMENT ✍! Drop your thoughts and charts below to keep the discussion going. Your support helps keep this content free and reach more people! 🚀
--------------------------------------------------------------------------------------------------------------------
Disclosure: I am part of Trade Nation's Influencer program and receive a monthly fee for using their TradingView charts in my analysis.

GBPJPY Just Hit the Sweet Spot — High RRR or Fakeout Trap?💷 GBPJPY 30-Min Chart Breakdown — May 14, 2025
This setup is a banger for traders following structure, zones, and risk-reward logic. Let’s dissect the trade logic:
🔍 1. Market Structure
Price has been moving within a well-respected ascending channel (see black trendlines).
We just printed a short-term bearish pullback, with price dipping into a refined demand zone (highlighted pink/red).
The most recent bearish impulse looked like a liquidity sweep, not a structure break.
🧱 2. Smart Money Zone
Demand zone aligns with:
✅ Previous OB (order block)
✅ Mid-channel support
✅ Equal lows & trendline liquidity just below
Dark gray box = the exact entry block
Bulls stepped in right on time — classic mitigation + reaction setup
🎯 3. Risk-Reward
Entry: Around 195.380
SL: 195.110 (tight below the block)
TP: 196.575
RRR ≈ 1:5 — beautiful sniper entry with minimal exposure and max gain
🧠 4. What to Watch Next
Break above 195.900 = confirmation of bullish continuation
If price stalls again below midline, re-entry could come after another liquidity push
Clean break of 195.100 = invalidation (watch for potential short setups below)
🔁 Trade Management Tips:
Trail stops aggressively above 195.900
Scale out partials every 50 pips if you're trading it like a swing
Add confluence from DXY/Yen strength for better context
This one checks all the boxes: structure, zone, confirmation, and a clean RRR.
🚀 Tag a trader who loves tight stop, high-RR plays.
📲 Follow @ChartNinjas88 for more Smart Money scalps & swing setups!

GBPJPY breaking the F.V.G?GBPJPY after breakout of the monthly long term trend line has got rejected for potential retest of the support. As the market has left a gap untested at 193.50 level, there is a high probability for the price to drop and retest and fill that gap. Currently price is approaching a fair value gap.
As first trade closed in profit, looking for another sell entry at 1h candle close!

XAUUSD Analysis todayHello traders, this is a complete multiple timeframe analysis of this pair. We see could find significant trading opportunities as per analysis upon price action confirmation we may take this trade. Smash the like button if you find value in this analysis and drop a comment if you have any questions or let me know which pair to cover in my next analysis.

GBPJPY SHORT FORECAST Q2 W20 D14 Y25GBPJPY SHORT FORECAST Q2 W20 D14 Y25
Professional Risk Managers👋
Welcome back to another FRGNT chart update📈
Diving into some Forex setups using predominantly higher time frame order blocks alongside confirmation breaks of structure.
Let’s see what price action is telling us today!
💡Here are some trade confluences📝
✅Weekly order block rejection
✅Daily order block rejection
✅Intraday 15' order blocks
✅Gap fill
🔑 Remember, to participate in trading comes always with a degree of risk, therefore as professional risk managers it remains vital that we stick to our risk management plan as well as our trading strategies.
📈The rest, we leave to the balance of probabilities.
💡Fail to plan. Plan to fail.
🏆It has always been that simple.
❤️Good luck with your trading journey, I shall see you at the very top.
🎯Trade consistent, FRGNT X

GBPJPY H4 | Bullish Bounce Off Based on the H4 chart analysis, the price is falling toward our buy entry level at 193.70, a pullback support that aligns close to the 50% Fibonacci retracement.
Our take profit is set at 196.99, a pullback resistance.
The stop loss is placed at 191.70 , a pullback support level.
High Risk Investment Warning
Trading Forex/CFDs on margin carries a high level of risk and may not be suitable for all investors. Leverage can work against you.
Stratos Markets Limited (tradu.com):
CFDs are complex instruments and come with a high risk of losing money rapidly due to leverage. 63% of retail investor accounts lose money when trading CFDs with this provider. You should consider whether you understand how CFDs work and whether you can afford to take the high risk of losing your money.
Stratos Europe Ltd (tradu.com):
CFDs are complex instruments and come with a high risk of losing money rapidly due to leverage. 63% of retail investor accounts lose money when trading CFDs with this provider. You should consider whether you understand how CFDs work and whether you can afford to take the high risk of losing your money.
Stratos Global LLC (tradu.com):
Losses can exceed deposits.
Please be advised that the information presented on TradingView is provided to Tradu (‘Company’, ‘we’) by a third-party provider (‘TFA Global Pte Ltd’). Please be reminded that you are solely responsible for the trading decisions on your account. There is a very high degree of risk involved in trading. Any information and/or content is intended entirely for research, educational and informational purposes only and does not constitute investment or consultation advice or investment strategy. The information is not tailored to the investment needs of any specific person and therefore does not involve a consideration of any of the investment objectives, financial situation or needs of any viewer that may receive it. Kindly also note that past performance is not a reliable indicator of future results. Actual results may differ materially from those anticipated in forward-looking or past performance statements. We assume no liability as to the accuracy or completeness of any of the information and/or content provided herein and the Company cannot be held responsible for any omission, mistake nor for any loss or damage including without limitation to any loss of profit which may arise from reliance on any information supplied by TFA Global Pte Ltd.
The speaker(s) is neither an employee, agent nor representative of Tradu and is therefore acting independently. The opinions given are their own, constitute general market commentary, and do not constitute the opinion or advice of Tradu or any form of personal or investment advice. Tradu neither endorses nor guarantees offerings of third-party speakers, nor is Tradu responsible for the content, veracity or opinions of third-party speakers, presenters or participants.

EDUCATION: Why I’m Still in the GBPJPY TradeWhy I’m Still in the GBPJPY Trade—Even After Hitting the Target
Most traders hit a target and run. And honestly? That’s fine.
But this time, we’re doing something different.
Our GBPJPY trade—entered at 188.813 with a target at 195.170—just did what many doubted: it hit the target. That’s over 630 pips of calculated risk, patience, and pure follow-through. But instead of closing the position and patting ourselves on the back, we’re letting it run.
Here’s why:
1. Momentum Isn’t Slowing Down
Price action is bullish. Higher highs, clean structure, and no major signs of reversal yet. When the market is walking in your favor, don’t interrupt it just to feel “right.”
2. Smart Traders Let Their Winners Run
It’s not just a quote—it’s a survival skill in trading. Letting profits develop is how you avoid the trap of small wins and big losses. This trade is still showing strength, and we’re adapting with it.
3. The Higher Timeframe Story Still Has Room
On the daily and weekly charts, GBPJPY could still reach into extended zones. With fundamentals aligning and technicals confirming, why leave early?
A Quick Recap:
Entry: 188.813
Original Target: 195.170 ✅
Current Action: Letting it ride 🚀
Lessons from This Trade:
A plan should include the possibility of more than just your first target.
Exit strategy matters just as much as entry.
Emotional discipline separates reactive traders from real ones.
Would you stay in the trade or take the money and bounce? Let me know—because this is the part where traders split into two camps: the ones who close too early... and the ones who play the full game.
Watch the full trade update and analysis now on YouTube.

GBPJPY Trade Update: New Month, New Momentum?As we flip the calendar into a new month, our GBPJPY swing trade has shown solid progress—reaching 193.030, just over halfway to our final target at 195.170. Originally entered at 188.813, this move has delivered over 400 pips so far, validating the analysis behind the setup.
In this phase of the trade, it’s less about jumping to adjust and more about staying focused on trade management and letting the market reveal its next intention. Price is approaching a key zone of interest where momentum often stalls or accelerates, and we’re watching closely for signs of strength—or hesitation.
Key insights from this phase of the trade:
The power of planning your exit with as much precision as your entry.
How end-of-month and new-month flows can trigger volatility.
When to lock in partial profits and when to stay patient.
With strong bullish structure still intact, the GBPJPY pair is giving us every reason to stay in the trade, eyes on the 195.170 target.
Would you hold or secure the bag here? Let me know how you’d play it from this point forward.
📺 Full breakdown and next steps now in the video!

GBP/JPY Breaks Above 196.00! Continuation or Distribution?Detailed Techno-Macro Analysis – GBP/JPY
GBP/JPY has just completed a significant weekly structure breakout, pushing through a key supply zone between 195.00 and 196.30 — an area that historically acted as strong resistance. The breakout occurred via a high-volatility daily candle that closed above the zone, indicating strong bullish pressure.
🔍 Structure & Price Action
Price action shows higher lows and higher highs: a clearly defined bullish structure.
The breakout originated from an accumulation base, following a false bearish breakout below 188.50 (bull trap).
RSI is around 70 on the daily timeframe → strong momentum, but signs of potential exhaustion.
🧠 Key Zones Identified
Current weekly supply: 195.00 – 196.80 (being tested)
Next resistance: 198.70 – 199.50 (swing high and monthly level)
Immediate support: 194.00 – 192.80 (ideal area for pullback and long setups)
Structural support: 190.50 – 188.80
Invalidation: Daily close below 191.00 → potential reversal signal
📈 Macro & Fundamental Context
🇬🇧 UK Macro Update
Wages rising: +5.5% (above expectations) → could support further monetary tightening
Claimant count increasing → early weakness in the labor market
Mixed data, but wage growth bias favors GBP strength
🇯🇵 JPY Still Weak
BoJ remains ultra-accommodative
Verbal interventions from Japanese officials haven’t yet had structural impact
🪙 Retail Sentiment
70% of retail traders are short GBP/JPY, with an average price of 190.59
Only 30% are long, with an average price of 194.65
➡️ Current price (196.30) is above both → retail squeeze in play. Contrarian setup confirmed.
🧾 COT Report
GBP (Non-Commercial Speculators):
Long: +3,320 contracts
Short: -1,956 contracts
➡️ Net long positions increasing → favorable institutional exposure
JPY:
Mixed positions, with increases in both long and short → institutional neutrality on the yen
📅 Seasonality – GBP/JPY
May is historically bearish on both 5Y and 20Y timeframes:
5Y: -2.52%
20Y: -0.43%
Only the 2Y pattern shows a positive return
➡️ Negative seasonality vs. bullish technical structure → conflict worth watching
🔍 Execution Summary
The bullish breakout is strong and supported by sentiment and institutional positioning, but price is now entering a potential distribution zone, where profit-taking could increase.
👉 Main scenario: technical pullback toward 194.00–192.80 for possible long entries, targeting 198.50–199.50
👉 Alternative scenario: daily close below 191.00 → bias reversal and bearish continuation
