GBPJPY..LONGAnalysis complete
scenarios outlined. The zone could be a decision point for [ OANDA:GBPJPY ]. Price reaction here may define the next move.
*** If price breaks and pulls back to retest, a reversal setup might emerge.
--------------------
For detailed entry points, trade management, and high-probability setups, follow the channel:
ForexCSP
GBPJPY

GBPJPY ChoCh + Order Block = Bearish Liquidity Hunt Setup 🧠 Smart Money Breakdown: GBPJPY | 30-Min Chart
This is one of those A+ textbook SMC setups where Smart Money is likely loading shorts before the next liquidity raid.
Let’s break it down:
🔄 1. Change of Character (ChoCh)
Market flipped structure cleanly, printing a ChoCh below a key internal low. That’s our signal that Smart Money is likely done accumulating and prepping for a distribution move.
🟪 2. Order Block + Premium Price Zone
Price is retracing into a well-defined bearish Order Block right inside a premium zone. This OB sits just below a Strong High at 195.855 — a clear inducement level. Retail traders will chase that high... and get wrecked.
You’ll notice that OB is marked around 195.341–195.600 — right where liquidity pools stack.
🧲 3. Target: Weak Low at 193.640
Smart Money doesn’t care about patterns. It wants liquidity — and there’s a juicy Weak Low sitting at 193.640 waiting to be swept.
📐 4. Trade Setup Idea (R:R Approx. 4:1)
🔼 Entry Zone: 195.300–195.500
❌ Stop Loss: Just above Strong High: 195.880
✅ Target: 193.640 (liquidity sweep)
This setup gives you a tight stop and a wide target — just how SMC likes it.
🎯 Execution Tip:
Wait for:
Rejection wick inside OB
Bearish engulfing confirmation
BOS on lower timeframe before entering
Partial TP at mid-FVG or 194.200. Let the rest run.
📎 Confluences:
✅ ChoCh
✅ Bearish OB
✅ Rejection from premium pricing
✅ Clear inducement above Strong High
✅ Weak low as draw-on-liquidity
⚠️ Risk Reminder:
Don’t front-run the OB. Let price come to you. Watch how Smart Money manipulates before you execute. Confirmation > prediction.
🔚 Summary:
GBPJPY is set for a bearish redistribution move. The structure shift, clean OB, and weak low target all scream “trap above, raid below.”
You’re either trading with Smart Money… or you’re the liquidity.
💬 Drop “🎯” if you’re targeting the same liquidity level.
📉 Follow @ChartNinjas88 for more deadly-accurate setups.
🚨 Tag a friend who keeps buying into strong highs 😅

Trading balanceTrading balance The price of the asset has rebounded from the balance zone. With the prospect of growth into the resistance zone.

GJ-Tue-13/05/25 TDA-Eyes on US CPI, weekend gap unfilled yet!Analysis done directly on the chart
Follow for more, possible live trade updates!
Stay up to date if you are daytrader (even if you aren't)
with Financial Juice, real live updates on flash news
speeches and a lot of more!
Not financial advice, DYOR.
Market Flow Strategy
Mister Y

AUDUSD BULLISH OR BEARISH DETAILED ANALYSISAUDUSD is currently trading at 0.6400 and forming a clear inverse head and shoulders pattern on the 12-hour timeframe, a well-known bullish reversal structure. The neckline breakout is nearing, and the recent price behavior shows strong bullish volume support, indicating growing confidence among buyers. With a projected target of 0.6700, this setup offers a favorable risk-to-reward ratio as we transition into a potential trend shift in favor of the Aussie.
On the fundamental front, the Australian dollar is benefiting from a more resilient macro backdrop. Recent Australian jobs data came in stronger than expected, and the RBA remains cautious on rate cuts, especially with inflation pressures still lingering. Meanwhile, US inflation remains sticky, but with the Fed leaning toward a “higher-for-longer” stance rather than aggressive tightening, the greenback has shown signs of exhaustion against risk-linked currencies like AUD.
Technically, the price has respected the 0.6350 support level and is now forming higher lows. The breakout of the neckline around 0.6450 could accelerate bullish momentum, especially if accompanied by a strong candle close and continued volume confirmation. The next resistance lies at 0.6550, with the larger structure aiming for a test of 0.6700. This aligns with broader market sentiment rotating into commodity currencies, particularly as China stimulus hopes and improving risk appetite lift AUD.
AUDUSD remains one of the more technically clean setups among the majors right now. With a bullish pattern forming, supportive fundamentals, and improving sentiment across risk assets, this is a setup that deserves close attention from traders looking to ride the next impulsive leg to the upside.

GBPJPY SHORT FORECAST Q2 W20 D13 Y25GBPJPY SHORT FORECAST Q2 W20 D13 Y25
Professional Risk Managers👋
Welcome back to another FRGNT chart update📈
Diving into some Forex setups using predominantly higher time frame order blocks alongside confirmation breaks of structure.
Let’s see what price action is telling us today!
💡Here are some trade confluences📝
✅Weekly order block rejection
✅Daily order block rejection
✅Intraday 15' order blocks
✅Gap fill
🔑 Remember, to participate in trading comes always with a degree of risk, therefore as professional risk managers it remains vital that we stick to our risk management plan as well as our trading strategies.
📈The rest, we leave to the balance of probabilities.
💡Fail to plan. Plan to fail.
🏆It has always been that simple.
❤️Good luck with your trading journey, I shall see you at the very top.
🎯Trade consistent, FRGNT X

GBPUSD - SHORTI'm currently holding a bearish bias on GBP/JPY, anticipating a short-term correction after recent overbought conditions. Price action shows signs of exhaustion, and I'm expecting a move downward to fill the Fair Value Gaps (FVG) left behind during the previous bullish impulse.
Trade Rationale:
Overbought Conditions: After a strong upside move, price has reached a zone where buyers are losing momentum, hinting at a potential reversal or pullback.
Imbalance/FVG Zones: Clear inefficiencies exist below current price levels, and I expect the market to retrace to fill these imbalances as part of its natural rebalancing.
Structure & Supply: The market is showing reaction near a significant supply zone, which could act as the catalyst for bearish continuation.
Target Zones:
TP1: First demand zone where minor support may form — partials can be taken here.
TP2: Deeper demand zone aligned with previous consolidation — a high-probability area for price to react and potentially reverse or consolidate again.
Risk Management:
Stops are placed just above recent highs, invalidating the idea if the market breaks structure and continues bullish. The setup offers a favorable risk-to-reward ratio aligned with smart money concepts like imbalance fills and demand/supply reactions.
📉 Plan: Waiting for clear bearish confirmation (e.g., lower timeframe break of structure) before fully committing to the short position.

USDJPY Analysis todayHello traders, this is a complete multiple timeframe analysis of this pair. We see could find significant trading opportunities as per analysis upon price action confirmation we may take this trade. Smash the like button if you find value in this analysis and drop a comment if you have any questions or let me know which pair to cover in my next analysis.

SHORT ON GBP/JPYGJ Has finally pulled back to a Major Resistance area.
This previous high broke a low in the past and is a strong resistance zone.
I expect price to fall to the pervious swing low / demand are for over 300-400 pips.

GBPJPY.. PULLBACK[ OANDA:GBPJPY ] is approaching the key resistance zone at .
I'm watching closely for a valid reaction before considering any position.
*** If the level breaks and price retests it successfully, I may consider a counter-directional setup.

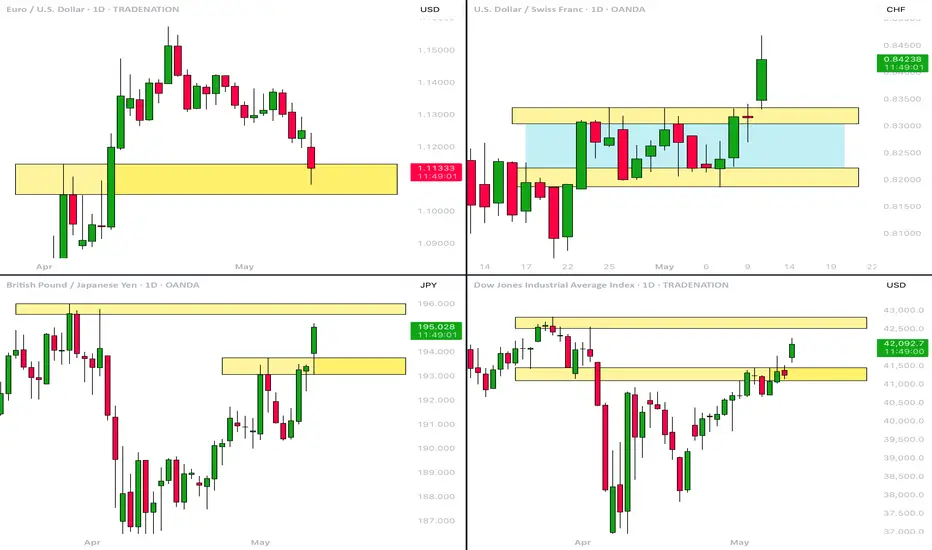
MarketBreakdown | EURUSD, USDCHF, GBPJPY, US30
Here are the updates & outlook for multiple instruments in my watch list.
1️⃣ #EURUSD daily time frame 🇪🇺🇺🇸
As I predicted, EURUSD dropped after the market opening.
The price is currently testing a significant daily demand zone.
Because the market looks relatively oversold after a selloff,
I think that there will be a high chance to see a pullback.
2️⃣ #USDCHF daily time frame 🇺🇸🇨🇭
The price completed a consolidation and a bullish accumulation
within a horizontal range on a daily.
Its resistance breakout is an important bullish signal.
Probabilities are high that the market will continue rising after a pullback.
3️⃣ #GBPJPY daily time frame 🇬🇧🇯🇵
The pair broke above a significant daily resistance cluster.
It opens a potential for more rise.
The market will most likely reach the underlined yellow resistance soon.
4️⃣ #US30 Index Dow Jones daily time frame 🇦🇺🇺🇸
The index successfully violated a major daily resistance.
Rise will continue and the market will reach the underlined
liquidity zone soon.
Do you agree with my market breakdown?
❤️Please, support my work with like, thank you!❤️
I am part of Trade Nation's Influencer program and receive a monthly fee for using their TradingView charts in my analysis.
GJ-Mon-12/05/25 TDA-Strong bull continuation from Friday!Analysis done directly on the chart
New week, new opportunity to learn,
to improve. To get better and better!
Not financial advice, DYOR.
Market Flow Strategy
Mister Y

GBPJPY 230 pip up?GBPJPY Multiple timeframe analysis and possible trade setup :
Monthly : Sharp rejection from a long term monthly support after a false breakout
Weekly : Previous week candle close with bullish pin bar and possible bounce back to the monthly high
Daily : There was daily support false breakdown @190 level then return back up with strong momentum
4H : Possible trade setup, bullish on slight pullback to the downside, possible target @195.60
If you enjoy this analysis like and any questions do not hesitate to ask in the comments

GBPJPY and USDJPY Bullish bounce?Hello traders, this is a complete multiple timeframe analysis of this pair. We see could find significant trading opportunities as per analysis upon price action confirmation we may take this trade. Smash the like button if you find value in this analysis and drop a comment if you have any questions or let me know which pair to cover in my next analysis.

GBPJPY - Correction Likely as New Week BeginsThe GBP/JPY chart shows a strong recovery from April lows near 185.00, but the pair now appears to be facing significant resistance at the highlighted box level around 193.50. After multiple attempts to break decisively above this zone in recent sessions, the price action is forming what looks like a short-term double top pattern, with the downward arrow indicating potential bearish momentum. This technical setup, combined with overbought conditions after the impressive rally from late April, suggests we may see some profit-taking and a corrective pullback in the beginning of the week. Traders should watch for a potential retracement toward the support level around 191.00-190.50 before the pair potentially attempts another run at the resistance zone.
Disclosure: I am part of Trade Nation's Influencer program and receive a monthly fee for using their TradingView charts in my analysis.

GBP-JPY Free Signal! Sell!
Hello,Traders!
GBP-JPY is trading in an
Uptrend and the pair is once
Again about to retest a horizontal
Resistance level of 193.665
So despite our bullish bias
We will enter a local short trade
On Monday with the Take Profit
Of 192.946 and the Stop Loss
Of 193.799 which is slightly
Above the upper bound of
The wide supply area
Sell!
Comment and subscribe to help us grow!
Check out other forecasts below too!
Disclosure: I am part of Trade Nation's Influencer program and receive a monthly fee for using their TradingView charts in my analysis.

GBPJPY is Holding above the Support , All Eyes on BuyingHello Traders
In This Chart GBPJPY HOURLY Forex Forecast By FOREX PLANET
today GBPJPY analysis 👆
🟢This Chart includes_ (GBPJPY market update)
🟢What is The Next Opportunity on GBPJPY Market
🟢how to Enter to the Valid Entry With Assurance Profit
This CHART is For Trader's that Want to Improve Their Technical Analysis Skills and Their Trading By Understanding How To Analyze The Market Using Multiple Timeframes and Understanding The Bigger Picture on the Charts

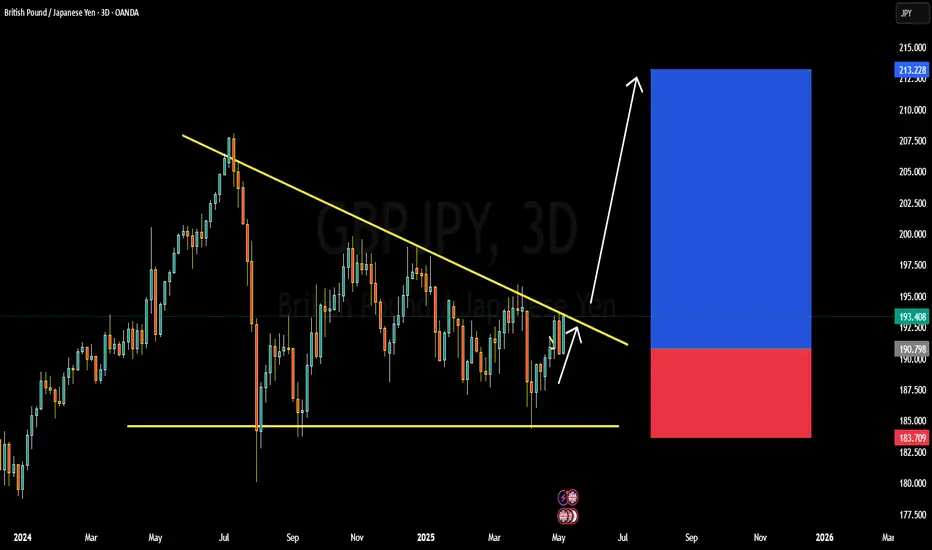
GBPJPY BULLISH OR BEARISH DETAILED ANALYSISGBPJPY is currently trading near 190.80 and is forming a significant breakout structure on the 3-day chart. After months of consolidation under a descending trendline, the pair is now coiling tightly, signaling a potential bullish breakout. The pair has respected the lower support range near 183.70 while pushing up against descending resistance multiple times. This squeeze pattern often precedes a major directional move, and with bullish momentum building, GBPJPY could be primed for a rally toward the 210.00 zone.
Fundamentally, the British pound is finding strong support from the latest hawkish commentary by the Bank of England, which has hinted that inflation remains sticky, keeping rate cut expectations delayed. On the other hand, the Japanese yen remains under consistent pressure due to the Bank of Japan's ultra-dovish stance and yield curve control policies. The BoJ’s reluctance to shift its policy outlook, coupled with soft macro data from Japan, is weakening the yen across the board.
Technically, a breakout and close above the descending trendline around 194.00 will be a key confirmation point. If this happens, bulls could dominate and push GBPJPY toward the 210.00 resistance zone in the medium term. The R\:R on this setup remains favorable with stops safely tucked below 183.70, giving this trade strong upside potential.
This pair is currently one of my top watchlist setups for May as both the technical and fundamental landscapes align. With bullish sentiment driving GBP strength and JPY weakness being a prevailing macro theme, GBPJPY could deliver a powerful upside continuation if the breakout confirms.
GBPJPY Bullish Breakout – Watch for Momentum Towards 194.60GBPJPY has broken out of a descending wedge and is now retesting the breakout zone near 189.50–189.80. This area aligns with previous structure support and the wedge's upper boundary. Price action indicates bullish momentum is resuming.
🔑 Key Levels:
Current Price: 189.66
Breakout Level: ~189.50
Resistance Targets:
TP1: 190.55 (recent resistance high)
TP2: 192.57
TP3: 194.61 (key supply/weekly resistance zone)
✅ Bullish Confluence:
Breakout from falling wedge pattern
Strong retest of breakout zone with consolidation
Higher low formation and bullish engulfing attempt
No major resistance until 190.50, providing clean upside
🧠 Fundamental Context:
CBI Report (UK): Sentiment and investment outlook among UK manufacturers is deteriorating, but the pound has shown resilience likely driven by broader risk-on market sentiment.
BOJ Outlook (Japan): IMF suggests BOJ is likely to delay further rate hikes due to global uncertainty from US tariffs, maintaining a dovish bias. This weakens the yen’s fundamental strength.
Market Mood: With Japan facing delayed policy tightening and UK's inflation still above target, GBPJPY favors the bullish case in the short term.
💡 Trade Idea:
Bias: Bullish above 189.30
Entry: On retest confirmation around 189.50
Target 1: 190.55
Target 2: 192.57
Target 3: 194.61
Stop Loss: Below 188.80
📌 Note: Keep an eye on US data and BOJ tone shifts. Any risk-off shift in global markets could affect yen strength unexpectedly.

XAUUSD SHORT TRADE TECH AGAINST FUNDAMENTALSHighly valuable metal gold has lost its shine even after India Pakistan war tensions. Is tariff war more valuable than real war? Anyways let see how this short analysis go .

DeGRAM | GBPJPY Formed a Falling Wedge📊 Technical Analysis
● Clean breakout above the 190.3 –191.3 demand zone and retest of the grey downtrend line sets a bullish base.
● The small falling wedge points to horizontal resistance at 193.5.
💡 Fundamental Analysis
● BoE minutes reveal a hawkish tilt, cementing a wide UK–Japan yield gap as markets push back rate-cut bets .
● BoJ stays ultra-dovish: April CPI slowed to 2.3 % YoY, keeping the yen soft against higher-yielding currencies .
✨ Summary
Demand-zone hold + hawkish BoE/dovish BoJ underline a short-term long bias: targets 193.5 → 196; invalidation on a close below 190.
-------------------
Share your opinion in the comments and support the idea with like. Thanks for your support!

EUR/USD: Bearish Structure Intact — Lower Lows Ahead? (READ)By analyzing the #EURUSD chart on the 3-day timeframe, we can see that the price is currently trading around 1.136. If the price manages to stay below the 1.1414 level, we can expect further downside from this pair. The possible bearish targets are 1.128, 1.11480, and 1.10 respectively.
Please support me with your likes and comments to motivate me to share more analysis with you and share your opinion about the possible trend of this chart with me !
Best Regards , Arman Shaban

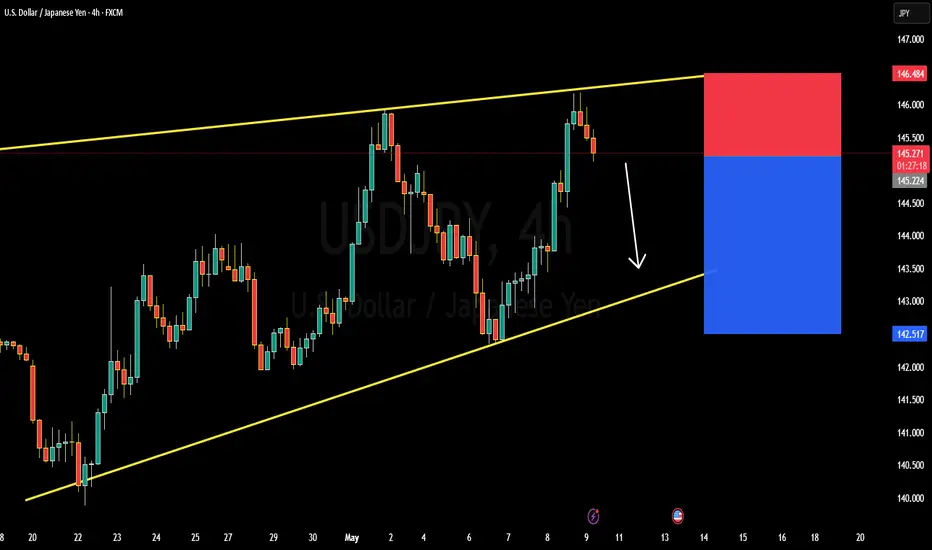
USDJPY BULLISH OR BEARISH DETAILED TECHNICAL AND FUNDAMENTALSUSDJPY is currently trading around 145.300 and showing clear signs of bearish pressure from the upper resistance of a broad ascending channel. The market structure suggests a potential rejection, and price action confirms the formation of a rising wedge pattern—a classically bearish setup indicating an upcoming correction. With momentum slowing and sellers starting to step in, I anticipate a move toward the 143.500 zone as price seeks support near the lower trendline.
From a fundamental standpoint, the US dollar is experiencing slight weakness today following softer-than-expected jobless claims data and a cooling CPI projection. Meanwhile, the Japanese yen is finding strength from renewed risk-off sentiment and speculation that the Bank of Japan may subtly shift its ultra-loose stance if inflationary pressures persist. This macro backdrop adds more weight to the potential downside in USDJPY over the next few sessions.
Technically, the price has tested the 146.000 resistance zone multiple times but failed to break above it with conviction. This repeated rejection near the top of the channel adds credibility to the bearish outlook. A breakdown from the rising wedge would likely accelerate selling pressure, pushing USDJPY toward the 143.500 level, which aligns well with previous demand zones and the channel’s lower boundary.
I’m closely watching for confirmation below the 145.000 level, which would act as a trigger for short positions. With risk-reward favoring the bears and fundamentals aligning with the technical setup, this is a solid opportunity for those looking to capitalize on a potential pullback in USDJPY.