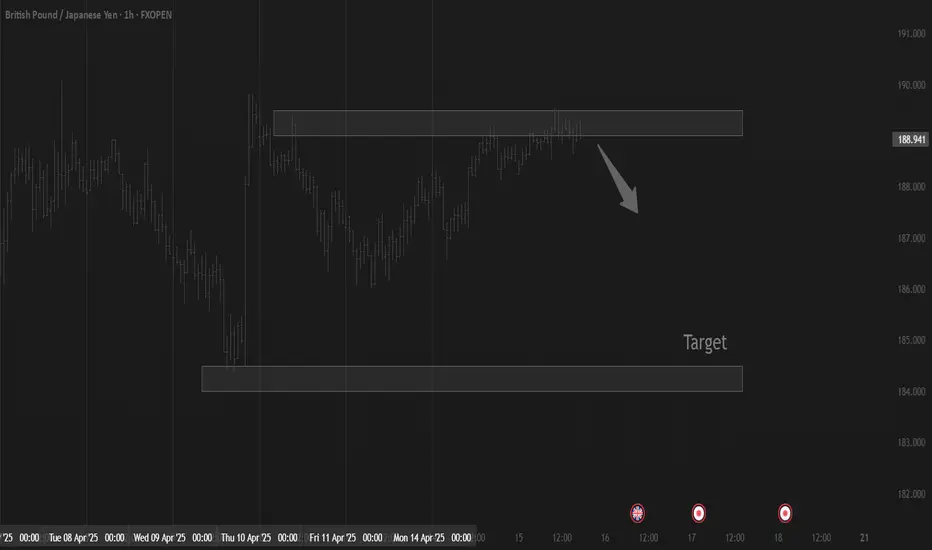
GBPJPY LONG FORECAST Q2 W16 D16 Y25GBPJPY LONG FORECAST Q2 W16 D16 Y25
Key- to await price to show its play.
The longer term retrace is of course the set that FRGNT would potentially call an A - set up, higher time frame order block long, lower time frame breaks, you know the drill. BUT what if price action does not match your forecast. We must adapt if the position makes sense.
Let's see if GBP has the legs to break 15' structure in London.
We are interested.
One thing is for sure, GJ moves and we endeavour to be part of those dances!
-15' break of structure first prior immediate long.
Trade well!
FRGNT X
GBPJPY

WHY GBPAUD IS BULLISH ?? DETAILED ANALYSISGBPAUD is currently breaking out of a textbook falling wedge pattern on the 2H timeframe, a structure widely recognized for its bullish implications. After an aggressive bullish impulse at the start of April, the pair entered a consolidation phase marked by lower highs and lower lows. However, the recent breakout above wedge resistance signals a potential continuation of the prior bullish trend. This clean technical breakout, combined with tight consolidation, suggests a build-up of bullish pressure likely to push the pair toward the 2.1300–2.1600 zone.
From a technical standpoint, the falling wedge pattern acted as a corrective structure following strong bullish momentum. The breakout confirms buyers stepping back in, with a solid support base forming around 2.0800. As long as GBPAUD holds above this level, the bullish outlook remains intact. Volume has also started to increase post-breakout, which typically reinforces the validity of the move.
On the fundamental side, the British pound is gaining traction amid optimistic UK economic indicators and renewed hawkish undertones from the Bank of England. Traders are pricing in a more cautious approach to rate cuts compared to other central banks, which gives GBP an edge. On the other hand, the Australian dollar is under pressure due to weak employment data and China-related risk sentiment, both of which are weighing on AUD. This divergence creates a favorable macro backdrop for GBPAUD bulls.
This setup is gaining attention among traders on TradingView due to its clear structure and the alignment between technicals and fundamentals. With a bullish breakout confirmed, I'm expecting follow-through momentum in the sessions ahead. Watching for intraday retests near 2.0850 for possible re-entries, with a medium-term upside target near the 2.1500 zone.

Trading balanceTrading balance The price of the asset has rebounded from the balance zone. With the prospect of growth into the resistance zone.
Why Gold bullish ?? Detailed AnalysisXAUUSD is currently showing strong bullish momentum after completing a clean retest of the breakout zone near 3200. Price action confirmed this level as new support, and we are now seeing price bounce back with conviction. This structure is a classic continuation setup, and as long as price holds above the retest zone, the next leg higher toward the 3265–3300 range looks highly probable.
Technically, the 8H chart displays a strong impulse move followed by a controlled pullback into a demand zone. Price formed a higher low and immediately pushed back into bullish structure, signaling continuation. If gold stays above the 3200–3180 level, I expect buyers to maintain control, and the market could drive further upside targeting the previous swing high and beyond. The rejection wicks and volume spike at the base of the retest add to the bullish conviction.
From a fundamental standpoint, gold continues to benefit from a combination of factors including global uncertainty, persistent inflation, and dovish sentiment from major central banks. With US inflation data keeping rate cut expectations alive and the dollar softening slightly, gold remains a preferred hedge. Additionally, increased demand from central banks and institutions continues to support gold's long-term uptrend.
This setup is one of the most closely watched on TradingView right now due to its clean structure and strong confluence. With macro and technical conditions aligned, this bounce off support could lead to another wave of bullish momentum. As a professional trader, I’m staying long-biased above 3180 and will look for momentum confirmation to scale into the next bullish wave.

GBP/JPY) Bearish analysis Read The ChaptianSMC Trading point update
GBP/JPY 2-hour chart outlines a clear bearish setup within a well-defined downtrend. Here's a breakdown of the trading idea:
---
Technical Overview:
Downtrend Channel:
The pair is respecting a downward-sloping channel, with repeated rejections at the upper boundary, confirming bearish control.
Resistance Zone (~187.8 - 188.5):
Price has reached a highlighted resistance area that aligns with previous swing highs and trendline resistance — marked with red arrows for prior rejections.
Bearish Projection:
The analysis anticipates a rejection from this resistance zone followed by a downward impulse move. A pullback is expected, but continuation toward the target support zone around 179.150 is likely.
Target Zone (~179.150):
This level lines up with previous price action and matches the measured move (blue vertical box), adding confluence.
EMA 200 (around 190.36):
Price is well below the 200 EMA, reinforcing the bearish structure and trend bias.
RSI Indicator (~52):
RSI is slightly above 50 but not bullish — this neutral reading suggests the pair has room to drop if resistance holds.
Mr SMC Trading point
---
Trading Idea Summary:
Bias: Bearish
Entry Zone: 187.8 – 188.5 (resistance)
Confirmation: Bearish candlestick pattern or rejection signal
Target: 179.150
Invalidation: Break and close above 190.365 (above EMA 200 and prior highs)
---
plase support boost 🚀 analysis follow)

GBPJPY:SIGNALHello dears
Considering the heavy decline we had, you can see that buyers entered with a strong bullish spike, which is a good sign...
Now we can buy in steps on the price pullback and move with it to the specified targets, of course with capital and risk management.
*Trade safely with us*

GBPJPY Is Going Down! Sell!
Please, check our technical outlook for GBPJPY.
Time Frame: 45m
Current Trend: Bearish
Sentiment: Overbought (based on 7-period RSI)
Forecast: Bearish
The price is testing a key resistance 188.674.
Taking into consideration the current market trend & overbought RSI, chances will be high to see a bearish movement to the downside at least to 187.917 level.
P.S
Overbought describes a period of time where there has been a significant and consistent upward move in price over a period of time without much pullback.
Disclosure: I am part of Trade Nation's Influencer program and receive a monthly fee for using their TradingView charts in my analysis.
Like and subscribe and comment my ideas if you enjoy them!

GBP/JPY "The Beast" Forex Market Heist Plan (Scalping/Day Trade)🌟Hi! Hola! Ola! Bonjour! Hallo! Marhaba!🌟
Dear Money Makers & Robbers, 🤑 💰💸✈️
Based on 🔥Thief Trading style technical and fundamental analysis🔥, here is our master plan to heist the GBP/JPY "The Beast" Forex Market. Please adhere to the strategy I've outlined in the chart, which emphasizes long entry. Our aim is to escape near the high-risk MA Zone. Risky level, overbought market, consolidation, trend reversal, trap at the level where traders and bearish robbers are stronger. 🏆💸"Take profit and treat yourself, traders. You deserve it!💪🏆🎉
Entry 📈 : "The heist is on! Wait for the MA breakout (189.000) then make your move - Bullish profits await!"
however I advise to Place Buy stop orders above the Moving average (or) Place buy limit orders within a 15 or 30 minute timeframe most recent or swing, low or high level for Pullback entries.
📌I strongly advise you to set an "alert (Alarm)" on your chart so you can see when the breakout entry occurs.
Stop Loss 🛑: "🔊 Yo, listen up! 🗣️ If you're lookin' to get in on a buy stop order, don't even think about settin' that stop loss till after the breakout 🚀. You feel me? Now, if you're smart, you'll place that stop loss where I told you to 📍, but if you're a rebel, you can put it wherever you like 🤪 - just don't say I didn't warn you ⚠️. You're playin' with fire 🔥, and it's your risk, not mine 👊."
📍 Thief SL placed at the recent/swing low level Using the 30mins timeframe (186.500) Day trade basis.
📍 SL is based on your risk of the trade, lot size and how many multiple orders you have to take.
🏴☠️Target 🎯: 191.700 (or) Escape Before the Target
🧲Scalpers, take note 👀 : only scalp on the Long side. If you have a lot of money, you can go straight away; if not, you can join swing traders and carry out the robbery plan. Use trailing SL to safeguard your money 💰.
💰💵💸GBP/JPY "The Beast" Forex Market Heist Plan (Scalping/Day) is currently experiencing a bullishness,., driven by several key factors. 👇👇👇
📰🗞️Get & Read the Fundamental, Macro, COT Report, Quantitative Analysis, Sentimental Outlook, Intermarket Analysis, Future trend targets and Overall outlook score..., go ahead to check 👉👉👉🔗
⚠️Trading Alert : News Releases and Position Management 📰 🗞️ 🚫🚏
As a reminder, news releases can have a significant impact on market prices and volatility. To minimize potential losses and protect your running positions,
we recommend the following:
Avoid taking new trades during news releases
Use trailing stop-loss orders to protect your running positions and lock in profits
💖Supporting our robbery plan 💥Hit the Boost Button💥 will enable us to effortlessly make and steal money 💰💵. Boost the strength of our robbery team. Every day in this market make money with ease by using the Thief Trading Style.🏆💪🤝❤️🎉🚀
I'll see you soon with another heist plan, so stay tuned 🤑🐱👤🤗🤩

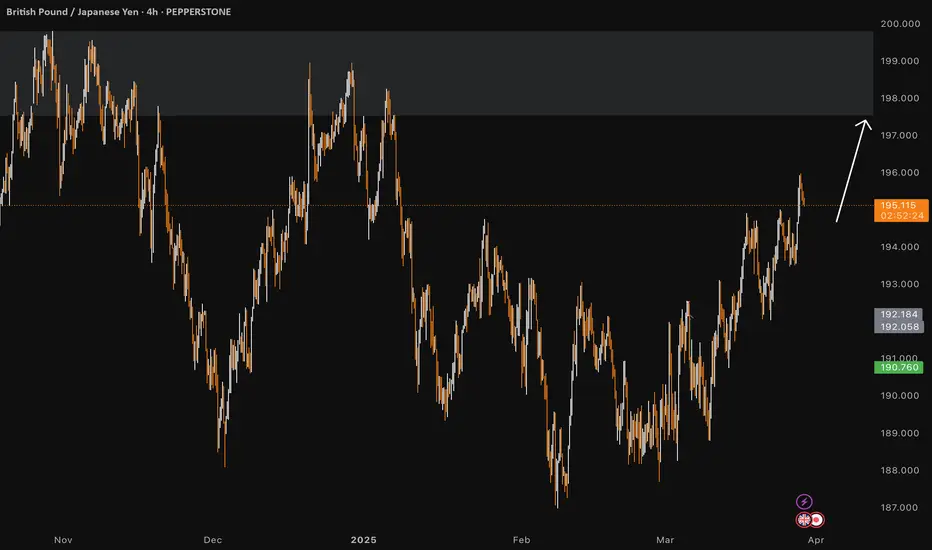
GBPJPY LONG FORECAST Q2 W16 D14 Y25GBPJPY LONG FORECAST Q2 W16 D14 Y25
Good morning Monday!
Positive weekly rejection via weekly order block.
Let's await a break of structure!
FRGNT X

GBPJPY Discretionary Analysis: Aiming for the Sky I’m not entirely sure, but my gut says it’ll go up. If not, I lose some money and my gut clearly needs more back testing. Profit if I’m right, lesson if I’m wrong! 👌
Just my opinion, not financial advice.
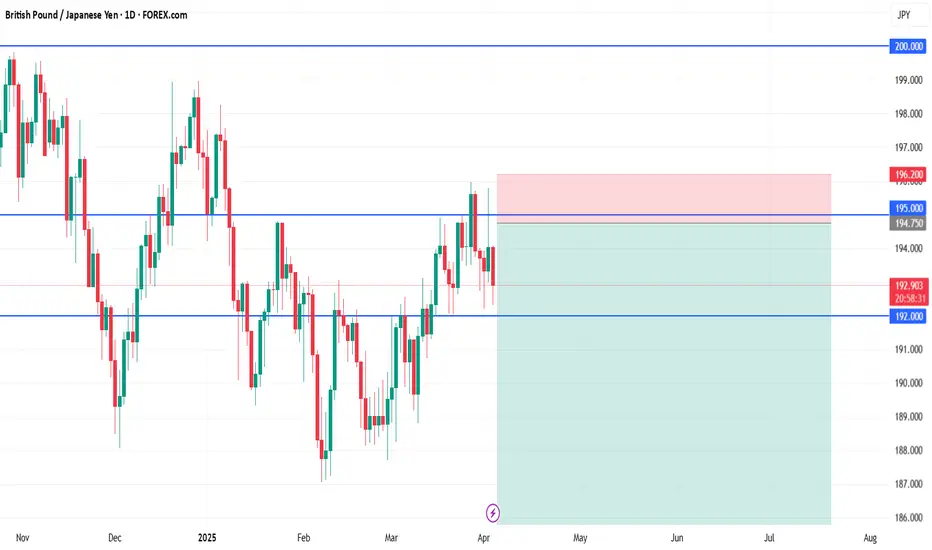
GBP/JPY short🧩 GBP/JPY Swing Short Setup
📍 Entry:
Sell Limit: 194.75
🛡️ Stop Loss (Above Resistance Wick):
SL: 196.20
→ Covers minor breakout/fakeout above 195 zone while protecting against invalidation
🎯 Take Profits:
TP1: 190.00
(Structure floor + first major reaction zone)
TP2: 185.00
(Clean horizontal support and demand zone)
TP3 (Swing Target): 180.00
(Large macro target — monthly structure retest)
🧠 Rationale Recap:
Price is consolidating just under multi-year resistance (195–200)
Fundamentals align: GBP weakening, JPY strengthening in risk-off environment
Strong R:R, clean rejection zone, and macro pressure potential
WHY USDCAD IS DROPPING ?? DETAILED ANALYSISUSDCAD is currently reacting from a strong daily supply zone after a sustained upside move, and we are now seeing clear signs of bearish structure forming. Price has broken through multiple short-term supports and is now trading around the 1.38600 level, sitting right above a key demand zone that held in late 2023. Given the aggressive sell-off and rejection from the 1.43400–1.44500 resistance range, the market appears to be preparing for a deeper retracement. My bearish target is 1.34600, which aligns with the previous major demand level and psychological support.
Technically, the chart shows two strong bearish engulfing moves from supply, followed by lower highs and lower lows. This shift in structure combined with repeated rejections from resistance zones indicates the momentum is shifting in favor of sellers. If the current zone fails to hold on the retest bounce, we could see a strong continuation leg down. I expect a minor correction toward 1.41600 before further downside resumes, offering an ideal risk-reward short setup for swing traders.
From a fundamental perspective, the Canadian Dollar remains firm, supported by strong crude oil prices as WTI holds above $85 amid geopolitical tensions and production cuts. At the same time, recent U.S. data has shown mixed signals, with sticky inflation keeping the Fed cautious, but slowing job growth and consumer spending raising concerns. If oil prices remain elevated and Fed rate cut expectations increase later this quarter, the USDCAD pair is likely to stay under pressure.
With CAD strength driven by energy markets and the USD facing headwinds from softening macro indicators, this setup aligns both technically and fundamentally for a bearish continuation. I’ll be watching for clean rejections from the 1.40000–1.41600 resistance zone before loading more shorts toward 1.34600. Patience is key — this could be a high-probability move in the coming weeks.

GBPJPY Channel Down bottom reached. Rebound expected.Last time we looked into the GBPJPY pair (March 20, see chart below) we had a sell signal which dully delivered our 188.550 Target:
This time we have the price at the bottom (Lower Lows trend-line) of the extended Channel Down, with the 1D RSI almost reaching the 30.00 oversold limit. All such bottoms were followed by a rebound that hit at least the 1D MA50 (blue trend-line) before a new Channel Down Lower Low.
As a result, we are going for a short-term buy here, targeting a potential contact with the 1D MA50 at 190.250.
-------------------------------------------------------------------------------
** Please LIKE 👍, FOLLOW ✅, SHARE 🙌 and COMMENT ✍ if you enjoy this idea! Also share your ideas and charts in the comments section below! This is best way to keep it relevant, support us, keep the content here free and allow the idea to reach as many people as possible. **
-------------------------------------------------------------------------------
Disclosure: I am part of Trade Nation's Influencer program and receive a monthly fee for using their TradingView charts in my analysis.
💸💸💸💸💸💸
👇 👇 👇 👇 👇 👇

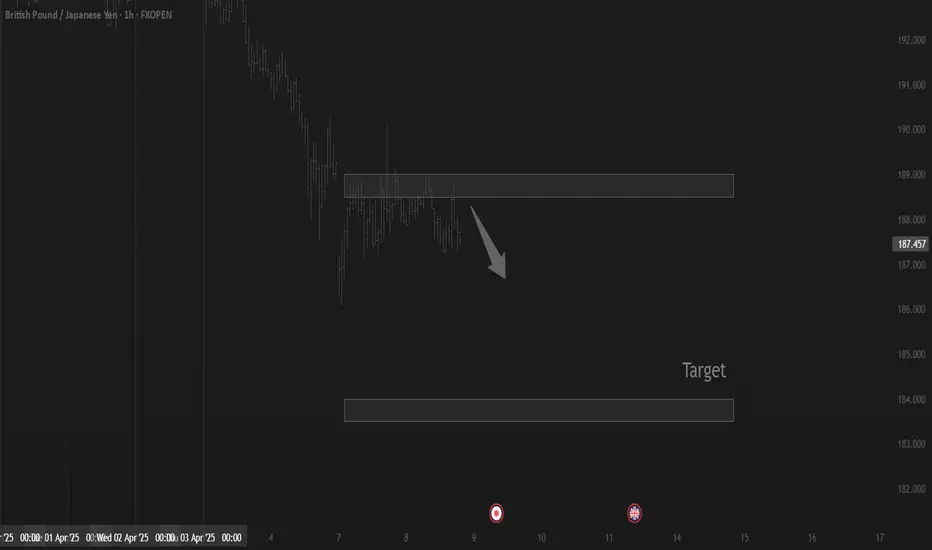
GBP/JPY Triangle Breakout (11.04.2025)The GBP/JPY Pair on the M30 timeframe presents a Potential Selling Opportunity due to a recent Formation of a Triangle Breakout Pattern. This suggests a shift in momentum towards the downside in the coming hours.
Possible Short Trade:
Entry: Consider Entering A Short Position around Trendline Of The Pattern.
Target Levels:
1st Support – 184.40
2nd Support – 182.60
🎁 Please hit the like button and
🎁 Leave a comment to support for My Post !
Your likes and comments are incredibly motivating and will encourage me to share more analysis with you.
Best Regards, KABHI_TA_TRADING
Thank you.

Bullish bounce off 61.8% Fibonacci retracement?GBP/JPY has bounced off the support level which is a pullback support that aligns with the 61.8% Fibonacci retracement and could rise from this level to our take profit.
Entry: 186.61
Why we like it:
There is a pullback support level that lines up with the 61.8% Fibonacci retracement.
Stop loss: 184.39
Why we like it:
There is a pullback support level.
Take profit: 189.96
Why we like it:
There is a pullback resistance level.
Enjoying your TradingView experience? Review us!
Please be advised that the information presented on TradingView is provided to Vantage (‘Vantage Global Limited’, ‘we’) by a third-party provider (‘Everest Fortune Group’). Please be reminded that you are solely responsible for the trading decisions on your account. There is a very high degree of risk involved in trading. Any information and/or content is intended entirely for research, educational and informational purposes only and does not constitute investment or consultation advice or investment strategy. The information is not tailored to the investment needs of any specific person and therefore does not involve a consideration of any of the investment objectives, financial situation or needs of any viewer that may receive it. Kindly also note that past performance is not a reliable indicator of future results. Actual results may differ materially from those anticipated in forward-looking or past performance statements. We assume no liability as to the accuracy or completeness of any of the information and/or content provided herein and the Company cannot be held responsible for any omission, mistake nor for any loss or damage including without limitation to any loss of profit which may arise from reliance on any information supplied by Everest Fortune Group.

GBPJPY downtrend continuation below 190.96The GBPJPY pair is exhibiting a bearish sentiment, reinforced by the ongoing downtrend. The key trading level to watch is at 190,96 which represents the current intraday swing high.
In the short term, an oversold rally from current levels, followed by a bearish rejection at the 190.96 resistance, could lead to a downside move targeting support at 184.78 with further potential declines to 182.70 and 177.80 over a longer timeframe.
On the other hand, a confirmed breakout above the 190.96 resistance level and a daily close above that mark would invalidate the bearish outlook. This scenario could pave the way for a continuation of the rally, aiming to retest the 192.65 resistance, with a potential extension to 194.33 levels.
Conclusion:
Currently, the GBPJPY sentiment remains bearish, with the 190.96 level acting as a pivotal resistance. Traders should watch for either a bearish rejection at this level or a breakout and daily close above it to determine the next directional move. Caution is advised until the price action confirms a clear break or rejection.
This communication is for informational purposes only and should not be viewed as any form of recommendation as to a particular course of action or as investment advice. It is not intended as an offer or solicitation for the purchase or sale of any financial instrument or as an official confirmation of any transaction. Opinions, estimates and assumptions expressed herein are made as of the date of this communication and are subject to change without notice. This communication has been prepared based upon information, including market prices, data and other information, believed to be reliable; however, Trade Nation does not warrant its completeness or accuracy. All market prices and market data contained in or attached to this communication are indicative and subject to change without notice.

GBPJPY: From Oversold Bounce to Potential DowntrendFenzoFx—The GBP/JPY currency pair bounced from 184.42 due to RSI 14 being oversold. As of now, it trades near 187.7, having erased 1.0% of recent gains.
The trend remains bearish with prices below the 50-period simple moving average and the 50.0% Fibonacci resistance level at 190.2. Support is at 187.0, and a drop below this could target 184.42.
The Bullish Scenario
However, if GBP/JPY surpasses 190.2, bullish momentum may extend to 192.0.
Enter our Forex Analysis Contest to win a prize pool of $160.0 every week >>> FenzoFx Decentralized Forex Broker

USDJPY and GBPJPY Analysis todayHello traders, this is a complete multiple timeframe analysis of this pair. We see could find significant trading opportunities as per analysis upon price action confirmation we may take this trade. Smash the like button if you find value in this analysis and drop a comment if you have any questions or let me know which pair to cover in my next analysis.

A possible bearish movement GBPJPY has been on a bullish run for sometime, currently there is some sell opportunity. lets look if its a bearish movement or just a retracement

USDCAD IS DRROPPING. DETAILED TECHNICAL AND FUNDAMENTALSUSDCAD is currently trading around 1.4200 after a clean retest of a previously broken support zone, which has now turned into a strong resistance level. Price action is confirming the bearish structure as we see a gradual yet consistent drop from the highs of 1.4540. With the rejection seen from the supply zone and recent lower high formation, momentum is shifting further in favor of the sellers. I am now targeting 1.3800 for the next key level, aligning with both technical confluence and fundamental sentiment.
Technically, the structure is clear: we had a failed breakout above 1.4450, followed by a decisive bearish engulfing move. The market then completed a textbook retest at the 1.4340–1.4450 supply zone before resuming the downside move. The current formation on the 12H chart shows a lower low and lower high sequence intact, signaling a trend continuation to the downside. The highlighted zones also provide ideal reward-to-risk setups for continuation traders.
From a fundamental perspective, the Canadian dollar is gaining strength due to rising oil prices, with WTI crude now climbing back above the $85 mark. This directly supports the loonie given Canada’s oil-export-driven economy. Meanwhile, US economic uncertainty around upcoming CPI data and shifting Fed rate cut expectations continue to weigh on the dollar’s upside momentum. Additionally, recent risk-on sentiment in global markets is pushing flows into commodity-linked currencies like CAD.
With technicals and fundamentals aligning, I remain firmly bearish on USDCAD. As long as price remains below the 1.4340 resistance, I’m looking for continuation toward the major demand zone near 1.3830–1.3800. This setup offers a clean 1:3+ risk-to-reward profile, and I will be scaling in further on bearish confirmations as the market progresses.

Nas100 continuation lower?Good evening traders, I am busy with my market recap and I saw this beautiful idea on nas100/US100 or whatever name your broker uses.
Indices have been pretty bearish from our understanding as we saw price crush, well my thought process when analysing chart is question based, question like did price move above our weekly opening price to give us our manipulation phase in the power of 3, and in this case or in the case of this analysis the answer is yes it moved higher following this week’s open. Today in the 1 hour TF we have a structure shift lower and before we can do anything we need to see price come higher to Atleast the FVG that is marked on the chart, I know ICT teaches deeper about FVG but for me it’s fine for price to completely cover it. Or if maybe the OTE(optimal trade entry) is the method you use to enter trades it’s still fine or even order blocks if maybe you can see any than it’s also completely fine.
Currently price is showing momentum lower and maybe it’ll close prices lower but if we close the daily candle above the midpoint of the weekly gap we can expect price go than trigger the limit.

Trading balanceTrading balance The price of the asset has rebounded from the balance zone. With the prospect of growth into the resistance zone.
AUDCAD…When is enough, enough?!Good day traders, we back with another beautiful idea on AUDCAD but here we not focusing on buying and selling but rather to test a study I’m currently busy with, well in a nutshell I’m studying inside day candle stick pattern, currently on the 4hour TF we have a big bearish candle followed by a lot of small bullish candle sticks but all that trading is happening inside that one big 4 hour candle.
How I like to interpret this pattern in my years of back testing this pattern(still am)😂 inside day candles can be used as both a continuation or a reversal pattern but but depending on the market structure!! What price is doing currently on the 1hr TF I like to explain it to my friends as a beautiful lady who only wants your money 😂😂 because price is making traders believe that the reversal has started but truth is price is still gonna move lower the the liquidity resting below before moving higher to reverse the big move we saw last week and beginning of this current week.
We can expect price to take to low of Monday than shift structure higher to confirm our bias that price will reverse. Remember we study price and time not technical analysis.
