GBPJPY | 27.03.2025SELL 194.400 | STOP 195.400 | TAKE 193.200 | Retest of this week's local highs. Consider the decline and consolidation of the price below the level of 193.500.
GBPJPY

GBPJPY Is Going Up! Buy!
Here is our detailed technical review for GBPJPY.
Time Frame: 5h
Current Trend: Bullish
Sentiment: Oversold (based on 7-period RSI)
Forecast: Bullish
The market is approaching a significant support area 194.512.
The underlined horizontal cluster clearly indicates a highly probable bullish movement with target 196.392 level.
P.S
The term oversold refers to a condition where an asset has traded lower in price and has the potential for a price bounce.
Overbought refers to market scenarios where the instrument is traded considerably higher than its fair value. Overvaluation is caused by market sentiments when there is positive news.
Disclosure: I am part of Trade Nation's Influencer program and receive a monthly fee for using their TradingView charts in my analysis.
Like and subscribe and comment my ideas if you enjoy them!

GBP/JPY: Fibonacci Levels Signal Possible Bullish ContinuationTechnical Analysis: GBP/JPY Bullish Continuation 📈
The GBP/JPY chart provided highlights a bullish trend continuation setup, supported by Fibonacci retracement levels. Here's a detailed breakdown:
📊 Fibonacci Levels in Play
The swing low to swing high has been plotted, revealing key retracement levels.
The price is currently near the 50% retracement level (194.326), a critical support zone in bullish trends.
The 61.8% retracement level (194.165), often called the "golden ratio," serves as a stronger support below this.
📈 Bullish Bias
The overall trend remains bullish, with higher highs and higher lows visible on the chart.
The corrective pullback to Fibonacci levels suggests a potential continuation of the upward momentum.
🎯 Target Projection
The arrow on the chart points to a projected move toward the 195.683 level, aligning with the -50% Fibonacci extension.
This target aligns with the bullish trend and indicates a potential breakout above the recent high.
🔍 Confluence and Confirmation
The price action shows signs of rejection at the 50% retracement level, indicating buyer interest.
A bullish candlestick pattern or increased volume near this zone would further confirm the upward move.
⚠️ Risk Management
The 61.8% level (194.165) is a key invalidation point. A break below this level could signal a deeper retracement toward the 78.6% level (193.937) or even the swing low.
This analysis is for informational purposes only and does not constitute financial advice. Trading involves significant risk, and you should only trade with capital you can afford to lose. Always conduct your own research and consult with a financial advisor before making trading decisions.


GBP/JPY – Breakout Incoming Hi Traders !, The price is forming an ascending triangle on the H1 chart. Watching for a breakout:
✅ Bullish if it breaks 194.92 with a pullback → Target 198.94.
❌ Bearish if it drops below 193.55 with confirmation → Target 187.35.
Waiting for volume validation , What do you think?
Disclaimer: This is not financial advice. Always do your own research and trade responsibly.

GBPJPY - Expecting Bearish Continuation In The Short TermM15 - Double uptrend line breakout
Lower Lows
Strong bearish momentum
Potential drop after retraces if the strong resistance zone will not be broken.
If you enjoy this idea, don’t forget to LIKE 👍, FOLLOW ✅, SHARE 🙌, and COMMENT ✍! Drop your thoughts and charts below to keep the discussion going. Your support helps keep this content free and reach more people! 🚀
-------------------------------------------------------------------------------------------------------------------
Disclosure: I am part of Trade Nation's Influencer program and receive a monthly fee for using their TradingView charts in my analysis.

GBPJPY has drawn the "Line in the Sand!"Intraday Update: With the weaker CPI, the GBPJPY slipped from resistance and the budget statement will be out a little later in the session. The GBPJPY has forged key resistance at the 195.00 level as noted all week. While below the risk is for a move back to the 192.00 level now.

GBPJPY | 26.03.2025SELL 194.900 | STOP 195.600 | TAKE 193.700 | We expect volatile movements in the instrument against the background of the data published today. The price is likely to consolidate firmly below the 194,000 level, followed by the formation of a medium-term downward movement towards the targets of 192.700-192.000.

GBPJPY: Are Bulls Ready To Rally?GJ is still in an uptrend so I am buying. My entry was 193.825
Bullish Confirmations
- M15 and M30 Bullish CHoCH
- M15 Bullish breaker blocks
- Formed new HH and HL
- Bullish FVGs
🟢BUY GJ
SL 43 pips
TP1 20 pips
TP2 50 pips
TP3 100 pips

GBP/JPY: Bullish Momentum Builds Near Key ResistanceThe GBP/JPY market is currently developing an ABC pattern, with point C forming near the 196.000 level. Recently, the price broke above both a downward trendline and the 194.000 support, signaling a potential shift in momentum.
At present, the pair is testing last week’s high, which aligns with the 195.000 psychological level. A strong bullish candle has emerged on the daily chart, indicating growing bullish pressure. The market may enter a consolidation phase around this level before attempting a breakout above the previous week’s high. The next target is the resistance zone at 195.750

GBPJPY | 25.03.2025SELL 194.700 | STOP 195.500 | TAKE 193.700 | We assume a corrective downward movement to the nearest range of local support within the framework of the main upward medium-term trend.

Trading balanceThe price is currently in the resistance zone and has prospects of entering the balance zone. If the balance zone is overcome, the price is able to reach the target near the opposite resistance zone.

GBPJPY Will Go Higher! Buy!
Here is our detailed technical review for GBPJPY.
Time Frame: 2h
Current Trend: Bullish
Sentiment: Oversold (based on 7-period RSI)
Forecast: Bullish
The market is approaching a significant support area 193.677.
The underlined horizontal cluster clearly indicates a highly probable bullish movement with target 194.756 level.
P.S
The term oversold refers to a condition where an asset has traded lower in price and has the potential for a price bounce.
Overbought refers to market scenarios where the instrument is traded considerably higher than its fair value. Overvaluation is caused by market sentiments when there is positive news.
Disclosure: I am part of Trade Nation's Influencer program and receive a monthly fee for using their TradingView charts in my analysis.
Like and subscribe and comment my ideas if you enjoy them!

GBPJPY: Short Signal with Entry/SL/TP
GBPJPY
- Classic bearish formation
- Our team expects fall
SUGGESTED TRADE:
Swing Trade
Sell GBPJPY
Entry Level - 194.59
Sl - 195.64
Tp - 192.40
Our Risk - 1%
Start protection of your profits from lower levels
Disclosure: I am part of Trade Nation's Influencer program and receive a monthly fee for using their TradingView charts in my analysis.
❤️ Please, support our work with like & comment! ❤️

Why GBPJPY is bullish ?? Detailed Technical and FundamentalsGBPJPY is currently trading around 193.000, with technical analysis indicating a potential bullish breakout that could yield gains exceeding 300 pips, targeting the 198.000 level. This anticipated movement is supported by the pair’s recent behavior, where it edged higher to 194.89 before a slight retreat, suggesting consolidation ahead of a possible upward surge. A strong breakout from the current resistance zone could trigger an aggressive bullish wave.
Fundamentally, the British pound has shown resilience, bolstered by stable economic indicators and a proactive monetary policy stance from the Bank of England. Meanwhile, the Japanese yen has experienced depreciation, influenced by the Bank of Japan’s commitment to maintaining ultra-loose monetary policies. The widening interest rate differential between the UK and Japan favors a stronger GBP, adding bullish momentum to the pair.
Technical indicators further reinforce the bullish outlook for GBP/JPY. The pair has been trading within a consolidation range, and a breakout above the current resistance level could signal the continuation of the prevailing uptrend. Moving averages and oscillators are aligning to support this bullish scenario, with the potential to reach the 198.000 target. Volume analysis also suggests growing buying pressure, which could accelerate the upward move once resistance is breached.
Traders should monitor key resistance levels closely, as a confirmed breakout could present a lucrative opportunity to capitalize on the anticipated 300-pip movement. Implementing robust risk management strategies, such as setting appropriate stop-loss orders, is essential to mitigate potential market volatility. Staying informed about upcoming economic data releases and central bank communications will also be crucial in navigating this trading opportunity effectively.

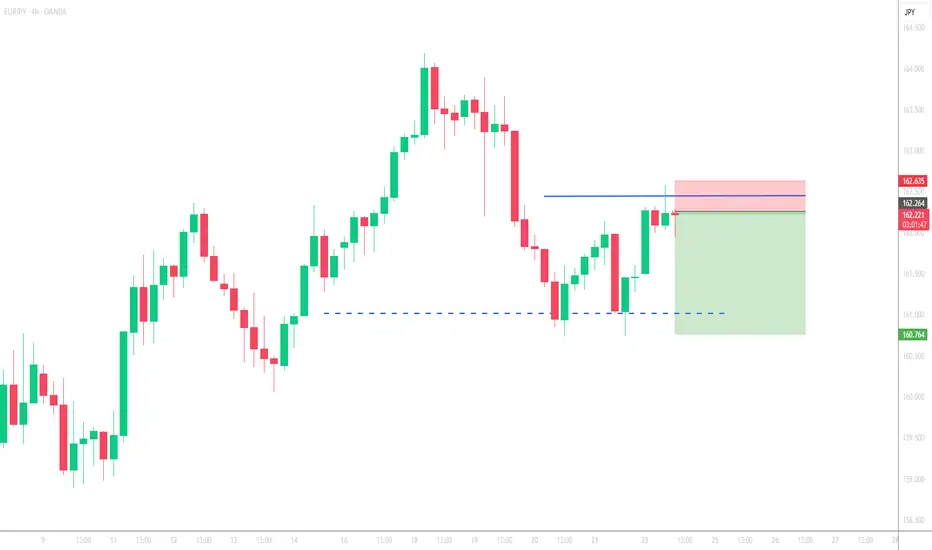
EURJPY SellEURJPY sell signal on H4 Timeframe. JPY is bullish this week, we see FakeBreakOut on H4 candle. Risk reward 1/4
GBP/JPY BEST PLACE TO SELL FROM|SHORT
Hello, Friends!
GBP/JPY pair is in the uptrend because previous week’s candle is green, while the price is obviously rising on the 3H timeframe. And after the retest of the resistance line above I believe we will see a move down towards the target below at 191.791 because the pair overbought due to its proximity to the upper BB band and a bearish correction is likely.
Disclosure: I am part of Trade Nation's Influencer program and receive a monthly fee for using their TradingView charts in my analysis.
✅LIKE AND COMMENT MY IDEAS✅

GBPJPYMy trade idea was simple:
If GBP/JPY breaks above a key level, I will look for a retest and enter a long position.
If it breaks below, I will wait for confirmation and enter a short position.
The key is to follow the market, not predict it. Always trade what you see, not what you think will happen. Let the price action guide your entries.

Bullish bounce?GBP/JPY is falling towards the pivot and could bounce to the 1st resistance.
Pivot: 191.16
1st Support: 189.22
1st Resistance: 194.56
Risk Warning:
Trading Forex and CFDs carries a high level of risk to your capital and you should only trade with money you can afford to lose. Trading Forex and CFDs may not be suitable for all investors, so please ensure that you fully understand the risks involved and seek independent advice if necessary.
Disclaimer:
The above opinions given constitute general market commentary, and do not constitute the opinion or advice of IC Markets or any form of personal or investment advice.
Any opinions, news, research, analyses, prices, other information, or links to third-party sites contained on this website are provided on an "as-is" basis, are intended only to be informative, is not an advice nor a recommendation, nor research, or a record of our trading prices, or an offer of, or solicitation for a transaction in any financial instrument and thus should not be treated as such. The information provided does not involve any specific investment objectives, financial situation and needs of any specific person who may receive it. Please be aware, that past performance is not a reliable indicator of future performance and/or results. Past Performance or Forward-looking scenarios based upon the reasonable beliefs of the third-party provider are not a guarantee of future performance. Actual results may differ materially from those anticipated in forward-looking or past performance statements. IC Markets makes no representation or warranty and assumes no liability as to the accuracy or completeness of the information provided, nor any loss arising from any investment based on a recommendation, forecast or any information supplied by any third-party.

GBPJPY Will Move Lower! Sell!
Take a look at our analysis for GBPJPY.
Time Frame: 12h
Current Trend: Bearish
Sentiment: Overbought (based on 7-period RSI)
Forecast: Bearish
The market is testing a major horizontal structure 193.249.
Taking into consideration the structure & trend analysis, I believe that the market will reach 191.112 level soon.
P.S
Overbought describes a period of time where there has been a significant and consistent upward move in price over a period of time without much pullback.
Disclosure: I am part of Trade Nation's Influencer program and receive a monthly fee for using their TradingView charts in my analysis.
Like and subscribe and comment my ideas if you enjoy them!

gbpjpy travell monthly to monthlyOANDA:GBPJPY monthly to monthly travell
buy the entry position
dayilly support going to monthly support

GBPJPY uptrend supported at 191.40The GBP/JPY currency pair shows a bullish sentiment, reinforced by the prevailing uptrend. Recent intraday price action indicates a corrective pullback toward the previous consolidation zone and the rising trendline support area.
Bullish Scenario:
The key trading level to watch is 191.40, which represents the previous consolidation range. A successful bullish bounce from this level could target the 195.00 resistance, with potential continuation toward 195.66 and 198.30 over the longer timeframe.
Bearish Scenario:
However, a decisive break below 191.40 with a daily close below this level would invalidate the bullish outlook. This would signal a potential shift to a bearish trend, with downside targets at 189.65 and, subsequently, 187.00.
Conclusion:
The bullish sentiment remains intact as long as 191.40 holds as support. Traders should look for bullish confirmation at this level to sustain upward momentum. A break below 191.40 would indicate a deeper retracement and potential trend reversal.
This communication is for informational purposes only and should not be viewed as any form of recommendation as to a particular course of action or as investment advice. It is not intended as an offer or solicitation for the purchase or sale of any financial instrument or as an official confirmation of any transaction. Opinions, estimates and assumptions expressed herein are made as of the date of this communication and are subject to change without notice. This communication has been prepared based upon information, including market prices, data and other information, believed to be reliable; however, Trade Nation does not warrant its completeness or accuracy. All market prices and market data contained in or attached to this communication are indicative and subject to change without notice.

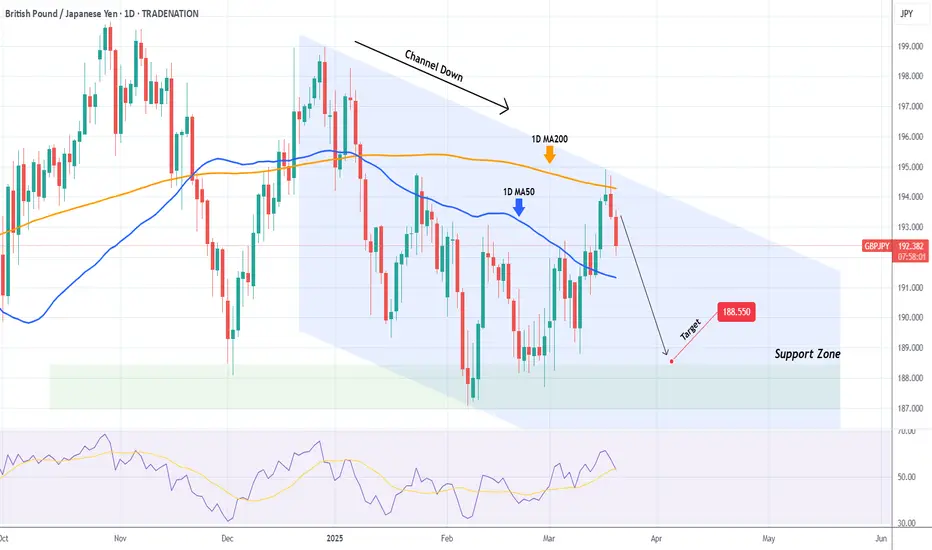
GBPJPY 1D MA200 rejection. Channel Down sell signal.The GBPJPY pair has been trading within a Channel Down pattern and the recent Bullish Leg got rejected yesterday on the 1D MA200 (orange trend-line). If the 1D RSI closes below its MA trend-line, we will have the ideal sell confirmation signal.
Our Target is the top of the 4-month Support Zone at 188.550.
-------------------------------------------------------------------------------
** Please LIKE 👍, FOLLOW ✅, SHARE 🙌 and COMMENT ✍ if you enjoy this idea! Also share your ideas and charts in the comments section below! This is best way to keep it relevant, support us, keep the content here free and allow the idea to reach as many people as possible. **
-------------------------------------------------------------------------------
Disclosure: I am part of Trade Nation's Influencer program and receive a monthly fee for using their TradingView charts in my analysis.
💸💸💸💸💸💸
👇 👇 👇 👇 👇 👇