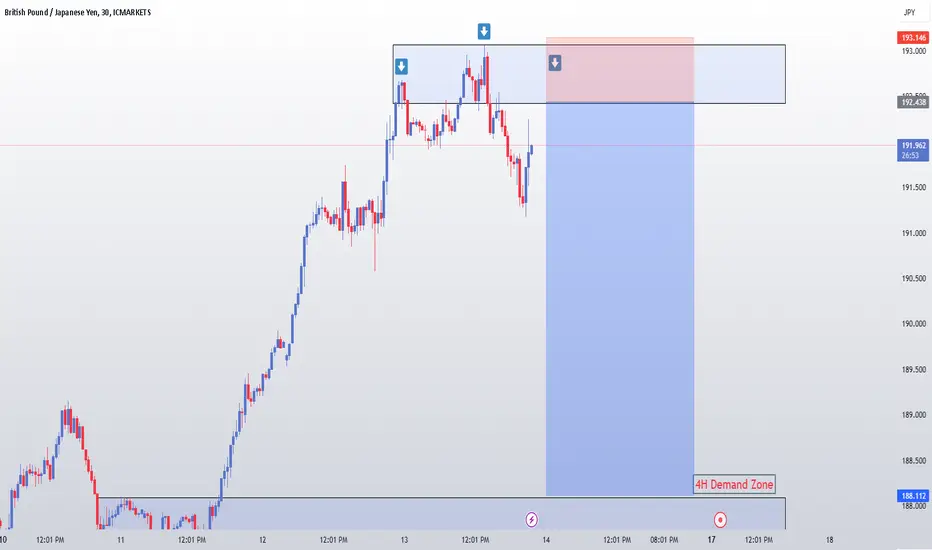
GBPJPY - Sell Idea Today - for NY Session NOTE: This idea is counter-trend, so lower probability
Looking to come back into fair value below.
Trading the retracement.
We're sitting at an area of interest where market is reacting from.
As long as we don't break the highs, then looking for a quick Sell for today. Not holding over the weekend.
GBPJPY

GBPJPY falliing resistance retest at 193.00 levelThe GBPJPY price action sentiment appears bearish, supported by the longer-term prevailing downtrend.
The key trading level is at 193.00. An oversold rally from the current levels and a bearish rejection from the 193.00 level could target the downside support at 189.60 followed by 188.30 and 187.10 levels over the longer timeframe.
Alternatively, a confirmed breakout above 193.00 resistance and a daily close above that level would negate the bearish outlook opening the way for further rallies higher and a retest of 194.12 resistance followed by 195.30 levels.
This communication is for informational purposes only and should not be viewed as any form of recommendation as to a particular course of action or as investment advice. It is not intended as an offer or solicitation for the purchase or sale of any financial instrument or as an official confirmation of any transaction. Opinions, estimates and assumptions expressed herein are made as of the date of this communication and are subject to change without notice. This communication has been prepared based upon information, including market prices, data and other information, believed to be reliable; however, Trade Nation does not warrant its completeness or accuracy. All market prices and market data contained in or attached to this communication are indicative and subject to change without notice.

gbpjpy buy signal. Don't forget about stop-loss.
Write in the comments all your questions and instruments analysis of which you want to see.
Friends, push the like button, write a comment, and share with your mates - that would be the best THANK YOU.
P.S. I personally will open entry if the price will show it according to my strategy.
Always make your analysis before a trade

GBPJPY an overviewSharing a recent trade on GBPJPY that highlights the effectiveness of support and resistance levels in trading. After analyzing the chart, I identified a strong support zone where price had previously reversed. I entered a buy position near this level, anticipating a bounce. The trade played out as expected, with price moving upward and hitting my target near a resistance zone. I closed the trade with a profit close to 96%.
This example underscores the importance of:
1. **Identifying Key Levels**: Support and resistance zones are crucial for planning entries and exits.
2. **Patience and Timing**: Waiting for price to confirm at these levels increases the probability of success.
3. **Risk Management**: Always define your stop-loss and take-profit levels before entering a trade.
Sharing this for educational purposes to help traders understand how price action and level-based strategies can be applied effectively. Let me know your thoughts! #TradingView #GBPJPY #SupportResistance #PriceAction #ForexTrading

GBP_JPY MOVE DOWN AHEAD|SHORT|
✅GBP_JPY has retested a key resistance level of 193.137
And as the pair is already making a bearish pullback
A move down to retest the demand level below at 191.000 is likely
SHORT🔥
✅Like and subscribe to never miss a new idea!✅

GBPJPY Resistance Cluster!
HI,Traders !
GBP-JPY made a bullish
Rebound But has now hit a resistance
Cluster of the horizontal and
Falling resistance lines
Around 192.809 area
From where we will be
Expecting a bearish move down!
Comment and subscribe to help us grow !

GBPJPY TRADE IDEA FOR MONDAY📉 GBP/JPY - Bearish Setup Analysis
🔹 Pair: GBP/JPY (1H Timeframe)
🔹 Bias: Bearish 📉
🔹 Key Levels:
Resistance: 193.027 (Major Supply Zone)
Entry Zone: 191.891 (Marked Red - Potential Sell Zone)
Support Target: 189.183 (Demand Zone)
🔍 Analysis:
The market is currently consolidating within a supply zone, showing signs of distribution. A rejection from the 191.891 level indicates potential bearish momentum. If price breaks below the local support at 191.280, we could see a drop towards the demand zone at 189.183.
✅ Trade Plan:
Sell Setup: Waiting for confirmation near 191.891
Stop Loss: Above supply zone (around 192.000)
Take Profit: 189.183 (Demand Zone)
📌 Confluence Factors:
✔ Price reacting to supply zone
✔ Break of structure expected for downside move
✔ Risk-to-reward favoring short positions
Let me know your thoughts in the comments! 🔥📊

GBPJPY The Week Ahead 17th Feb 25The GBPJPY price action sentiment appears bearish, supported by the longer-term prevailing downtrend.
The key trading level is at 193.45, 50 Day Moving Average level. An oversold rally from the current levels and a bearish rejection from the 193.45 level could target the downside support at 193.45 followed by 189.60 and 188.38 levels over the longer timeframe.
Alternatively, a confirmed breakout above 193.45 resistance and a daily close above that level would negate the bearish outlook opening the way for further rallies higher and a retest of 195.20 resistance followed by 197.30 levels.
This communication is for informational purposes only and should not be viewed as any form of recommendation as to a particular course of action or as investment advice. It is not intended as an offer or solicitation for the purchase or sale of any financial instrument or as an official confirmation of any transaction. Opinions, estimates and assumptions expressed herein are made as of the date of this communication and are subject to change without notice. This communication has been prepared based upon information, including market prices, data and other information, believed to be reliable; however, Trade Nation does not warrant its completeness or accuracy. All market prices and market data contained in or attached to this communication are indicative and subject to change without notice.

USD/CAD Retest Nearing Completion, Strong Bullish Wave Incoming USD/CAD is trading at approximately 1.4170.Our target price of 1.8000 suggests an anticipated upward movement of over 38,000 pips, indicating a highly bullish outlook. You note that the pair is completing a retesting period, potentially leading to a strong bullish wave.
Technical analysis indicates that USD/CAD has been consolidating around recent highs, with the market awaiting key economic data to determine its next direction. A significant support level to monitor is 1.3950; a break below this level could shift the bias from bullish to bearish. Conversely, maintaining support above this level may reinforce the bullish scenario.
Fundamentally, the Canadian dollar has recently strengthened, reaching a two-month high against the U.S. dollar. This appreciation was driven by a decrease in U.S. bond yields and positive Canadian labor market data, including a drop in the unemployment rate to 6.6% and the addition of 76,000 new jobs in January 2025. These factors have eased concerns about an economic slowdown in Canada.
In summary, while the USD/CAD pair is currently exhibiting consolidation, the completion of the retesting period could lead to a strong bullish wave toward your target price. Traders should closely monitor key support levels and upcoming economic data releases to make informed decisions.

GBP/JPY setting up for a swing-trade short?My core bias this year is for the Japanese yen to outperform, and for yen pairs such as GBP/JPY, EUR/JPY and AUD/JPY etc to suffer.
We are currently within a countertrend bounce against a much larger bearish move on GBP/JPY, but a doji formed just beneath a resistance cluster on Thursday to suggest the bounce is pausing, if not correcting itself.
The 1-hour chart shows that volumes were rising while prices fell from Thursday's high, and volumes were lower as they recouped some of those losses. Yet with GBP/JPY now trying to form a bearish outside candle on the 1-hour chart, perhaps a swing high has already formed.
The near-term bias is bearish while prices remain beneath 192.50, and for prices to fall to at least the 38.2% Fibonacci ratio ~190.75.
Matt Simpson, Market Analyst at City Index and Forex.com

GBPJPY Seems to Almost Switch The Trend!Hey Traders, in today's trading session we are monitoring GBPJPY for a selling opportunity around 193.200 zone, GBPJPY is trading in a downtrend and currently is in a correction phase in which it is approaching the trend at 193.200 support and resistance area.
Trade safe, Joe.

GBPJPY | 15M | SELL LIMIT ORDER Don't forget to press like if you want to receive updates of this analysis. 🚀
SIGNAL ALERT
SELL LIMIT ORDER - GBPJPY ( OANDA:GBPJPY ) | 193,450 OR 192,146
🟢TP1: 192,000
🟢TP2: 191,840
🟢TP3: 190,753
🔴SL: 193,559
RISK REWARD - 1,51
Thanks to everyone who supports my analysis with likes.🫡

GBP/JPY Breakdown: Massive Short Opportunity or Bear Trap?Overview:
GBP/JPY has been a strong focus, and for those following along, we’ve been anticipating short opportunities as the market structure continues to favor downside momentum. Recent price action has set up another potential short entry, aligning with our long-term bearish bias.
Weekly Timeframe: Major Rejection & Momentum Shift
• Double Top Formation: GBP/JPY formed a classic M pattern around 198.89, rejecting that level twice before reversing.
• Break of Key Support: The critical support level at 189.94 has been tested multiple times, acting as a floor before it finally broke last week with strong momentum.
• Volume Confirmation: The breakdown occurred with increased volume, signaling real selling pressure and further validating bearish sentiment.
Daily Timeframe: Retracement & Liquidity Grab
• Impulse Move Lower: After breaking support, GBP/JPY dropped aggressively, marking a fresh lower low.
• Pullback to Trap Buyers: The market retraced back up, but this was more than just a normal correction—it was a liquidity grab.
• Traders who went short too early had stop losses at key resistance levels, and price wicked up to stop them out before resuming downward.
• Instead of a smooth retracement, we saw sharp moves up, which is a telltale sign of liquidity collection before continuation.
H1 Timeframe: Entry & Trade Execution
• Structure Shift:
• Initially, price was making higher highs and higher lows within the pullback phase.
• However, we broke that bullish structure, confirming the reversal.
• Retest Confirmation:
• Price tested the breakdown level, creating a strong entry opportunity for shorts.
• Entry Execution:
• First Entry: Placed a small short position as price retested.
• Second Entry: Increased position size once the breakdown was confirmed with a bearish close.
Key Invalidations & Targets
✅ Bearish Scenario (Primary Outlook):
• As long as price stays below 192.32, shorts remain valid.
• If momentum continues downward, targets include:
• First target: 189.94 (previous key support, now resistance).
• Next levels: 187.50, then possibly 185.00 if momentum follows through.
❌ Invalidation (Bullish Breakout Scenario):
• If GBP/JPY pushes above 192.32, holds, and breaks 192.98, the bearish thesis is invalid.
• In that case, we may see a continuation higher, forcing a cut on shorts and a reevaluation of market conditions.
• Stop Loss: Set above 192.98 at 193.06 to protect against a breakout reversal.
Conclusion:
GBP/JPY remains in a high-probability short zone, with technical confirmations aligning on multiple timeframes. If price remains under key levels, we expect further downside, with liquidity already being grabbed from early sellers. However, as always, if price invalidates the setup by reclaiming resistance levels, risk management is key.
📉 Short bias remains intact unless 192.32 is broken and held.
🔹 If you found this breakdown useful, make sure to like, share, and let us know your thoughts. If you see an alternative setup, drop your analysis—always open to different perspectives! 🚀

GBPJPY Price ActionHello Traders,
If you entered during the aggressive selling phase, I hope you managed to capture at least 100 pips! Now, as you can see, the price action has formed a Head & Shoulders pattern. However, I don’t trade patterns blindly—this setup is backed by a fresh 4-hour Supply and Demand zone, which adds more weight to the trade idea.
If the price respects this zone, we can expect a drop. But remember, always take small risks and manage your position size wisely. Don’t get greedy—stick to your plan and let the market do its thing. The beauty of trading is that the market repeats itself over and over again.
Stay disciplined, trade smart, and happy trading!
GBP/JPY BEARS WILL DOMINATE THE MARKET|SHORT
Hello, Friends!
GBP/JPY pair is in the downtrend because previous week’s candle is red, while the price is clearly rising on the 8H timeframe. And after the retest of the resistance line above I believe we will see a move down towards the target below at 189.599 because the pair is overbought due to its proximity to the upper BB band and a bearish correction is likely.
✅LIKE AND COMMENT MY IDEAS✅

GBPJPY Price ActionWe’ve already hit our take-profit (TP) target, and the price has now reached the highest volume zone, which is where it previously dropped from. Currently, the price is attempting to form a higher high, but the upward momentum is slowing down. If you look at the volume, there’s a noticeable divergence—price is making progress, but the volume at the bottom isn’t significant, indicating weakness in the move.
For your take-profit levels, you can aim for TP1 which around 250+ pips during the initial impulse move and TP2 which is 450+ pips if the price continues to push higher. Keep an eye on the volume and momentum for confirmation.
Hint - FOR SL Don't use more than 30-40 Pips or MAX 50 Pips Depends Your Lot Size and Risk Management.


Bearish reversal off overlap resistance?GBP/JPY is rising towards the pivot which has been identified as an overlap resistance that aligns with the 127.2% Fibonacci extension and could reverse to the 1st support.
Pivot: 194.65
1st Support: 190.64
1st Resistance: 197.23
Risk Warning:
Trading Forex and CFDs carries a high level of risk to your capital and you should only trade with money you can afford to lose. Trading Forex and CFDs may not be suitable for all investors, so please ensure that you fully understand the risks involved and seek independent advice if necessary.
Disclaimer:
The above opinions given constitute general market commentary, and do not constitute the opinion or advice of IC Markets or any form of personal or investment advice.
Any opinions, news, research, analyses, prices, other information, or links to third-party sites contained on this website are provided on an "as-is" basis, are intended only to be informative, is not an advice nor a recommendation, nor research, or a record of our trading prices, or an offer of, or solicitation for a transaction in any financial instrument and thus should not be treated as such. The information provided does not involve any specific investment objectives, financial situation and needs of any specific person who may receive it. Please be aware, that past performance is not a reliable indicator of future performance and/or results. Past Performance or Forward-looking scenarios based upon the reasonable beliefs of the third-party provider are not a guarantee of future performance. Actual results may differ materially from those anticipated in forward-looking or past performance statements. IC Markets makes no representation or warranty and assumes no liability as to the accuracy or completeness of the information provided, nor any loss arising from any investment based on a recommendation, forecast or any information supplied by any third-party.

GBPJPY - Potential short idea !!Hello traders!
‼️ This is my perspective on GBPJPY.
Technical analysis: Here we are in a bearish market structure from 4H timeframe perspective, so I look for a short. Price filled the imbalance and rejected from trendline, as well formed hidden divergence for sell. On H1 we have regular divergence and if price breaks the structure, I will open a short.
Like, comment and subscribe to be in touch with my content!

GBPJPY Buying Opportunity - Clear support zone in sightOANDA:GBPJPY is approaching a robust support zone, marked by bullish reversals and stronger buyer interest. The recent bearish pressure has brought the price into this critical area again, creating a potential buying opportunity.
If we get bullish confirmation, I anticipate a move toward 191,350. However, a breach of this support could invalidate the bullish outlook and lead to further drop.
Carefully assess price action at this level and ensure proper risk management before taking positions. What’s your opinion on this setup? Share your ideas or feedback in the comments below!
THIS IS NOT FIANANCIAL ADVICE.

GBPJPY Will Move Lower! Short!
Take a look at our analysis for GBPJPY.
Time Frame: 1h
Current Trend: Bearish
Sentiment: Overbought (based on 7-period RSI)
Forecast: Bearish
The market is trading around a solid horizontal structure 191.143.
The above observations make me that the market will inevitably achieve 190.342 level.
P.S
We determine oversold/overbought condition with RSI indicator.
When it drops below 30 - the market is considered to be oversold.
When it bounces above 70 - the market is considered to be overbought.
Like and subscribe and comment my ideas if you enjoy them!

GBP/JPY (1H) Analysis & Trading OpportunityMarket Structure:
Break of Structure (BOS): Indicates prior bearish momentum.
Change of Character (ChoCH): Signals a potential trend reversal to bullish.
Demand Zone (Highlighted in Blue at ~187.500): Price reacted strongly, causing an impulsive move up.
Supply Zone (Highlighted in Red at ~191.500): A previous resistance level where price might slow down or reverse.
Current Price Action:
Strong bullish momentum from the demand zone (~187.500).
Price is approaching the supply zone (~191.500), which could act as resistance.
If price rejects the supply zone, a short opportunity may arise.
If price breaks above the supply zone with strong momentum, a pullback and retest could offer a buy entry.
Trade Setup Idea:
📌 Sell Setup (If Rejection at 191.500)
Entry: Near 191.500 resistance
Stop-Loss: Above 192.000
Take-Profit: 189.500 (previous minor support)
📌 Buy Setup (If Break & Retest Above 191.500)
Entry: After a pullback and confirmation above 191.500
Stop-Loss: Below 190.800
Take-Profit: 193.500

GBPJPY Falling Wedge giving a bottom buy signalGBPJPY is on a rebound that is approaching the 4hour MA50.
Based on the 1 month Falling Wedge pattern, a rejection is expected, same as January 14th to the 1.1 Fibonacci extension.
This should technically be the bottom buy opportunity to target the 0.5 Fibonacci extension at 190.100.
Follow us, like the idea and leave a comment below!!
