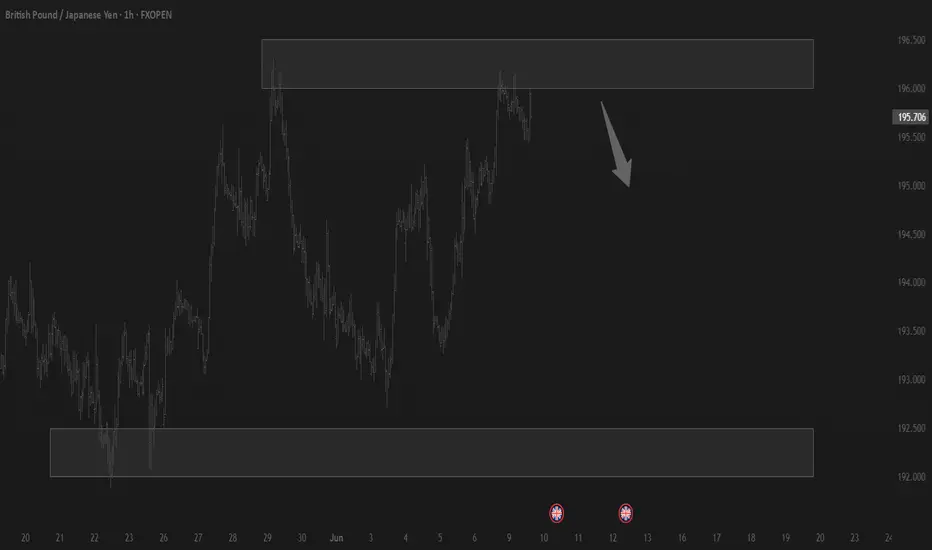
GBP/JPY - Triangle Breakout (12.06.2025)The GBP/JPY Pair on the M30 timeframe presents a Potential Selling Opportunity due to a recent Formation of a Triangle Breakout Pattern. This suggests a shift in momentum towards the downside in the coming hours.
Possible Short Trade:
Entry: Consider Entering A Short Position around Trendline Of The Pattern.
Target Levels:
1st Support – 194.34
2nd Support – 193.76
🎁 Please hit the like button and
🎁 Leave a comment to support for My Post !
Your likes and comments are incredibly motivating and will encourage me to share more analysis with you.
Best Regards, KABHI_TA_TRADING
Thank you.
Disclosure: I am part of Trade Nation's Influencer program and receive a monthly fee for using their TradingView charts in my analysis.
GBPJPY

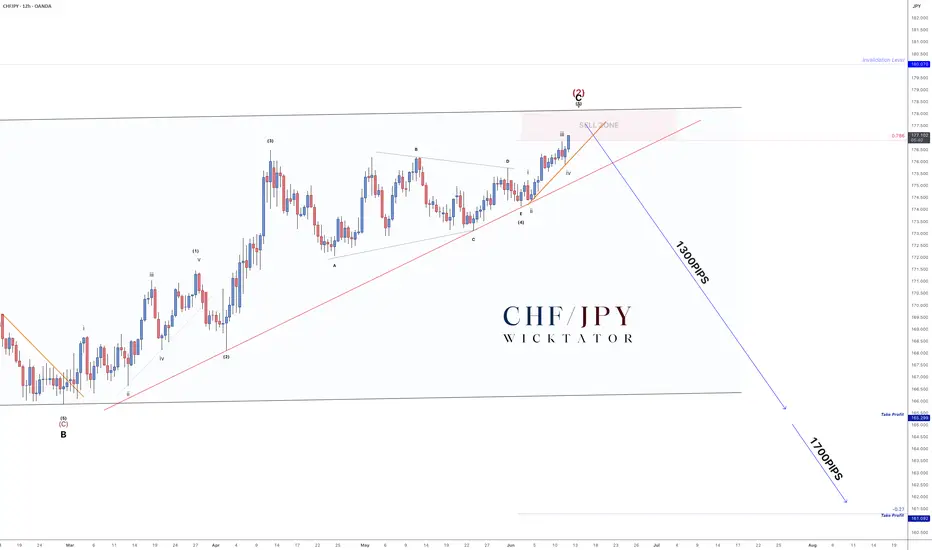
CHFJPY - How To Enter This MASSIVE 1700pip Swing Trade!As promised - here’s the lower timeframe breakdown after hitting 100+ likes.
We’re in wave 5, currently moving cleanly into the swing zone. Since wave 5 typically forms 5 subwaves, all we needed was to connect points 2 and 4 to draw our entry trendline.
Trade Idea:
- Entry on break of the orange trendline
- Stops above recent highs after entry
- Aggressive option: Enter inside the sell zone with stops above invalidation
Targets:
- TP1: 165.00 (≈1300 pips)
- TP2: 161.50 (≈1700 pips)
- Optional: Leave a runner for the longer swing move
Scroll down for the full 4H breakdown.
GBPJPY – Golden Pocket Breakout SetupTimeframe: 1H | 🎯 Bias: Bullish Breakout
GBPJPY is testing a key Fibonacci retracement zone (0.5–0.618) from the recent impulse leg (194.00 → 196.195). This golden pocket sits inside strong demand and could launch the next leg higher.
🔍 Technical Confluence
Fib Support Zone: 195.270–195.447 (0.618–0.5)
Price Action: Consolidating near golden pocket, showing rejection wicks
Structure: Higher highs and higher lows intact
RSI: Resetting around 45–50, leaving room for momentum buildup
Next Resistance: 196.200 (previous high), then 197.300 and 198.500
🧠 Fundamental Confluence
GBP Strength Drivers:
BoE's "hawkish cut" tone — restrictive policy to fight sticky inflation
UK macro improving: upcoming GDP & labor data could surprise to the upside
Market pricing less aggressive easing compared to peers = GBP premium
JPY Weakness Factors:
COT RSI at 100% = overbought positioning
BoJ delays normalization to 2027
Risk-on flows (VIX ~16.7) reducing safe-haven demand
Macro Flows: Bullish NASDAQ + stable oil → support GBPJPY upside
Macro Themes:
Oil & NAS100 bullish = supports GBPJPY upside
Market unwinding defensive positions = bullish for GBPJPY
🛠 Trade Plan
📥 Entry Option 1: Buy on bullish reaction from 195.27–195.45 (Fib golden pocket)
📥 Entry Option 2: Break and close above 196.200 (confirmation entry)
🛑 Stop Loss: Below 195.00 (under Fib + recent structure)
🎯 TP1: 196.80
🎯 TP2: 198.00 (measured move)
📌 “Golden pockets don’t lie when fundamentals align.”

GBPJPY Intraday Bearish sideways consolidationThe GBP/JPY currency pair continues to display a bearish outlook, in line with the prevailing downward trend. Recent price action suggests a corrective pullback, potentially setting up for another move lower if resistance holds.
Key Level: 196.50
This zone, previously a consolidation area, now acts as a significant resistance level.
Bearish Scenario (rejection at 196.50):
A failed test and rejection at 196.50 would likely resume the bearish momentum.
Downside targets include:
194.20 – Initial support
193.00 – Intermediate support
191.90 – Longer-term support level
Bullish Scenario (breakout above 196.50):
A confirmed breakout and daily close above 196.50 would invalidate the bearish setup.
In that case, potential upside resistance levels are:
197.50 – First resistance
198.30 – Further upside target
Conclusion
GBP/JPY remains under bearish pressure, with the 196.50 level acting as a key inflection point. As long as price remains below this level, the bias favors further downside toward the 194.20–191.90 region. However, a sustained break above 196.50 would shift sentiment bullish, targeting 197.50 and beyond. Traders should watch for price confirmation around 196.50 to assess the next move.
This communication is for informational purposes only and should not be viewed as any form of recommendation as to a particular course of action or as investment advice. It is not intended as an offer or solicitation for the purchase or sale of any financial instrument or as an official confirmation of any transaction. Opinions, estimates and assumptions expressed herein are made as of the date of this communication and are subject to change without notice. This communication has been prepared based upon information, including market prices, data and other information, believed to be reliable; however, Trade Nation does not warrant its completeness or accuracy. All market prices and market data contained in or attached to this communication are indicative and subject to change without notice.

GBP/JPY) Bearish analysis Read The captionSMC trading point update
Technical analysis of GBP/JPY (British Pound / Japanese Yen) based on multiple Technical signals on the 4-hour timeframe. Let's break it down in detail:
---
Overall Analysis Summary
Direction Bias: Bearish
Timeframe: 4H
Price (at analysis time): 195.033
Tool Used: EMA 200, RSI, Support/Resistance, Chart Pattern
---
Technical Components
1. Strong Resistance Zone (~195.800 - 196.200)
Marked by 3 red arrows.
Price has rejected this level multiple times, forming a Triple Top pattern.
Suggests strong selling pressure and low probability of price breaking higher in the short term.
2. Trendline Break (Structure Shift)
Ascending support trendline (marked with "$$$") is broken.
This is a key market structure break, indicating the bullish momentum is weakening or reversing.
3. EMA 200 (193.661)
Price is currently just above the 200 EMA.
A clean break and close below the EMA would confirm trend reversal.
EMA often acts as dynamic support/resistance.
---
Target Zones
Two downside targets are indicated:
Target 1: 192.600
Minor support level, could be the first stop for bearish pressure.
Target 2: 190.733
Strong historical support zone (yellow box labeled big support level).
Also aligns with measured move from the top of the range to the base (height of the range).
---
RSI (Relative Strength Index)
RSI (14): ~43.40
Neutral zone (not oversold yet), meaning there’s room for more downside before oversold conditions are hit.
---
Trading Psychology & Risk Management
This setup assumes:
Sellers continue to defend the resistance zone.
Break of structure (trendline + EMA) confirms shift.
Traders may consider short entries below 194.800–195.000 with stops above 196.200.
---
Trade Idea (Based on This Chart)
Entry: Below 194.800 (after break confirmation)
Stop-Loss: Above 196.200
Take-Profit 1: 192.600
Take-Profit 2: 190.733
Risk-Reward: Favorable (~1:2+)
Mr SMC Trading point
---
Caution
If price reclaims 196.200 and closes above the resistance, bearish setup is invalidated.
Watch for fakeouts near EMA.
plesse support boost 🚀 this analysis)

GBPJPY Will Go Higher! Buy!
Here is our detailed technical review for GBPJPY.
Time Frame: 1D
Current Trend: Bullish
Sentiment: Oversold (based on 7-period RSI)
Forecast: Bullish
The market is approaching a significant support area 194.845.
The underlined horizontal cluster clearly indicates a highly probable bullish movement with target 199.003 level.
P.S
Overbought describes a period of time where there has been a significant and consistent upward move in price over a period of time without much pullback.
Disclosure: I am part of Trade Nation's Influencer program and receive a monthly fee for using their TradingView charts in my analysis.
Like and subscribe and comment my ideas if you enjoy them!

GBPJPY Hello traders. There is a sell opportunity on the GBPJPY pair. We just need to wait for the price to retest the marked level. Once that happens, it will present a good entry opportunity. You can consider joining the trade with the following targets:
🔍 Trade Details
✔️ Timeframe: 15-Minute
✔️ Risk-to-Reward Ratio: 1:2
✔️ Trade Direction: Sell Limit
✔️ Entry Price: 195.251
✔️ Take Profit: 194.715
✔️ Stop Loss: 195.519
🔔 Disclaimer: This is not financial advice. I’m simply sharing a trade I’ve taken based on my personal trading system, strictly for educational and illustrative purposes.
📌 Interested in a systematic, data-driven trading approach?
💡 Follow the page and turn on notifications to stay updated on future trade setups and advanced market insights.

Usdcad Sellim still believe the market can push down more it is reacting to the Daily zone and is respecting the 1hr supply line(green dots). ive extended the sl since my analysis is based on htf price action and trend

GBP/JPY Remains Trapped in a Sideways ChannelAt the moment, GBP/JPY continues to face steady buying pressure, which has held firm as the yen weakens gradually, driven by a temporary easing in trade war tensions. This has diminished the yen’s appeal as a safe-haven asset in the short term. While the bullish bias remains intact, it has not been strong enough to break out of the broad sideways channel that has defined price action in recent months.
Wide Sideways Channel
Since October 2024, the pair has remained confined within a broad horizontal range, bounded by resistance at 198.245 and key support at 188.437. So far, price movements have been insufficient to break out of this channel in the short term, making it the most relevant structure to monitor in the upcoming sessions.
Short-Term Uptrend
Within this broader range, bullish price swings have formed a steady short-term uptrend. However, recent moves have failed to produce higher highs, signaling a possible pause in upward momentum. If a neutral bias persists, this could challenge the ability of the uptrend to break free from the larger range.
Indicator Divergence
Flat price highs in GBP/JPY, combined with lower highs in RSI and MACD, have formed a bearish divergence, pointing to potential short-term exhaustion in buying pressure. This market imbalance could open the door for corrective selling in the near term if the divergence persists.
Key Levels to Watch:
196.406 – Current Resistance: Marks recent highs and could trigger short-term selling corrections if tested again.
198.245 – Major Resistance: Upper boundary of the broader sideways channel. A break above this level would invalidate the range and potentially signal a stronger bullish bias in upcoming sessions.
193.078 – Key Support: Aligns with the ascending trendline and the 50- and 200-period moving averages. A return to this level would reinforce the neutral tone and extend the current range-bound structure.
Written by Julian Pineda, CFA – Market Analyst

DeGRAM | GBPJPY reached the resistance for the third time📊 Technical Analysis
● Price stalled in the 195.5-196.0 red resistance zone and printed a bearish engulfing (labelled “bearish take-over”) after repeatedly failing at the channel roof; the pattern completes a rising-wedge false break.
● Candle has slipped back under the mid-support band 194.0-194.3 and the wedge base; sustained trade below it opens a drop toward 193.50 (prior swing shelf) then 191.80 within the broader channel.
💡 Fundamental Analysis
● After May’s weak UK GDP outlook and dovish Bailey remarks, gilts out-performed JGBs for a second week, trimming the yield premium, while risk-off flows ahead of the BoJ meeting add yen demand.
✨ Summary
Short ≤195.5; break beneath 194.0 targets 193.5 → 191.8, stretch 190.4. Short view void on a 4 h close above 196.0.
-------------------
Share your opinion in the comments and support the idea with like. Thanks for your support!

GBPJPY H1 I Bearish Reversal Based on the H1 chart analysis, we can see that the price is rising toward our sell entry at 195.46, which is a pullback resistance that aligns with the 38.2% Fib retracement.
Our take profit will be at 194.57, a pullback support level that aligns closely with the 61.8% Fib retracement.
The stop loss will be placed at 196.44, a swing-high resistance level.
High Risk Investment Warning
Trading Forex/CFDs on margin carries a high level of risk and may not be suitable for all investors. Leverage can work against you.
Stratos Markets Limited (tradu.com/uk ):
CFDs are complex instruments and come with a high risk of losing money rapidly due to leverage. 63% of retail investor accounts lose money when trading CFDs with this provider. You should consider whether you understand how CFDs work and whether you can afford to take the high risk of losing your money.
Stratos Europe Ltd (tradu.com/eu ):
CFDs are complex instruments and come with a high risk of losing money rapidly due to leverage. 63% of retail investor accounts lose money when trading CFDs with this provider. You should consider whether you understand how CFDs work and whether you can afford to take the high risk of losing your money.
Stratos Global LLC (tradu.com/en ):
Losses can exceed deposits.
Please be advised that the information presented on TradingView is provided to Tradu (‘Company’, ‘we’) by a third-party provider (‘TFA Global Pte Ltd’). Please be reminded that you are solely responsible for the trading decisions on your account. There is a very high degree of risk involved in trading. Any information and/or content is intended entirely for research, educational and informational purposes only and does not constitute investment or consultation advice or investment strategy. The information is not tailored to the investment needs of any specific person and therefore does not involve a consideration of any of the investment objectives, financial situation or needs of any viewer that may receive it. Kindly also note that past performance is not a reliable indicator of future results. Actual results may differ materially from those anticipated in forward-looking or past performance statements. We assume no liability as to the accuracy or completeness of any of the information and/or content provided herein and the Company cannot be held responsible for any omission, mistake nor for any loss or damage including without limitation to any loss of profit which may arise from reliance on any information supplied by TFA Global Pte Ltd.
The speaker(s) is neither an employee, agent nor representative of Tradu and is therefore acting independently. The opinions given are their own, constitute general market commentary, and do not constitute the opinion or advice of Tradu or any form of personal or investment advice. Tradu neither endorses nor guarantees offerings of third-party speakers, nor is Tradu responsible for the content, veracity or opinions of third-party speakers, presenters or participants.

GBPJPY Is Very Bearish! Sell!
Take a look at our analysis for GBPJPY.
Time Frame: 30m
Current Trend: Bearish
Sentiment: Overbought (based on 7-period RSI)
Forecast: Bearish
The market is on a crucial zone of supply 193.470.
The above-mentioned technicals clearly indicate the dominance of sellers on the market. I recommend shorting the instrument, aiming at 193.034 level.
P.S
Please, note that an oversold/overbought condition can last for a long time, and therefore being oversold/overbought doesn't mean a price rally will come soon, or at all.
Disclosure: I am part of Trade Nation's Influencer program and receive a monthly fee for using their TradingView charts in my analysis.
Like and subscribe and comment my ideas if you enjoy them!

GBP/JPY: Institutional Moves Signal Liquidity ShiftFenzoFx—GBP/JPY tested the 196.4 resistance for the third time since May, with no liquidity sweep above this level, indicating massive liquidity remains.
GBP/JPY approaches 194.6 support with a full-body bearish candlestick, suggesting institutional selling pressure. The COT report shows non-commercial traders reducing long positions, with a net change of -12,863 contracts.
Despite the dip, GBP/JPY remains bullish, and 194.6 could offer a discount entry. Traders should monitor M5 and M15 for long entries. A breakout above 196.4 could target 198.25.
>>> Trade GBP/JPY at FenzoFx.

XAUUSD BULLISH OR BEARISH DETAILED ANALYSISXAUUSD is currently forming a clean bullish pennant pattern on the daily timeframe, signaling a potential continuation of the dominant uptrend. After a strong impulsive rally that pushed gold prices to new highs, the market entered into a consolidation phase, tightening within the pennant structure. This type of price action typically precedes a breakout, and with current price action hovering near the upper boundary of the pennant, a bullish breakout looks imminent. If we break above this consolidation zone, the next target stands at 3500, in line with the measured move projection from the prior leg.
From a fundamental standpoint, gold remains in strong demand amid ongoing macroeconomic uncertainties and shifting central bank policies. Recent data out of the US showed signs of a cooling labor market and slowing inflation pressures, increasing the odds of the Federal Reserve leaning toward rate cuts in the second half of 2025. A dovish Fed would weaken the US dollar and lower Treasury yields—two key drivers that historically push gold prices higher. Additionally, continued central bank gold buying globally, especially from emerging markets, is providing a strong underlying bid for XAU.
The current consolidation is healthy and is allowing the market to build momentum before another leg up. Volatility is compressing, volume remains steady, and price structure is respecting key trendlines. Once we get confirmation with a breakout and close above the upper pennant boundary, it would open the door to a swift move toward the 3500 region. Traders should monitor volume and RSI closely for early signs of breakout confirmation.
In this environment of economic uncertainty, demand for safe-haven assets like gold is only increasing. With technicals and fundamentals aligned, XAUUSD is gearing up for a powerful bullish wave. As long as we hold above the key 3280–3300 support range, the bullish thesis remains fully intact. This setup offers excellent reward-to-risk potential and is one of the more compelling opportunities currently on the radar.

Trading balanceTrading balance The price of the asset has rebounded from the balance zone. With the prospect of growth into the resistance zone.
GBPJPY Hello Traders,
There is a potential Buy opportunity on the pair, and I’d like to share it with you.
The setup provides an ideal buying condition, and I’ve configured the trade with a Risk-to-Reward Ratio of 1:2.
According to my personal entry model — which includes three different rating levels (a-b-c) — this setup has received the highest rating, which increases the likelihood of a successful outcome based on historical performance.
🔍 Trade Details
✔️ Timeframe: 15-Minute
✔️ Risk-to-Reward Ratio: 1:2
✔️ Trade Direction: Buy
✔️ Entry Price: 195.654
✔️ Take Profit: 196.179
✔️ Stop Loss: 195.391
🔔 Disclaimer: This is not financial advice. I’m simply sharing a trade I’ve taken based on my personal trading system, strictly for educational and illustrative purposes.
📌 Interested in a systematic, data-driven trading approach?
💡 Follow the page and turn on notifications to stay updated on future trade setups and advanced market insights.

GBPJPY Will Move Lower! Sell!
Here is our detailed technical review for GBPJPY.
Time Frame: 15h
Current Trend: Bearish
Sentiment: Overbought (based on 7-period RSI)
Forecast: Bearish
The market is approaching a significant resistance area 195.681.
Due to the fact that we see a positive bearish reaction from the underlined area, I strongly believe that sellers will manage to push the price all the way down to 193.757 level.
P.S
Overbought describes a period of time where there has been a significant and consistent upward move in price over a period of time without much pullback.
Disclosure: I am part of Trade Nation's Influencer program and receive a monthly fee for using their TradingView charts in my analysis.
Like and subscribe and comment my ideas if you enjoy them!

GBPJPY: Bullish As Long As 195 Hold As SupportI'm looking to buy GJ after a small retracement or breakout entry...
POI 195.2-195.4 which has a 50 and 62 fib confluence.
If no retracement, I will be looking for a breakout entry above 196.2
Let's wait and let the market come to us. Set those price alerts!

GBPJPY UPDATE!!Good day traders, I am back again with an update and this time it's on GBP/JPY. On the 1st of June I posted a setup but I mentioned that I will explain it later because I will be able to make my point clearer and easy to understand.
When this setup was posted I had that daily order block in mind, only because I needed to see it revisit the order block for the last time before price could make a run for that internal liquidity resting inside an unfilled FVG(BISI). We can also use that thought as confluence when looking for short term reversals or partial exits. Just by taking a look on the chart I posted again I will put it in the description below, you can see in the sell side of the chart we have a lot of equal lows and ICT teaches us that price looks for relative lows/equal lows and old lows.
On the daily TF price is currently inside a bearish order block and what we do not wanna see is price going over the wick of that wick of a candle that was booked on the 29th of May. We are also inside the premium zone of the wick meaning we can expect to run from there to our objectives below. As always my first objective is always the internal liquidity and that is only because that internal liquidity are my LTF | Highs/Lows.
On the 4H price is inside a balanced price range again that's in my favour meaning I have to note it. ICT teaches that we always wanna trade towards the direction where all our PD arrays are lining up and in this case, it's in the sellside, I believe we are in the starting phase of ICT's sell model.
My name is Teboho Matla but you...you don't know me yet!!

GBPJPY: Weekly OverviewHello Traders,
Everything is clear in the chart. the yellow line is a HTF resistance.
********************************************************
The indicated levels are determined based on the most reaction points and the assumption of approximately equal distance between the zones.
Some of these points can also be confirmed by the mathematical intervals of Murray.
You can enter with/without confirmation. IF you want to take confirmation you can use LTF analysis, Spike move confirmation, Trend Strength confirmation and ETC.
SL could be placed below the zone or regarding the LTF swings.
TP is the next zone or the nearest moving S&R, which are median and borders of the drawn channels.
*******************************************************************
Role of different zones:
GREEN: Just long trades allowed on them.
RED: Just Short trades allowed on them.
BLUE: both long and short trades allowed on them.
WHITE: No trades allowed on them! just use them as TP points

GBPJPY - Major Resistance Zone Threatens Further UpsideThe GBP/JPY 4-hour chart reveals the pair is approaching a critical resistance zone around the 196.00-196.50 level, marked by the upper boundary of the highlighted rectangular area, which represents a significant technical ceiling that has been tested multiple times over the past month. This resistance level coincides with previous swing highs and appears to be acting as a formidable barrier to further upside progress, suggesting that traders should exercise heightened caution as selling pressure is likely to intensify in this area. The pair's recent rally from the May lows around 190.50 has been impressive, but the multiple rejections from this upper resistance zone indicate that institutional sellers may be positioned to defend these levels aggressively. Given the historical significance of this resistance area and the potential for profit-taking after the substantial advance, market participants should be prepared for increased volatility and possible reversal signals as the pair approaches or tests this key technical barrier, making risk management particularly crucial at current levels.
Disclosure: I am part of Trade Nation's Influencer program and receive a monthly fee for using their TradingView charts in my analysis.

GBPJPY: 1050+ Pips Move! Will JPY continue dropping? In our previous analysis, we anticipated a similar move for GBPJPY, but the price dropped a bit further than expected. It’s now in a position to buy long, but please use accurate risk management as JPY pairs are likely to remain more volatile than ever. There are three targets you can keep an eye on: 197, then 200. Remember, trading involves risk, so make your own decisions.
Good luck and trade safely!
Thank you for your unwavering support! 😊
If you’d like to contribute, here are a few ways you can help us:
- Like our ideas
- Comment on our ideas
- Share our ideas
Team Setupsfx_
❤️🚀

#GBPJPY: +916 Pips Swing Buy Opportunity! Comment Down Your ViewThe FX:GBPJPY price has moved nicely from 187 to 191, almost +400 pips. I expect a small correction, but then the bullish move should continue towards the 200 region. You can set a target based on your analysis or set it at 200, whichever works for you. Good luck and trade safely.
Good luck and trade safely!
Thank you for your unwavering support! 😊
If you’d like to contribute, here are a few ways you can help us:
- Like our ideas
- Comment on our ideas
- Share our ideas
Team Setupsfx_
❤️🚀
