GJ Expectation #GBPJPYLongim in the trade and i expect the TP will be @140.50 if beak the trend line
Gbpjpydaily

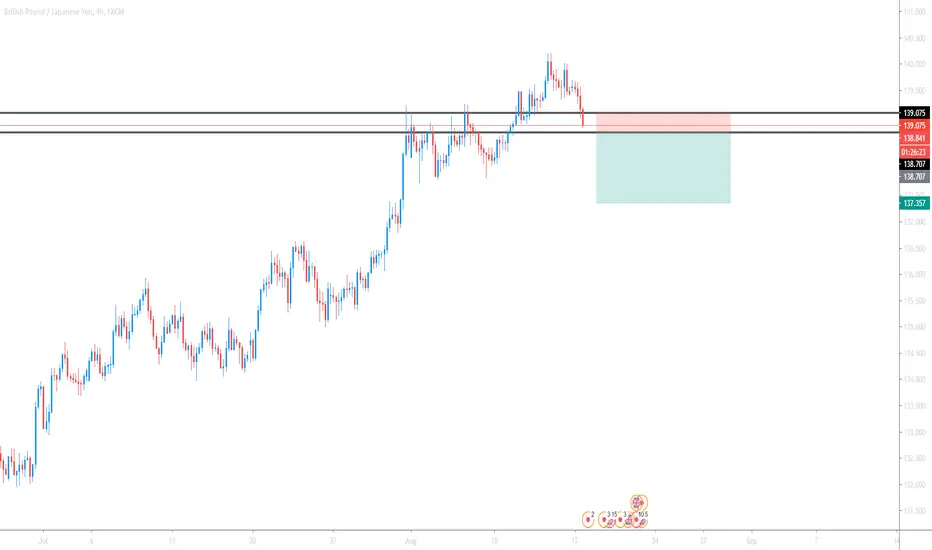
GbpJpy outlookAfter reaching 140 zone for the second time in the past 2 months, GbpJpy rolled back and is trading under 139 at the time of writing.
I expect this resistance to be strong and for the pair to drop to 136.50 in the medium term.
In my opinion, rallies should be sold and only a daily close above 140.50 would change this outlook

GBPJPY / SHORTIn this chart we can clearly see price has broken its support level and it is now retracing
I will wait for price to break the next marked area before shorting
Look for Short entry on GBPJPYWait for an rejection or wick in this area then wait for that rejection to close, then take the trade or place a SELL limit.


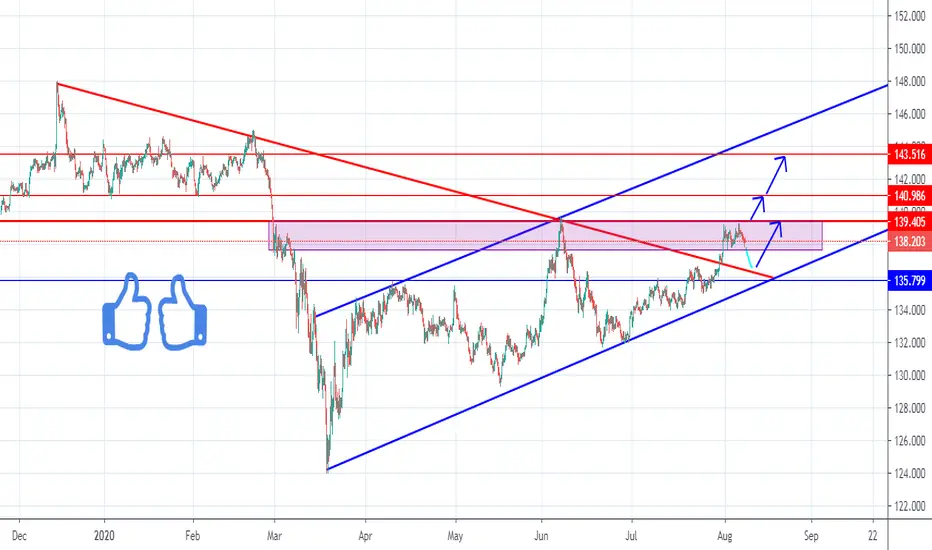
GBPJPY Last Moves for Breakout As Here in GBPJPY, it has trend from the past couples of week and now its on the resistance line waiting for breakout or fallen back to retrace one more time, so then from there it starts strengthening or fall more to getout of the trend...
Well, It depends on News what will it do. Better to focus on buying from the lower line of trend & hold it but what if it break the resistance then you're happy to take it as a buy for long term.
Becareful at this point as it can fall once more as well & then it'll breakout... Everyone want to know what GOLD is doing?
I HOPE THIS ANALYSIS GIVES YOU A BETTER IDEA.
Friends, push the like button, write a comment and share with your mates - that would be the best. THANK YOU!
P. S. I personally open a Trade when i find entry point according to my strategy, Always make your analysis before a trade.
GBPJPY Chart Analysis: Make or break area!In my previous GBPJPY idea, I told you to buy at 138.20 and target 139.20 level. That trade set-up played out perfectly and my target reached within 24 hours( idea links attached below)
Well, currently GBJPY has bounced again from the 100H EMA. If the price manages to stay above it, I expect a continuation of the uptrend till 139.20 and even 140 next week.
However, a break below the area that I have highlighted in the chart would be negative for the buyers.

GBPJPY uptrend is likely to continue but be carefulIt looks like GBPJPY's uptrend will continue. However, buyers must be careful and watch the 138 area. The price must stay above 137.80 level, which is the confluence of the 100H EMA and the support level.
If price stays above the support level, then we can expect a continuation of the uptrend to 139.20 level.
I have already bought at 137.85 and currently holding this trade.

GBPJPY LONG UPDATE!!GOOD LUCK
-----------------------
Disclaimer: Forex trading and trading in other leveraged products involves a significant level of risk and is not suitable for all investors.


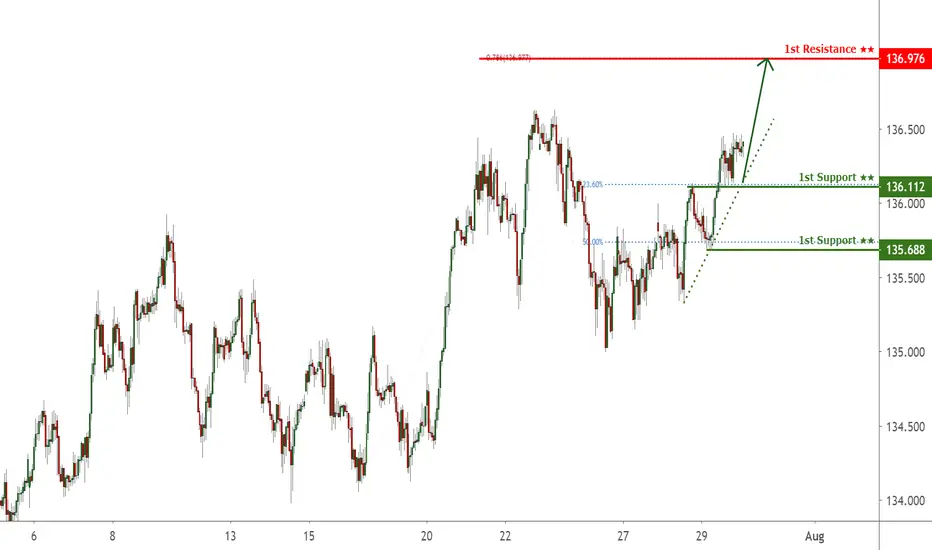
GBPJPY bounced from support, potential for a further rise!
GBPJPY bounced off 136.112 where it could potentially rise further to 136.976.
Trading CFDs on margin carries high risk.
Losses can exceed the initial investment so please ensure you fully
understand the risks.
GBPJPY potential reversal!
GBPJPY expected to rise up to 1st resistance at 137.054 where it could potentially react off and drop down to 1st support at 135.333.
Trading CFDs on margin carries high risk.
Losses can exceed the initial investment so please ensure you fully
understand the risks.

GBPJPY Buy Opperunity GBPJPY Buy Opperunity wait and watch and taking entery where CTLB then buy entery ...

GBP/JPY Wave Analysis
The counter has completed its first leg (wave A) of the bear cycle with a 5-wave formation.
Now, it is at a strong resistance zone which can trigger the wave B correction.
Hence, we expect the pair to be bearish in the near-term.

GBPJPY CHANNEL DOWN BREAKOUTGBPJPY just made it's first move on a long term bullish
trend. But on the weekly chat remember that GBPJPY is on a consolidation.
STOP LEVELS & TAKE PROFIT ARE GIVEN ON THE CHART

GBP/JPY Wave Analysis
After a strong bull run, the counter is currently in corrective (ABC) mode.
It has completed wave A and is forming its final leg of wave B.
It is now up against a resistive trendline and a break above it can take it higher.
Hence, we advise traders to initiate long positions only when an hourly candle closes above the trendline.

GBPJPY reversed from resistance, potential drop!
GBPJPY reversed off its resistance at 134.931 where it could potentially drop further to 133.905.
Trading CFDs on margin carries high risk.
Losses can exceed the initial investment so please ensure you fully
understand the risks.

GBPJPY Signals : Buy After Market OpenHere's an idea on the GBPJPY pair, the pair is currently trading in an ascending triangle within a bigger ascending channel on the D1 chart the ascending triangle could be a signal for continuation on the pair. looking for a continuation to the upside and for the ascending channel to hold and continuation with the bulls.
Signal:
Buy after market open from Current Market Price 134.96
SL: 133.00
TP: 138.68

600 PIPS!! Wait for break outPrice is currently in a rectangle pattern but showing a bullish candle on the weekly - wait for breakout and buy to the green area

GBPJPY GBPJPY parece estar en un canal alcista en días, sin embargo podría salir del canal e ir hacia abajo, seguiremos esta semana de cerca y ver que rumbo toma.


GBPJPY - REJECTION / SELLPrice should get rejected around this level and fall towards the green area

GBPJPY THIS WEEK ANALYSIS ..In this analysis we are clearly mentioned that there are two possible trends of gbpjpy in this week buy or sell.as we plotted read zone area where we do not put any entry until its break this red zone area.
