Gbpjpyidea

Buying GBP/JPYBUY LIMIT - Pending Order
Buying GBP/JPY
Entry: 134.40
Target 1: 135.10(70+ pips)
Target 2: 136.10 (170+ pips)
SL: 133.00 (140- pips)
Risk Reward 1


START OF THE WEEK GUIDE (26 Aug - 30 Aug 2019) | GBPJPYSee chart for illustration.
Follow up on earlier publication ( see link below)


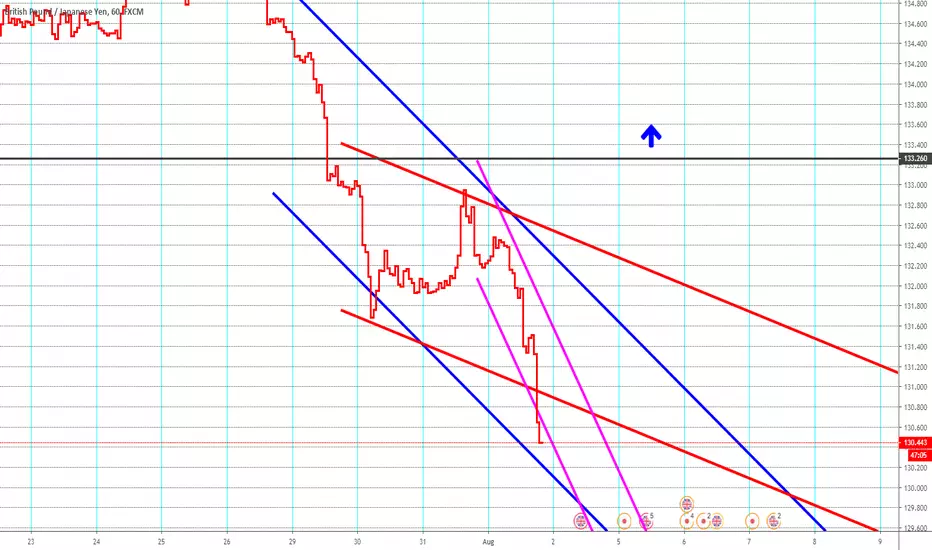
GBPJPY SHORT like my last Post 1 HR Chart#GBPJPY #USDJPY #EURJPY
Hello to all watching my charts
This pair is still sooo short ; exact like my last post from
a fey days ago ,as the short brake has startet.
I will show you here that really all ! timeframes are short
which is little bit rare.
My longtime channel (BLUE LINES , as you know...)
short since 26.7.
My middletime channel (RED LINES) also short and
the pair has made a breakout low here right today
My shorttime channelsystem (Purple lines, as you know)
is the stronges short and its still not enough !!
The pair right know fall down below these channel also.
What a short party...
For the opposite:
We do need a jump above the black line ( 133.30 ca)
to have a long chance.
But that is far far away at the moment..
Good trades
If you want to support my work and my charts, please lke them..
Renkotrade
GBPJPY continuous downwards...GBPJPY may continue downward and almost ready to buy... wait for confirmation

GBPJPY 15MIN LONG BUY #HOKCAPITALGBPJPY 15MIN LONG BUY #HOKCAPITAL
Reak first time drawing with the xABCD tool. Been playing with the science behind it lets see how it do including this new indicator with my Fibs and Support / Resistance indicators.

GBPJPY 38.2% FIB retracement could lead to a 135.00 target On our last GBPJPY analysis we awaited a retracement move to the (140.00) monthly support area which stopped short at around at around our daily resistance (138.700).
Reason for that is because priced retraced to 78.6% FIB level on our H4 chart and formed a bearish reversal pattern.
Fast forward to now we can take advantage on yet another retracement by placing our FIB tool on starting from point A (138.125) to point B (136.030) to noticing that price has
currently retraced to 38.2% level with wicks touching the 50% with a bearish spinning top from yesterday trading day.
The H4 timeframe is showing us the breach of our (136.00) H4 support zone. A break a retest of this zone will further confirm the downward momentum.
As of now price has dropped to (136.000) slightly engulfing past 4 day of price action. We are expecting a close of the daily candle around that price and the moving averages to confirm
sellers momentum. Our first target (135.450) with our second one below our weekly mid-range support at (134.700).


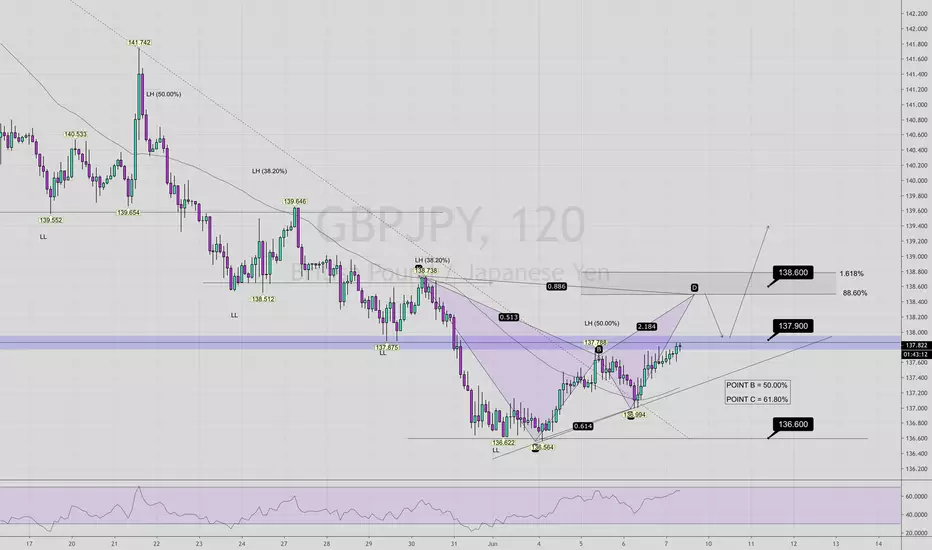
GBP JPY Break of Structure (Bat Pattern)Expecting a break of structure past the 137.900 (previous HH) level to the completion of the bat pattern at 138.600 which is within the 88.60% and 1.618% point of the D zone.
From there I will be expecting a minor retracement (50.00% or 61.80%) to TP1 which is point B of the pattern, from there I will be looking for signs of a trend continuation to enter long once again,
Regards

GOLDEN WEEK At the moment we price is currently in a strong support and resistance zone ( green box ) In the trading week ahead we will be looking at 2 possibilities.
1. Price breaks out in a bullish manor and makes a run up to our 1st TP zone 146.800 ( 270 pips ) which is previous resistance with the possibility of making further bullish movement and reaching our next TP area ( 400 pips, also previous support )
2. Price breaks out our zone and makes a bearish run down to our support level and TP of around 280 pips.
Now this is a swing trade so expect to hold it over the whole week, but we should get some rather impulsive moves as in Japan it is "Golden week" this is an extended holiday so there will be low liquidity involving all pairs during the Asian trading hours. This low liquidity can cause extreme market movements and flash crashes and seen before on 3rd January 2019 with JPY cross pairs ( get your chart up and have a look )
We are going to try and use these sudden big movements to our advantage and hopefully hit our target this week, We also have high impact GBP news on Monday morning and on Thursday we have 4 lots of high impact GBP news, so add this with the low liquidity in the markets we could see some crazy moves... Fingers crossed ;p
Obviously trade with caution and use correct risk management!

GBPJPY LONGBack tested our major support and resistance zones in the market and it looks like our down trend will end soon. Possibly near this friendly support area. If so, based on fibs theory we are looking at a pretty sweet buy leaving us with 100-120 PIPS of profit. Good luck!

GBPJPY - Ascending Structure - Sell on FX_IDC:GBPJPY
I am demo trading and documenting my progress. This is not intended to be a sell signal !
Ascending Trendline Structure on 4H
Possible Retest of 1H Resistance - Sell prediction on 4H with SL set at 2HR Inside Channel
Sell Limit - 144.800
SL - 145.500
TP - 142.500

GBPJPY - 250 PIPS+ SHORT OPPORTUNITYDo not open any trades yet, wait for second high test. No trades have been opened yet, waiting for the confirmation.
GBPJPY has broken under the 4H 50 EMA and is failing to recover back on top of it. After a drop in prices, it recovered and did a high test (Prices pushing up in a short trend but failing to break the resistance (4H 50 EMA).
We can expect a drop and break of the 200 EMA to happen eventually. Wait for another high test (Green candle with tick only on top of body) to confirm this pair is going to drop. Once the pair makes another successful high test, we can short it and put our SL above the 4H 50 EMA.
Trade safe.

GBPJPY / M15 / SHORT PLAN : GBPJPY Pay attention to 144.905
Sell GBPJPY at 144.905
SL:145.750
TP1 : 144.080
TP2 : 143.560


GBP/JPY - Trading plan next week (Long)After a few rejections of the support level 143.300 I expect GBP/JPY to move a little bit higher this week.
Entry: 143.300
TP1: 144.200
TP2: 145.700
Goodluck trading and follow me for more analysis!
