GBPJPY Bears in Sight as Japan Mulls Currency Intervention
Bearish GBPJPY as Japan's key economic ministers warn of currency intervention
Japan's key economic ministers have warned of currency market intervention, keeping investors wary of a further sell-off in the yen and weighing on the GBPJPY exchange rate.
The yen has weakened sharply against the dollar in recent months, hitting its weakest level in nearly a year on Monday. This has been driven by a number of factors, including the Bank of Japan's commitment to ultra-low interest rates, while the US Federal Reserve has been raising rates aggressively.
The recent warning from Japanese ministers has raised the prospect of further intervention to weaken the yen. This would be bad news for the GBPJPY exchange rate, as it would make Japanese exports more competitive and make British imports more expensive.
As of October 10, 2023, GBPJPY is trading at 182. If Japanese authorities do intervene to weaken the yen, this could push GBPJPY down towards 175 or even lower.
Traders should be cautious of long positions in GBPJPY in the near term, as the risk of intervention is high.
Gbpjpyshort

GBPJPY - SHORTGJ broke out of an ascending channel inside an ascending channel which is a Correction on the 4H TF

GBPJPY short/sellGBPJPY has officially broken trend and looks like for the next two targets it shall hit TP. Please risk capital accordingly.
GBPJPY
SHORT/SELL
Entry: 181.425
Stop Loss: 182.642
Targets:
TP 1: 177.325
TP 2: 172.388
Risk: 2-5% of Capital
MONSTER SWING TRADE

GBPJPY 4H (Pivot Price: 182.68)GBPJPY
If the direction stabilized under 182.68 it will touch 182.13 then 181.72 then 181.02
if the direction reversed above 182.68 and closed it will touch 182.45 ,183.88 then 184.34
Pivot Price: 182.68
resistance line : 182.45 ,183.88 ,184.34
support line: 182.13 ,181.72 ,181.02
timeframe:4H

GBP/JPY may fall if the confluence of resistance holdsHello traders, GBP/JPY is currently at a very crucial level on the
4Hour chart. Let's look at the chart and analyze it
📌In the 4Hour chart, price is currently just under the dynamic resistance.
So far, we have not seen any bearish candles. However, the next candles
could be bearish.
📌Price is also at the broken support turned resistance level as I have
indicated in my chart.
📌So, in case of bearish price action in the highlighted zone, selling
GBP/JPY@182.60-182.85 with SL above 183 and TP at 180.83 would be a potential
sell trade.

GBP/JPY on it's way to 179 level. More decline aheadHello traders, ever since GBP/JPY was at 185, I had recommended
selling with a target of 179( previous GBP/JPY ideas attached below).
📌Currently, the price action is quite bearish even in the hourly chart.
📌GBP/JPY is unable to go above the 100-hour moving average which is
a bearish signal. In fact, every time the price pulls back to the 100H EMA,
we see further drops.
📌 Based on the above factors, GBP/JPY is all set to fall to the 179 level
in the coming days. My recommendation is to sell the rallies in GBP/JPY.


GBP JPY SELLHello, according to my analysis of the gbpjpy pair, there is a high possibility of a downside. The price broke the double button pattern. With a very large red negative candle. It indicates the strength of the sellers. We also notice the rapid return to the bullish channel as shown in the analysis, but it could not get out of it. In the coming days, we expect a further drop to 182,000 levels in the first phase. And the level of 180.00 in the second stage, good luck to all

Sell GBPJPY Bearish PennantSell GBPJPY Bearish Pennant
GBP/JPY - M30 Chart - Price breaks the bearish pennant pattern now,
Its good chance to sell now.
Thank you

GBPJPY BEARISH H4 SUPPORT ZONE BROKENGJ showing very bearish signs on h4 time frame making higher lows and finally breaking the H4 support zone.

GbpJpy sellGbp jpy has broken its H1 level of interest and now heading downwards as its in a downtrend and will continue in that way also the reason to enter in the trade is we can see break of H1 support level and retest of level also completed bearish engulfing fail also made us think that the pair will go sell

GBPJPY - H4\D1GBPJPY
A triangle pattern is forming which could lead to further downward movement towards the 179,700 targets (discussed in the previous analysis).
What can you expect now?
Entry will be considered from breaking through the level of 181.400.
Targets 181,084 – 180,400 – 179,716

GBPJPY SELLFX:GBPJPY
Price on GBPJPY is consistently rejecting at Daily resistance. The Daily, 4H, and 1H time frames are bearish, hence we will have a sell bias on GBPJPY.

GBPJPY - SHORTGBPJPY SELL STOP: Symmetrical triangle: I'm anticipating the price to break the triangle/correction and continue dropping.

GBPJPY 4H (Pivot Price: 181.59)GBPJPY
If the direction stabilized under 181.59 it will touch 181.13 then 180.75 then 180.17
if the direction reversed above 181.59 and closed it will touch 182.48 ,183.13 then 183.44
Pivot Price: 181.59
resistance line : 182.48 ,183.13 ,183.44
support line: 181.13 ,180.75,180.17
timeframe:4H

GBPJPY SHORT IDEAGbpjpy is in downtrend right now and H4 just show strong rejection to the Dabel Maru Supply zone. H1 also showing Head and Shoulder pattern and I short using the confirmation candles in M30.

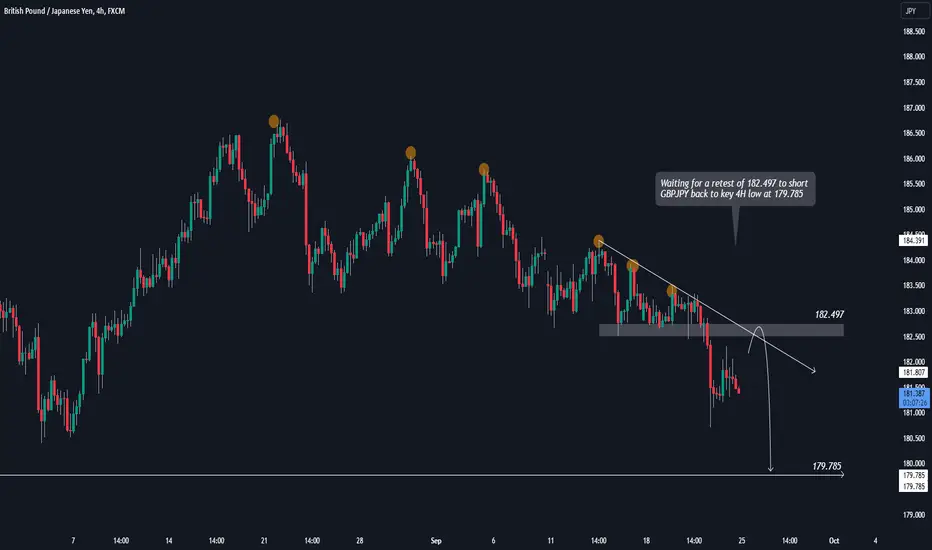
GBPJPY SHORT - BEARS GAINING MOMENTUM!Waiting for a retest of 182.497 to short GBPJPY back to key 4H low at 179.785
If you agree drop a like and if you have any questions leave a comment :)
GBPJPY week 25.09 - 29.09.2023Short term: GJ seems to be following the downtrend
But below, GJ has a Quasimodo liquidity zone forming.
It looks like this area is quite solid.
To create a clear uptrend, we need GJ to at least be able to break above the Sellzone.
Plan :
Canh buy: 179.55 and 178.8.
Canh sell: 182,995/ 183,675
If Sell picks up first, the Buy bet is still valid.
If Buy picks up and the train runs, consider reducing the order volume.
Maybe the liquidity will be enough for a pull up

GBPJPY Short Idea - Sell ZonesGuys!! here we have three potential sell zones for GPJPY. Super clean and clear chart, with no noise. Have a wonderful trading week ahead. Follow your risk and confirmations. Fill your bag with bukcs.

BluetonaFX - GBPJPY Failed Bull Flag SHORT IdeaHi Traders!
There is a potential failed bull flag opportunity on the GBJPY 1D chart. The flag looks like it has failed to continue the bullish momentum, and the price action now looks bearish.
The market has broken below our 20 EMA, and the swings are getting lower with lower highs and lower lows. The pattern is turning into a bearish ascending channel. As long as we remain under the 20 EMA, we have a bearish outlook and will look for short entries with the aim of exiting at the support area between 181.597 and 181.220.
Trade safely and responsibly.
BluetonaFX

GBP/JPY Trading plan( FOMC + BOJ Policy Rate on Friday)With FOMC coming up later tonight and BOJ monetary policy statement
on the early hours of Friday, it is going to be a blockbuster week for
GBP/JPY and other Yen pairs as well. To be honest, I would recommend
traders to take this week off. However, for those still interested in trading,
I am sharing my trading plan.
📌Right now, GBP/JPY looks like it may rise further if it is able to break the
183.50 level.
📌If price drops during or after the major news events towards 179.50, I would
try a buy trade with small lot with entry@179.50, SL: 178.80 and TP at 183.
📌If price spikes to 186 or higher during the major news events, I would prefer
selling.

GBPJPY 20/09 MovePair : GBPJPY ( British Pound / Japanese Yen )
Description :
Symmetrical Triangle in Short Time Frame as an Corrective Pattern and it has Breakout the Lower Trend Line and Completed its Retest it will Reject from Lower Trend Line of Corrective Pattern " Falling Wedge " in Long Time Frame or Fibonacci Level - 61.80%

Short-term pullback possible in GBP/JPY, buy or sell?Hello traders! GBP/JPY seems to have found some support near
the 182.65 level.
📌Price has not gone below 182.65 despite multiple attempts by
the bears to break it. So, 182.65 can be considered a minor support.
📌If the minor support level holds, we can expect GBP/JPY to pullback
towards the 4H EMA level near 184 or even 184.70.
📌However, I do not recommend traders to buy GBP/JPY as the daily
and weekly trend indicates that price can fall further towards 179.
My recommendation is to wait for a pullback and then sell if GBP/JPY
reaches the 184.70-185.20 level.
