GBPJPY Will Fall!
HI,Traders !
#GBPJPY has retested a
Horizontal resistance level
Of 198.903 so we are
Locally bearish biased
And from the resistance we
We will be expecting a
Local bearish correction !
Comment and subscribe to help us grow !
Gbpjpysignal

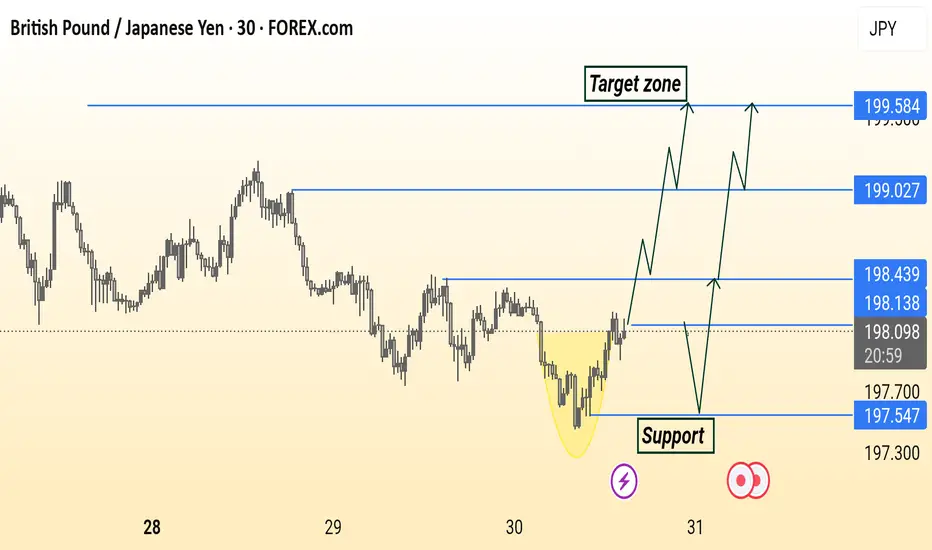
GBP/JPY Analysis is Ready Read The Captions GBP/JPY 30-minute chart shows a potential bullish reversal from a rounded bottom pattern. Price is approaching support around 198.13–197.54, with multiple possible bullish scenarios targeting resistance levels at 198.43, 199.03, and 199.58. The highlighted “Target zone” suggests a continuation if price breaks and holds above key resistance.
British Pound / Japanese Yen - 4h (OANDA)4-hour candlestick chart from OANDA shows the GBP/JPY currency pair's price movement, currently at 199.038 with a decrease of 0.542 (-0.27%). The chart highlights a recent consolidation phase around the 199-200 range, with key levels marked at 201.000, 200.268, 199.038, 198.986, and 198.435. The data reflects trading activity as of 03:08:55.

GBPJPY - 1D SetupThe Japanese yen may get stronger for a while due to the weakening of the British Economy, which may lead to a pullback of the GBPJPY currency, and this seems to be a good trading opportunity in sells with a strict stop-loss. OANDA:GBPJPY
Note- This is my own view and not a financial advice as trading comes with high risk.

British Pound / Japanese Yen (GBP/JPY) 4-Hour Chart Analysis4-hour performance of the British Pound against the Japanese Yen (GBP/JPY) via OANDA data. The current price is 199.352, reflecting a 0.129 (0.06%) increase. The chart highlights a recent upward trend, with key support levels around 198.107 and 198.994, and resistance near 200.415. A breakout above the recent high is indicated, suggesting potential for further gains.

GBPJPY: Bullish Structure Still IntactGJ created a new HH then turned sideways. More consolidation or a deeper pull back could be seen before the next rally.
Last BOS: Break above 199.70 → confirmed bullish strength
H4 Demand Zone (Pullback): 198.30–198.60
Liquidity Above: Clean pools at 200.30 – 200.70
H1 Key Zone: 198.60–198.90 (H1 OB + unfilled FVG) → currently being tested.
Momentum Trigger: BOS above 199.30 to confirm buyers stepping back in.
M15 Micro-Structure: Slightly bearish (short-term), sweeping liquidity under 198.80.
What to Watch: M15 bullish BOS above 199.10–199.30 for intraday buy confirmation.
🟢Entry Zone 198.30 – 198.60
SL 197.90
TP1 199.70
TP2 200.30
TP3 201.00
❌ Bullish Invalidation
H1 close below 197.90 → bullish bias neutralized, expect deeper retrace into 197.20 – 197.50.

GBPJPY: Still BullishPrice has pulled back and is currently reacting to H1 OB at 197.00–197.20
* FVG Support: Between 196.80–197.10
* Watch for: Bullish BOS above 197.50 to confirm buyers stepping back in
* Confirmation Needed: M15 bullish BOS above 197.50–197.60 for buy entry
🟢Entry: 196.80 – 197.10
Stop Loss: 196.4
TP1: 198
TP2: 198.6
TP3: 200
Breakout Option: If price pushes above 198.30 (M15 BOS + retest), you can enter.
❌ Bullish Bias Invalidation
H1 close below 196.40 → signals potential deeper retracement

GBP/JPY Faces Critical Supply Zone Near 199.8 Monthly High GBP/JPY hit the monthly high resistance at 199.8, a level backed by a bearish fair value gap from July 2024. The pair now trades near 199.2, just below this zone.
With supply levels extending to 201.9, a decline toward the weekly support at 195.3 is expected if selling pressure builds.

GBPJPY...LONGPrice is nearing a critical level around . No setup, no trade. For me, a solid plan always comes before any prediction.
If the zone is broken and confirmed with a retest, I’ll adjust my plan accordingly for a possible reverse trade.

GBPJPY: Bullish Impulse May Take Price To 205! 700+ Pips MoveGBPJPY is in steady bullish move in other words it is in impulse move; price has not yet exhausted and there is still extended bullish move to completed before bears takes control over. Please use accurate risk management while trading and do your own analysis.
LIKE
COMMENT
SHARE
Good luck.
Team Setupsfx_

GBP/JPY Retests Supply Zone as Yen StrengthensGBP/JPY bounced from 195.3 and is testing resistance at 197.0, where a bearish fair value gap is located.
Stochastic shows rising momentum at 28.0, but institutional data favors the Yen, with increasing long contracts.
If 197.0 holds, the pair may retest 195.3, the previous day's low. The bearish outlook remains valid below the 197.8 resistance.

GBP/JPY Trades Lower After Breaching 198.0 SupportGBP/JPY declined from recent highs, currently trading around 197.3. The break below Friday’s 198.0 low intensified the downtrend, with the pair nearing a key support at 196.9.
A temporary rebound toward 198.0 is possible before the downtrend resumes toward 196.0. The bearish outlook is invalidated if GBP/JPY breaks above 198.9.

GBPJPY Ascending Triangle Breakout!
HI,Traders !
#GBPJPY is trading in an
Uptrend and the pair is
Now breaking out of the
Ascending Triangle so we
Are bullish biased now
And we will be expecting a
Further move up !
Comment and subscribe to help us grow !

Pound-Yen Finds Support with Eyes on 198.1FenzoFx—GBP/JPY is forming bullish long-wick candlesticks near 196.8, just above key support at 196.5.
The market remains bullish above this zone, with potential to retest 198.1. A sustained move higher could extend the rally.
The bullish outlook is invalidated if GBP/JPY closes below 196.5.

#GBPJPY: UPDATED VIEW 24/10/2024 **GBPJPY UPDATED VIEW BASED ON PREVIOUS ANALYSIS**
Dear Traders,
I hope you are doing well. Based on our previous analysis of GBPJPY, we identified two potential selling opportunities within the market.
However, the bullish sentiment in the DXY currency pair has had a significant impact on JPY, causing it to fall short of its full value within the daily timeframe. As of today, we have observed a potential exhaustion of DXY’s bullish momentum, with four-hour candles indicating a strong bearish pressure. This development presents an opportunity for JPY to rebound, potentially allowing us to secure substantial profits within the market.
Now, let’s focus on the GBPJPY currency pair. The price has extended its bullish trend, although there is a possibility of a reversal from its current position. We recommend implementing appropriate stop-loss orders for any sell entries taken from the current market price. If the initial entry fails, we are confident that the price is likely to reverse from our second entry.
Before making any decisions based on this analysis, it is essential to conduct your own research. This analysis is solely for educational purposes and should not be considered financial advice.
We appreciate your feedback and support. If you find our work valuable, please consider liking and commenting on our ideas. Additionally, following us will provide us with encouragement and motivation.
Best regards,
Team SetupsFX_

#GBPJPY: 1170+ Massive Sell Opportunity! Get Ready For Big MoveDear Traders,
We have an excellent selling opportunity on GBPJPY, with over 1100+ selling move is likely to occur within next couple of weeks. Please use accurate risk management. For more chart related information read the chart carefully.

GBPJPY: A Big Swing Sell Worth 1500+ pips! Dear Traders,
We have an excellent selling opportunity on GBPJPY with move worth up to 1500 pips! Good luck and like and comment for more!

GBPJPY: Price is trading at crucial level, Possible Swing MoveDear Traders,
GBPJPY, price is currently trading at very crucial area from where we can expect price to reverse, currently the price momentum shows a strong bearish presence. This can be a swing sell after looking at the data, price can touch the previous yearly low.

#GBPJPY: Buyers and Sellers Both Has Equal Chances! Hey there! So, GBPJPY is at a pivotal moment, and we might see a mix of buying and selling activity in the market. Since the bulls aren’t exactly sure what to do next, here’s what we think:
- The GBPJPY pair is having a tough time breaking through the 194 region. The Japanese yen (JPY) is holding steady, making it hard to predict what will happen next. This has made trading JPY pairs a real challenge.
- Looking back at how prices have behaved in similar situations can give us some clues about what might happen in the future. But it’s important to do thorough research before we start trading. Just because something happened in the past doesn’t mean it will happen again.
- The Japanese yen (JPY) also tends to go down when the US dollar (USD) goes up. Since we’re bullish on the DXY index in the coming days, we think the JPY will probably take a hit, and it could go down a lot. It’s also worth keeping an eye on the GBP, which has been one of the most popular currencies since the market opened earlier today.
- In the meantime, we suggest setting two take-profit targets: one at 197 and another at 199. These levels are likely to see a lot of selling activity.
Now, let’s talk about what sellers should do:
- The price is currently in favour of sellers since it dropped from 195.50 to 193.50. And since the last two daily candles closed with strong bearish volume, it looks like the price is going to keep going down.
- If the price breaks below 190.50, that would be a great opportunity for sellers to make some money.
Good luck and trade safely!
Thank you for your unwavering support! 😊
If you’d like to contribute, here are a few ways you can help us:
- Like our ideas
- Comment on our ideas
- Share our ideas
Team Setupsfx_
❤️🚀

#GBPJPY: 600+ Pips Swing Move, JPY To Drop! GBPJPY has successfully rejected the area previously identified in our analysis of GJ. We had anticipated a price rejection and reversal with a strong bullish impulse, which has materialised. Following the positive candle close on Friday, we anticipate a continuation of the bullish trend and potential reaching of the 200 mark.
When trading, it is crucial to prioritise risk management. Conduct your own analysis and utilise this information solely for educational purposes.
Three potential targets have been identified: 198, 200, and 202. A stop loss can be positioned below our buying zone, as indicated by the black-marked zone.
Your support, expressed through likes, comments, and shares, is greatly appreciated and encourages us to continue providing valuable content.
❤️🚀
Team Setupsfx_

DeGRAM | GBPJPY reached the resistance for the third time📊 Technical Analysis
● Price stalled in the 195.5-196.0 red resistance zone and printed a bearish engulfing (labelled “bearish take-over”) after repeatedly failing at the channel roof; the pattern completes a rising-wedge false break.
● Candle has slipped back under the mid-support band 194.0-194.3 and the wedge base; sustained trade below it opens a drop toward 193.50 (prior swing shelf) then 191.80 within the broader channel.
💡 Fundamental Analysis
● After May’s weak UK GDP outlook and dovish Bailey remarks, gilts out-performed JGBs for a second week, trimming the yield premium, while risk-off flows ahead of the BoJ meeting add yen demand.
✨ Summary
Short ≤195.5; break beneath 194.0 targets 193.5 → 191.8, stretch 190.4. Short view void on a 4 h close above 196.0.
-------------------
Share your opinion in the comments and support the idea with like. Thanks for your support!

GBPJPY Hello Traders,
There is a potential Buy opportunity on the pair, and I’d like to share it with you.
The setup provides an ideal buying condition, and I’ve configured the trade with a Risk-to-Reward Ratio of 1:2.
According to my personal entry model — which includes three different rating levels (a-b-c) — this setup has received the highest rating, which increases the likelihood of a successful outcome based on historical performance.
🔍 Trade Details
✔️ Timeframe: 15-Minute
✔️ Risk-to-Reward Ratio: 1:2
✔️ Trade Direction: Buy
✔️ Entry Price: 195.654
✔️ Take Profit: 196.179
✔️ Stop Loss: 195.391
🔔 Disclaimer: This is not financial advice. I’m simply sharing a trade I’ve taken based on my personal trading system, strictly for educational and illustrative purposes.
📌 Interested in a systematic, data-driven trading approach?
💡 Follow the page and turn on notifications to stay updated on future trade setups and advanced market insights.

GBPJPY: 1050+ Pips Move! Will JPY continue dropping? In our previous analysis, we anticipated a similar move for GBPJPY, but the price dropped a bit further than expected. It’s now in a position to buy long, but please use accurate risk management as JPY pairs are likely to remain more volatile than ever. There are three targets you can keep an eye on: 197, then 200. Remember, trading involves risk, so make your own decisions.
Good luck and trade safely!
Thank you for your unwavering support! 😊
If you’d like to contribute, here are a few ways you can help us:
- Like our ideas
- Comment on our ideas
- Share our ideas
Team Setupsfx_
❤️🚀
