Gbpjpytrend


GBPJPY FORECAST UPDATE* Trade hits TP 1 about 100 pips / 1000 points *
I partially closed my positions, moved SL level to a better RR and let the rest run.

What I'd love to see on GBPJPY!Would be watching for confirmation if/when price comes to my trendline.

GBPJPY / TF : Daily / The new high for GJ around 19-22 OctoberI estimate the new High for GJ around 19-22 October based on Gann counts and the Mercury Retrograde Cycle.

What I'd love to see on GBPJPY!After creating successive higher highs and higher lows since june, price has probably made a lower high and lower low. Lets see

GJ Expectation #GBPJPYLongim in the trade and i expect the TP will be @140.50 if beak the trend line

GBPJPY LongTime for GJ to break current mild res and break towards the upside
139.800 first target
141.500 second target
Here is a Daily view of the chart

GBPJPY GBPJPY parece estar en un canal alcista en días, sin embargo podría salir del canal e ir hacia abajo, seguiremos esta semana de cerca y ver que rumbo toma.

GBPJPY LONGSWITH our winning streak and 1000 pips plus a little cherry on top by buying GBPJPY for 250 pips1

GBP/JPYHI EVERY ONE
GBP/JPY reacted to its support line and will move upwards.
FOLLOW ME. STAY INFORMED UNTILL THE ANALYSIS IS DONE.

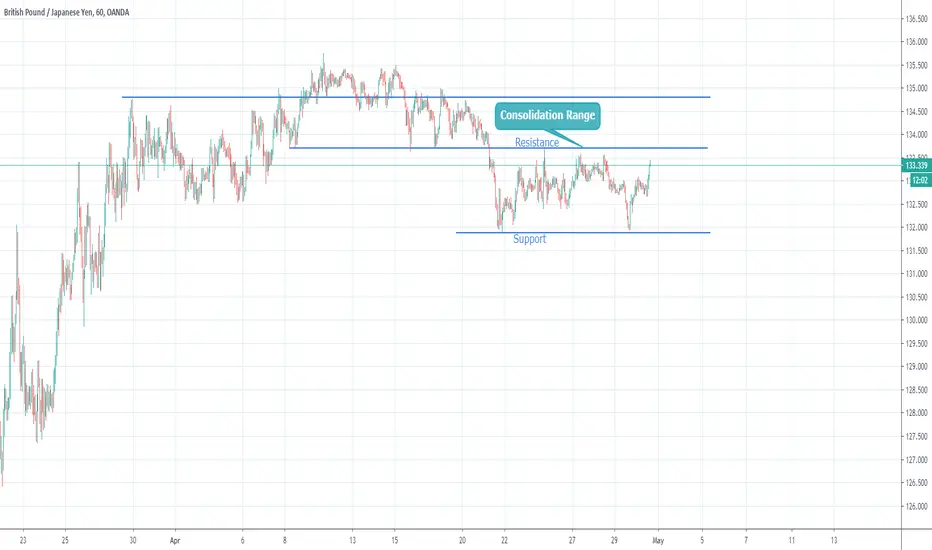
GBPJPY Consolidation range.GBPJPY is trading in range-bound movement. We might see this consolidation to continue for some more time, moreover one can take buy or sell call on GBPJPY at support or resistance level of consolidation range, respectively. Once the pair breaks out from the consolidation range, one can initiate a trade, on the break-out side, for the long term. As and when it gets updated, we will inform and post an update.
If You Like Idea Do Follow/Comment/Like For More Quick Update As Time Is Money.
Note - trade With Proper Risk Management System
Do let Us Know You View In Comment Section.
Thanks


Buying GBP/JPYBUY STOP - Pending Order
Buying GBP/JPY
Entry: 134.75
Target 1: 135.50(75+ pips)
Target 2: 136.10(135+ pips)
SL: 133.40(135- pips)
Risk Reward 1
Waiting for 4hrs handle to close above 134.6 and entering long on 15pips above the previous support.


GBPJPY bearish speculationExpecting a turn around here, we might go a bit higher and test another resistance but that is less likely. we shall let price action speak for itself in the next few candles.

Gbpjpy Sell Setup With Pin bar On Fibo 0.50% levelGbjpy sell setup with pin bar on fibo at 0.50% level
SL TP mention in chart

GBP/JPY: Bearish - Breakout Potential Technical Analysis
The April Trend Line continues to be respected indicating the bears are still in control, with a potential breakout looming in the following days. To change my Mid-Term outlook to Bullish id be looking for GBPJPY to close above 149.9 level
Fundamental Analysis
This week Brexit is front and centre for Sterling with the European Council set to meet on June 28-29. Brexit will be discussed on Friday, June 29 so look for headlines concerning the matter to be delivered throughout the day. Markets are simply looking for concrete outcomes that give a clear view on what the future will look like. Perhaps this week we will get such outcomes. Sterling in its fragile state will be very susceptible to huge sell offs dependent on the outcome of this Friday's meeting.
Yen Strength is a key factor to consider when justifying GBP/JPY shorts as the dollar has fallen to a two-week low against the yen on the back of the latest global trade war concerns. For JPY, we saw the Nikkei dropped 176.21 points on the close last Friday, with stocks extending their losses on the Tokyo Stock Exchange on Monday, battered by the yen's strengthening against the dollar amidst increacing worries over the growing trade friction between the United States and the rest of the world.

GBPJPY Completing Movement of Wave CThis pair has made wave a and wave b has ended. The thing that will happen after that is this pair will make movement towards point c.
The price at point b is 147,000. This price will remain valid if the price does not move lower than 145.00, so it can make a move to point c.
if viewed to a lower time frame that is H4, this movement has been cornered with the confirmation of a strong price movement that will push the price move higher. The recommendation we provide is to buy up to point movement point c and stop loss between 145,000 to 144,000.
