GBPNZD
GBPNZD Is Bullish! Buy!
Here is our detailed technical review for GBPNZD.
Time Frame: 2h
Current Trend: Bullish
Sentiment: Oversold (based on 7-period RSI)
Forecast: Bullish
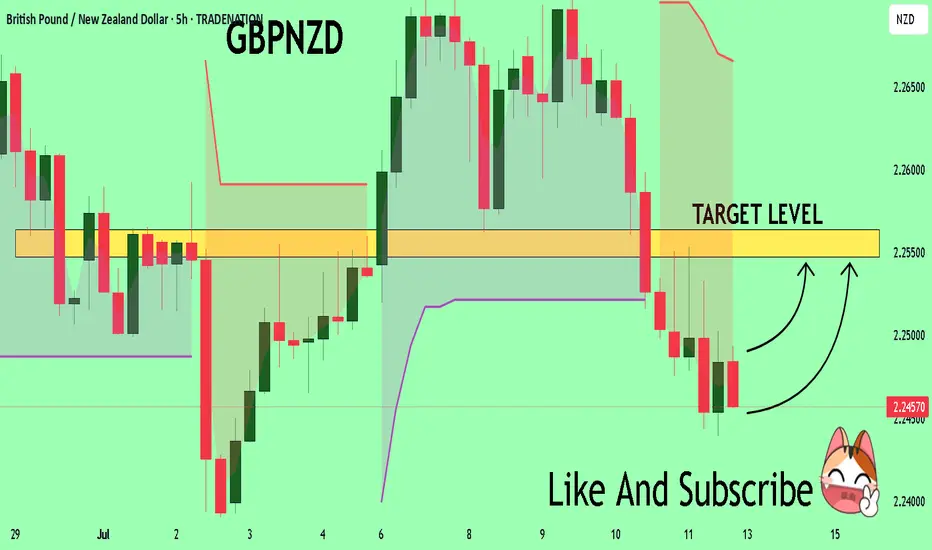
The market is approaching a significant support area 2.254.
The underlined horizontal cluster clearly indicates a highly probable bullish movement with target 2.262 level.
P.S
We determine oversold/overbought condition with RSI indicator.
When it drops below 30 - the market is considered to be oversold.
When it bounces above 70 - the market is considered to be overbought.
Disclosure: I am part of Trade Nation's Influencer program and receive a monthly fee for using their TradingView charts in my analysis.
Like and subscribe and comment my ideas if you enjoy them!

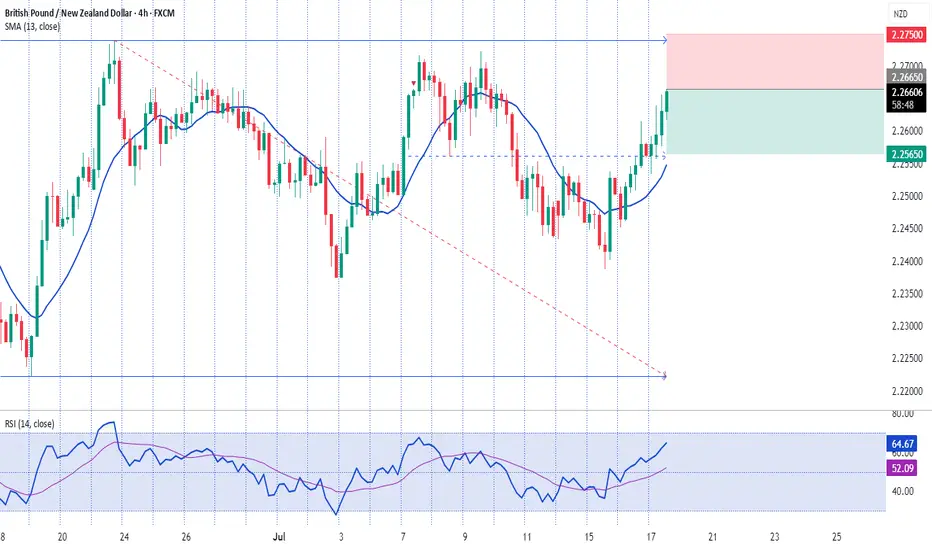
GBP/NZD Made Inverted H&S Pattern ,Time To Buy And Get 150 PipsHere is my 4H Chart On GBP/NZD , The price created a very clear reversal pattern ( inverted head and shoulders pattern ) and the price closed above neckline so the pattern confirmed and we can buy it and targeting from 100: 200 pips , if we have a daily closure above 2.25600 it will be a great confirmation telling us the price will continue to upside .

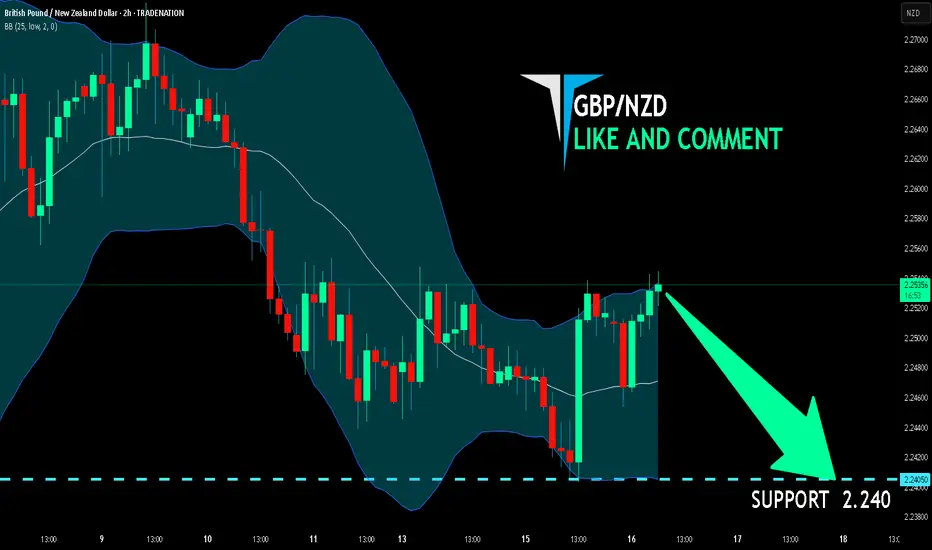
GBP/NZD BEST PLACE TO SELL FROM|SHORT
Hello, Friends!
It makes sense for us to go short on GBP/NZD right now from the resistance line above with the target of 2.240 because of the confluence of the two strong factors which are the general downtrend on the previous 1W candle and the overbought situation on the lower TF determined by it’s proximity to the upper BB band.
Disclosure: I am part of Trade Nation's Influencer program and receive a monthly fee for using their TradingView charts in my analysis.
✅LIKE AND COMMENT MY IDEAS✅
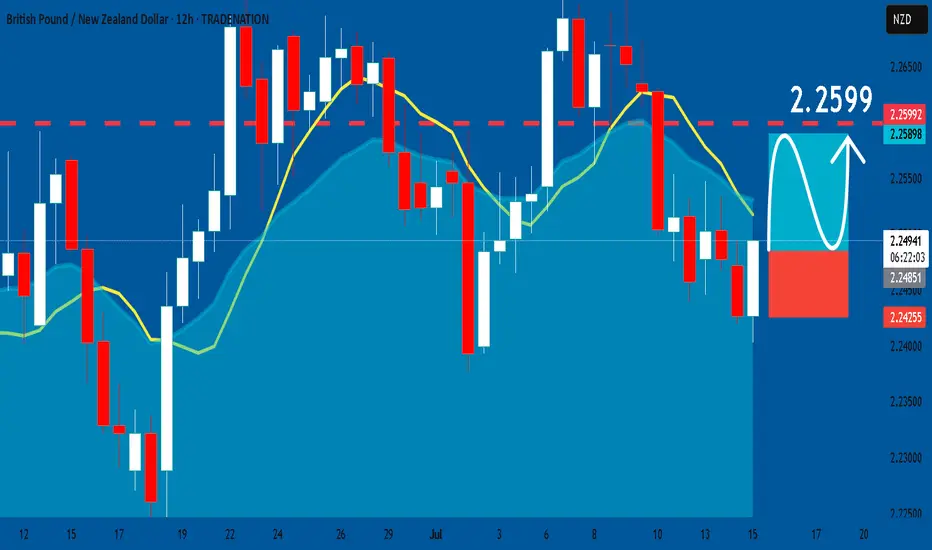
GBPNZD: Long Trade Explained
GBPNZD
- Classic bullish formation
- Our team expects pullback
SUGGESTED TRADE:
Swing Trade
Long GBPNZD
Entry - 2.2484
Sl - 2.2425
Tp - 2.2599
Our Risk - 1%
Start protection of your profits from lower levels
Disclosure: I am part of Trade Nation's Influencer program and receive a monthly fee for using their TradingView charts in my analysis.
❤️ Please, support our work with like & comment! ❤️
GBPNZD What Next? BUY!
My dear friends,
My technical analysis for GBPNZDis below:
The market is trading on 2.2457 pivot level.
Bias - Bullish
Technical Indicators: Both Super Trend & Pivot HL indicate a highly probable Bullish continuation.
Target - 2.2547
About Used Indicators:
A pivot point is a technical analysis indicator, or calculations, used to determine the overall trend of the market over different time frames.
Disclosure: I am part of Trade Nation's Influencer program and receive a monthly fee for using their TradingView charts in my analysis.
———————————
WISH YOU ALL LUCK
GBPNZD – Waiting for Price to Reach the ZoneWe’re currently waiting for price to reach our key level.
Once it does, and we see a valid buy signal, we’ll enter a long position.
🔄 All scenarios remain active.
Those who follow my analyses regularly already know the flow —
so no need to repeat the full breakdown.
As always, we don’t predict – we react to price.
We’re not here to guess what the market will do,
we’re here to manage our risk and trade what we see.

GBP/NZD: The Great Liquidity Grab? (Long Trade Plan)"🏦💰 GBP/NZD BANK VAULT RAID: Bullish Heist in Progress! (Long Setup) 💰🏦
🚨 Overbought Trap? Or Trend Continuation? Here’s How to Loot Pips Safely! 🚨
🦸♂️ GREETINGS, MARKET MARAUDERS!
To all the Profit Pirates & Risk-Takers! 🌍💸
Using our 🔥Thief Trading Tactics🔥 (a ruthless combo of price action + liquidity grabs + macro triggers), we’re executing a bullish heist on GBP/NZD ("Sterling vs Kiwi")—this is not advice, just a strategic raid blueprint for those who trade like outlaws.
📈 THE HEIST PLAN (LONG ENTRY FOCUS)
🎯 Profit Zone: 2.28700 (or escape earlier if momentum stalls)
💥 High-Stakes Play: Overbought but squeezing higher—trap for bears.
🕵️♂️ Trap Spot: Where sellers get liquidated.
🔑 ENTRY RULES:
"The Vault’s Open!" – Swipe bullish loot on pullbacks (15-30min TF).
Buy Limit Orders near swing lows for better risk/reward.
Aggressive? Enter at market—but tighter stops.
📌 SET ALERTS! Don’t miss the breakout retest.
🛑 STOP LOSS (Escape Route):
Thief SL at recent swing low (2H timeframe).
⚠️ Warning: "Ignore this SL? Enjoy donating to the market."
🎯 TARGETS:
Main Take-Profit: 2.28700 (or trail partials).
Scalpers: Ride long waves only. Trailing SL = VIP exit pass.
📡 FUNDAMENTAL BACKUP (Why This Heist Works)
Before raiding, check:
✅ COT Data (Are funds long GBP/short NZD?)
✅ Rate Spreads (GBP vs NZD yield shifts)
✅ Commodity Correlations (Dairy prices? Risk mood?)
✅ Sentiment Extreme (Retail over-shorting?)
🚨 NEWS RISK ALERT
Avoid new trades during RBNZ/BOE speeches (unless you like volatility casinos).
Trailing stops = your bulletproof vest.
💣 BOOST THIS HEIST!
👍 Smash Like to fuel our next raid!
🔁 Share to recruit more trading bandits!
🤑 See you at the target, rebels!
⚖️ DISCLAIMER: Hypothetical scenario. Trade at your own risk.
#Forex #GBPNZD #TradingView #LiquidityGrab #TrendContinuation #ThiefTrading
💬 COMMENT: "Long already—or waiting for a deeper pullback?" 👇🔥

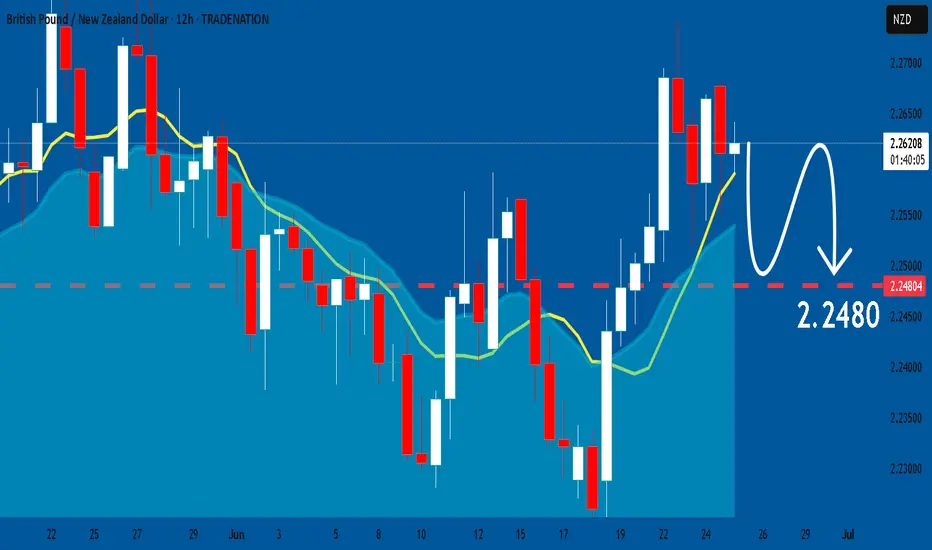
GBPNZD Is Bearish! Sell!
Please, check our technical outlook for GBPNZD.
Time Frame: 1h
Current Trend: Bearish
Sentiment: Overbought (based on 7-period RSI)
Forecast: Bearish
The market is approaching a key horizontal level 2.248.
Considering the today's price action, probabilities will be high to see a movement to 2.241.
P.S
Overbought describes a period of time where there has been a significant and consistent upward move in price over a period of time without much pullback.
Disclosure: I am part of Trade Nation's Influencer program and receive a monthly fee for using their TradingView charts in my analysis.
Like and subscribe and comment my ideas if you enjoy them!

GBP/NZD BEARISH BIAS RIGHT NOW| SHORT
Hello, Friends!
GBP-NZD uptrend evident from the last 1W green candle makes short trades more risky, but the current set-up targeting 2.251 area still presents a good opportunity for us to sell the pair because the resistance line is nearby and the BB upper band is close which indicates the overbought state of the GBP/NZD pair.
Disclosure: I am part of Trade Nation's Influencer program and receive a monthly fee for using their TradingView charts in my analysis.
✅LIKE AND COMMENT MY IDEAS✅

GBPNZD - Look for Long (SWING) 1:3GBPNZD currently shows no signs of reversal, having broken the trendline and heading toward the next supply zone on the higher timeframe. This presents a potential opportunity to go long in line with the prevailing trend, never trade against it. Let’s observe how the price action unfolds.
Disclaimer:
This is simply my personal technical analysis, and you're free to consider it as a reference or disregard it. No obligation! Emphasizing the importance of proper risk management—it can make a significant difference. Wishing you a successful and happy trading experience!

GBPNZD to find buyers at current market price?GBPNZD - 24h expiry
The medium term bias remains bullish.
We look for a temporary move lower. Preferred trade is to buy on dips.
Bespoke support is located at 2.2485.
Risk/Reward is ample to buy at market.
We look to Buy at 2.2485 (stop at 2.2430)
Our profit targets will be 2.2705 and 2.2730
Resistance: 2.2650 / 2.2740 / 2.2790
Support: 2.2500 / 2.2450 / 2.2410
Risk Disclaimer
The trade ideas beyond this page are for informational purposes only and do not constitute investment advice or a solicitation to trade. This information is provided by Signal Centre, a third-party unaffiliated with OANDA, and is intended for general circulation only. OANDA does not guarantee the accuracy of this information and assumes no responsibilities for the information provided by the third party. The information does not take into account the specific investment objectives, financial situation, or particular needs of any particular person. You should take into account your specific investment objectives, financial situation, and particular needs before making a commitment to trade, including seeking advice from an independent financial adviser regarding the suitability of the investment, under a separate engagement, as you deem fit.
You accept that you assume all risks in independently viewing the contents and selecting a chosen strategy.
Where the research is distributed in Singapore to a person who is not an Accredited Investor, Expert Investor or an Institutional Investor, Oanda Asia Pacific Pte Ltd (“OAP“) accepts legal responsibility for the contents of the report to such persons only to the extent required by law. Singapore customers should contact OAP at 6579 8289 for matters arising from, or in connection with, the information/research distributed.

GBPNZD | Potential Buy opportunityHey Traders!
We’re taking a shot on GBPNZD — it looks like a solid setup for a move to the upside. Price is currently sitting right on the 4H 50MA, and the 1H 200MA is also aligned at the exact same level, giving this zone even more weight. Our stop loss is tight, risking just a 1:1 minimum, so the downside is limited. On top of that, the Fib is drawn from top to bottom and the 0.5 level lines up perfectly with this area, which adds another layer of confidence. If this zone holds, there’s a good chance we’ll see price continue pushing up.

GBPNZD Set To Fall! SELL!
My dear subscribers,
This is my opinion on the GBPNZD next move:
The instrument tests an important psychological level 2.2694
Bias - Bearish
Technical Indicators: Supper Trend gives a precise Bearish signal, while Pivot Point HL predicts price changes and potential reversals in the market.
Target - 2.2568
My Stop Loss - 2.2759
About Used Indicators:
On the subsequent day, trading above the pivot point is thought to indicate ongoing bullish sentiment, while trading below the pivot point indicates bearish sentiment.
Disclosure: I am part of Trade Nation's Influencer program and receive a monthly fee for using their TradingView charts in my analysis.
———————————
WISH YOU ALL LUCK
GBPNZD A Fall Expected! SELL!
My dear subscribers,
This is my opinion on the GBPNZD next move:
The instrument tests an important psychological level 2.2683
Bias - Bearish
Technical Indicators: Supper Trend gives a precise Bearish signal, while Pivot Point HL predicts price changes and potential reversals in the market.
Target - 2.2655
About Used Indicators:
On the subsequent day, trading above the pivot point is thought to indicate ongoing bullish sentiment, while trading below the pivot point indicates bearish sentiment.
Disclosure: I am part of Trade Nation's Influencer program and receive a monthly fee for using their TradingView charts in my analysis.
———————————
WISH YOU ALL LUCK

GBP/NZD Vault Breach?! Ready for a Clean Bullish Heist?🔓💷 GBP/NZD — The Sterling Vault Heist Plan 🐱💻💰💹
🌟Hi! Hola! Ola! Bonjour! Hallo! Marhaba!🌟
To all the Money Makers, Market Magicians, and Chart Whisperers — it's time for another precision strike in the forex jungle! 🤑📊⚔️
🚨 Operation: GBP/NZD – Sterling vs Kiwi Bank Play 🚨
We're eyeing a bullish breakout based on solid thief-style technicals and stealthy fundamentals. The play: Long entry with high conviction — the vault is cracked open, now it's about how smooth the job gets executed! 🏦💸
🎯 Setup Breakdown:
🎯Entry Zone:
The loot is there for the taking! Ideal entries near recent 15min or 30min lows/swing points — look for a pullback entry to join the bullish breakout crew.
🟢 The market shows strength, momentum, and intention.
🛑Stop Loss (Thief Shield):
Placed tactically near the 2H swing low (around 2.23800).
⚖️ Adjust based on your lot sizing, trade volume, and risk appetite — the escape route is always planned.
💰Target Area (The Vault Door):
📌 Eyeing 2.28500 as the final vault exit — but feel free to grab your profits early if the heat rises. 🔥
Smart robbers know when to vanish.
🧠 Scalper's Note:
Ride only on the bullish side.
💼 Got big pockets? Enter now.
💡 Running light? Wait for the retest and team up with swing players for the score.
Use Trailing SL to guard your gold — protect what you steal!
📚 Market Intel:
This bullishness is no accident — backed by:
📰 Macros | 💹 COT Data | 📊 Sentiment | 🔎 Intermarket Analysis
The vault doesn’t open every day — this move is calculated.
⚠️Heads Up:
News volatility can trigger alarms 🚨
❌ Avoid fresh entries during major releases
✅ Use trailing SLs to manage live positions
Stay sharp. React fast. Think like a thief. 🧠
💥 If you vibe with the Thief Trading Style, smash that ❤️Boost Button❤️ and support the squad!
We move smart, strike clean, and profit consistently. This is Forex Heisting, redefined.
Stay tuned — the next master plan is loading... 🧨🔐💷📈


GBPNZD Will Go Up! Long!
Here is our detailed technical review for GBPNZD.
Time Frame: 9h
Current Trend: Bullish
Sentiment: Oversold (based on 7-period RSI)
Forecast: Bullish
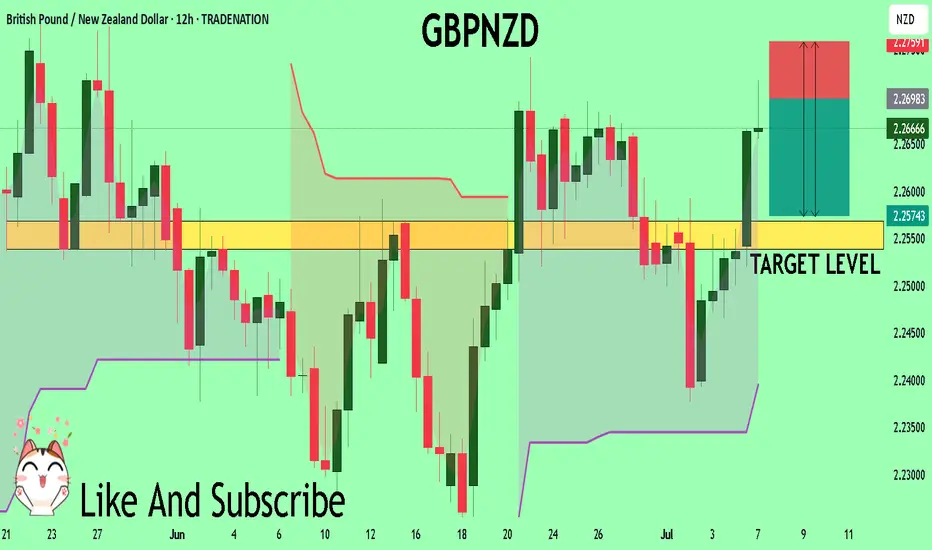
The market is trading around a solid horizontal structure 2.264.
The above observations make me that the market will inevitably achieve 2.285 level.
P.S
Overbought describes a period of time where there has been a significant and consistent upward move in price over a period of time without much pullback.
Disclosure: I am part of Trade Nation's Influencer program and receive a monthly fee for using their TradingView charts in my analysis.
Like and subscribe and comment my ideas if you enjoy them!

GBPUSD UPDATE (NICE CHART)Hello friends
Given the failure of the pain and the strong growth of the price, you can see that the price is in correction, which is a good opportunity for safe purchases at the indicated support points, of course with capital and risk management...
*Trade safely with us*

GBPNZD Local Short!
HI,Traders !
#GBPNZD made a retest of
The horizontal resistance
Of 2.27442 from where we
Are already seeing a bearish
Pullback so we will be
Expecting a further local
Move down !
Comment and subscribe to help us grow !

GBP/NZD BEST PLACE TO BUY FROM|LONG
Hello, Friends!
Bullish trend on GBP/NZD, defined by the green colour of the last week candle combined with the fact the pair is oversold based on the BB lower band proximity, makes me expect a bullish rebound from the support line below and a retest of the local target above at 2.267.
Disclosure: I am part of Trade Nation's Influencer program and receive a monthly fee for using their TradingView charts in my analysis.
✅LIKE AND COMMENT MY IDEAS✅

Descending channel and second-step trapn the descending channel that has formed, the candles indicate a downward move
OANDA:GBPNZD

GBPNZD: Forecast & Trading Plan
The price of GBPNZD will most likely collapse soon enough, due to the supply beginning to exceed demand which we can see by looking at the chart of the pair.
Disclosure: I am part of Trade Nation's Influencer program and receive a monthly fee for using their TradingView charts in my analysis.
❤️ Please, support our work with like & comment! ❤️