GBPNZD I predict price will be bullish, especially since NZD GDP will be released. I predict the result will be bad because New Zealand was in lockdown for the past month due to spreads of coronavirus.
Gbpnzdsetup

GBPNZD Price has reached the support zone, but failed to break through it. The next point price will retrace to is resistance before giving us a clear sell.

GBPNZD DAILY TIMEFRAME ANALYSIS SELLWe consider selling this GBPNZD pair because of a strong resistance above. We know what we are doing and we do what the market is doing. This is more than an institutional analysis. Invest wisely. Thank you for following me on tradingview.

GBP/NZD SELL OPPOTUNITY VIEW NOW......
AronnoFX will not accept any liability for loss or damage as a result of
reliance on the information contained within this channel including
data, quotes, charts and buy/sell signals
If you like this idea, do not forget to support with a like and follow.
Traders, if you like this idea or have your own opinion about it,
write in the comments. I will be glad.

GBP/NZD Full Analysis And 2 Setups Available In This Video !This is an educational + analytic content that will teach why and how to enter a trade
Make sure you watch the price action closely in each analysis as this is a very important part of our method
Disclaimer : this analysis can change at anytime without notice and it is only for the purpose of assisting traders to make independent investments decisions

GBP/NZD Moving In Our Range And Many Setups Available Here ! This is an educational + analytic content that will teach why and how to enter a trade
Make sure you watch the price action closely in each analysis as this is a very important part of our method
Disclaimer : this analysis can change at anytime without notice and it is only for the purpose of assisting traders to make independent investments decisions

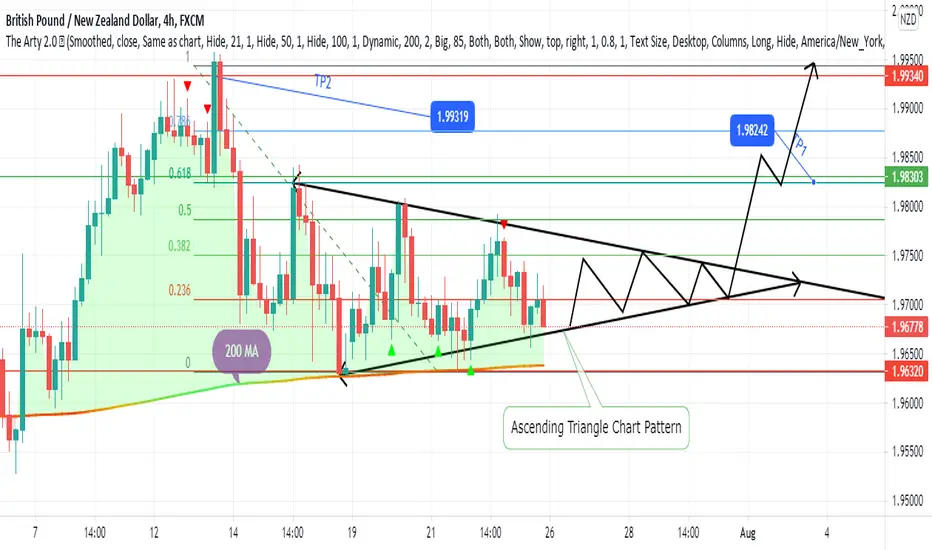
Trading Idea Regrading GBPNZD Currency PairThis Currency Pair Worth of Trading This Week Because it has Bullish Bias along with Two Confirmations
1-Ascending Triangle Chart Pattern
2-200 MA Support
3-Fibonachi Levels
GBP/NZD Running In 240 Pips From Last Post , Did You Catch It ?This is an educational + analytic content that will teach why and how to enter a trade
Make sure you watch the price action closely in each analysis as this is a very important part of our method
Disclaimer : this analysis can change at anytime without notice and it is only for the purpose of assisting traders to make independent investments decisions

GBP/NZD New Short Setup Available T Catch 400 Pips !This is an educational + analytic content that will teach why and how to enter a trade
Make sure you watch the price action closely in each analysis as this is a very important part of our method
Disclaimer : this analysis can change at anytime without notice and it is only for the purpose of assisting traders to make independent investments decisions

Trading Idea Regarding GBPNZDI try to make Every thing Simple and Self explanatory in The Chart. Thank you for Watching My Trading Idea.

GBPNZD | Perspective for the new week | Follow-up detailsWe are yet to take advantage of the Bearish tendency since my last publication on this pair as we await price action to do a complete rejection of the Bullish trendline identified on the publication (see link below for reference purposes). Like the setup identified on our GBPAUD, we have a similar pattern here too as price action transitions into a Descending Channel
Tendency: Downtrend (Bearish)
Structure: Breakdown | Supply & Demand | Channel | Reversal pattern (retracement)
Observation: i. A successful Breakdown of NZ$1.98500 on the 23rd of June 2021 after hitting a peak @ NZ$1.99600 is enough reason to expect a Bearish momentum.
ii. The Impulsive Breakdown was followed by a rejection of the same level at exactly 61.8% retracement (NZ$1.98500 area)on the 30th of June 2021 to respect Descending channel.
iii. The momentum initiated within the channel at the inception of the retracement move (25th June 2021) in the direction of the Bullish Trend declined as price successfully broke down both the Key level & Trendline on the 2nd July 2021 to give further significance to my Bearish bias.
iv. I look forward to a possible climb to retest Key level (New Supply level indicated on the chart) in the coming week before the risk of further decline.
v. A further plunge below NZ$1.96000 (Breakdown/Retest) welcomes an addition to the existing position... Trade consciously!😊.
Trading plan: SELL confirmation with a minimum potential profit of 200 pips.
Risk/Reward : 1:4
Potential Duration: 2 to 7days
NB: This speculation might be considered to make individual decisions on the lower timeframe.
Watch this space for updates as price action is been monitored.
Risk Disclaimer:
Margin trading in the foreign exchange market (including commodity trading, CFDs, stocks etc.) has a high risk and is not suitable for all investors. The content of this speculation (including all data) is organized and published by me for the sole purpose of education and assistance in making independent investment decisions. All information herein is for your reference only and I take no responsibility.
You are hereby advised to carefully consider your investment experience, financial situation, investment objective, risk tolerance level, and consult your independent financial adviser as to the suitability of your situation prior to making any investment.
I do not guarantee its accuracy and is not liable for any loss or damage which may result directly or indirectly from such content or the receipt of any instruction or notification therewith.
Past performance is not necessarily indicative of future results.

GBP/NZD New Short Setup To Catch More Than 500 Pips !This is an educational + analytic content that will teach why and how to enter a trade
Make sure you watch the price action closely in each analysis as this is a very important part of our method
Disclaimer : this analysis can change at anytime without notice and it is only for the purpose of assisting traders to make independent investments decisions

GBPNZD | Perspective for the new week | Follow-upIt's approximately 700pips move in our direction since my last publication on this pair ( see link below for reference purposes) and the price has continued to reject the NZ$1.98000 zone. This is a sign that Buyers are yet to garner the momentum to push the price above this level in the last 9 months (since September 2020) hereby giving an advantage to Sellers from this area.
Considering the memory at the NZ$1.98000 zone, Investors have been hesitant to keep buying the Pound New Zealand Dollar (GBP/NZD) exchange rate higher, as the Pound’s "bullishness" runs out of steam every time it reaches this level which is represented on the chart with Rejection I to IV.
Tendency: Downtrend (Bearish)
Structure: Supply & Demand | Trendline
Observation: i. The Trendline indicated on the chart has been a significant factor in deciding the prevailing bias of participants in the market since the beginning of the year 2021.
ii. It is important to note that as soon as the price touches NZ$1.98000 a sharp rejection happens and this has occurred three different times this year (March, May & June); This is a clue into the immense strength of Sellers at this juncture in the market.
iii. Focus shall be below Key level I @ NZ$1.9670 for selling opportunity with confirmation at the Breakdown/Retest of Trendline.
iv. Breakdown/Retest of Key level II @ NZ$1.9200 shall welcome addition to existing running position.
v. CAUTION: Please note that confirmation remains below Key level I as any significant Break above NZ$1.98000 shall welcome a rally continuation at retest... Trade consciously!:)
Trading plan: SELL confirmation with a minimum potential profit of 500 pips.
Risk/Reward : 1:6
Potential Duration: 10 to 20days
NB: This speculation might be considered to make individual decisions on the lower timeframe.
Watch this space for updates as price action is been monitored.
Risk Disclaimer:
Margin trading in the foreign exchange market (including commodity trading, CFDs, stocks etc.) has a high risk and is not suitable for all investors. The content of this speculation (including all data) is organized and published by me for the sole purpose of education and assistance in making independent investment decisions. All information herein is for your reference only and I take no responsibility.
You are hereby advised to carefully consider your investment experience, financial situation, investment objective, risk tolerance level, and consult your independent financial adviser as to the suitability of your situation prior to making any investment.
I do not guarantee its accuracy and is not liable for any loss or damage which may result directly or indirectly from such content or the receipt of any instruction or notification therewith.
Past performance is not necessarily indicative of future results.


GBP/NZD Running In 300 Pips From Last Analysis Did U Catch It ?This is an educational + analytic content that will teach why and how to enter a trade
Make sure you watch the price action closely in each analysis as this is a very important part of our method
Disclaimer : this analysis can change at anytime without notice and it is only for the purpose of assisting traders to make independent investments decisions

GBP/NZD Running In 100 Pips Profits, Did You Catch It ?This is an educational + analytic content that will teach why and how to enter a trade
Make sure you watch the price action closely in each analysis as this is a very important part of our method
Disclaimer : this analysis can change at anytime without notice and it is only for the purpose of assisting traders to make independent investments decisions

GBP/NZD 2 Short Setups To Catch More Than 500 Pips !This is an educational + analytic content that will teach why and how to enter a trade
Make sure you watch the price action closely in each analysis as this is a very important part of our method
Disclaimer : this analysis can change at anytime without notice and it is only for the purpose of assisting traders to make independent investments decisions

GBPNZD top-down analysisHi Guys, let’s make a full top-down analysis of this pair, we will take the trade if all the condition of the strategies are satisfied. Press like button to support this video and let me know in the comment section if you have any questions.

GBPNZD 4H Long Opportunity Got my self into it yesterday and got a break even close on it but the setup is still good for Buys again

GBP/NZD Running In 90 Pips Profits , Will Continue ?This is an educational + analytic content that will teach why and how to enter a trade
Make sure you watch the price action closely in each analysis as this is a very important part of our method
Disclaimer : this analysis can change at anytime without notice and it is only for the purpose of assisting traders to make independent investments decisions

GBP/NZD Running In 700 Pips Profits &Third Entry Still AvailableThis is an educational + analytic content that will teach why and how to enter a trade
Make sure you watch the price action closely in each analysis as this is a very important part of our method
Disclaimer : this analysis can change at anytime without notice and it is only for the purpose of assisting traders to make independent investments decisions

GBPNZD: I want to try Opportunity in this pairHere is my idea for this pair
GBPNZD with Risk Reward Ratio 1:6
What do you think?
If you have any idea Comment below here.
Glad to hear that.

GBP/NZD Running In 370 Pips And Third Entry Available This is an educational + analytic content that will teach why and how to enter a trade
Make sure you watch the price action closely in each analysis as this is a very important part of our method
Disclaimer : this analysis can change at anytime without notice and it is only for the purpose of assisting traders to make independent investments decisions
