GBPNZD Potential Sell OffThis pair has exhausted the bullish movement as we predicated before, It seems with the bearing engulfing on Daily with a new low, this pair is looking to drop like flies soon. We are already in a sell and just hoping our biased is correct. Trade with care and use proper risk management. Good luck.
Gbpnzdshort

Short GBPNZD at 1.9410 [25/Apr/2022]Monthly: Bearish. Market is consolidating at the moment.
Weekly: Market is ranging.
Daily: Bearish. Market is reacting at current supply zone.
M30: Market made a BOS.
Entry: 1.9410
SL: 1.9450
TP: 1.9100

GBPNZD H1GBPNZD we see strong bullish channel on h1 TF, Price broke channel resistance and after that started consolidation between 1.9190 to 1.9370 levels. Now we have two scenario...
If price touches consolidation support and goes up uptrend will continue.
If price will break down 1.3190support it will be the confirmation of new downtrend.

GBPNZD Down Trend.!#GBPNZD Looking for Sell trade setup as I mentioned in the Chart.!
Keep Supporting LIKE, COMMENT And FOLLOW.!
Thank You.!

GBP/NZDSell: GBP / NZD
SL @ 1.94150
TP @ 1.92570
Max Risk: 2%
(When calculating, do not forget about different spreads from Brokers)
Leave comments or likes to keep our content free and alive.
Have a good week to everyone
It is not an investment recommendation

GBPNZD | BEARISH SIGNS SELL
GBPNZD once again took beating from the sellers zone which is acting as strong resistance for the pair.
The bearish signs which are enough for us to call for shorts are
Double top
Bearish Divergence
Break of Watchout level
Trade your levels accordingly.

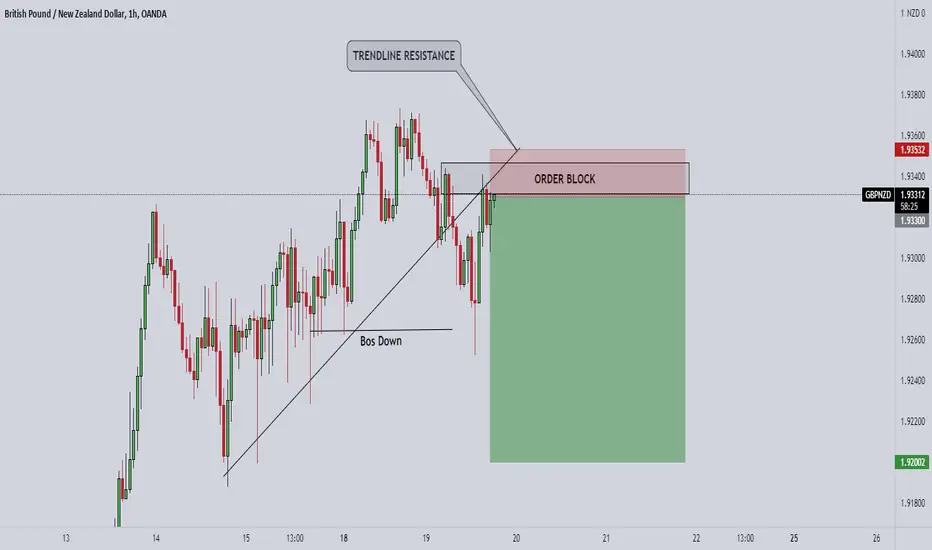
GBPNZD SHORT 1HGBPNZD is Looking To Move Downwards Because of these Three reasons:-
1) Trendline Resistance
2) ORDER BLOCK Area
3)BOS
GBPNZD FX:GBPNZD
Hi everyone
This is an analysis and not a signal.
Please use a great signal to enter the transaction.
Good luck
IRFOFC

GBP-NZD trading setup idea! 💡💬
What do you think?
💬
Everything I share is how I trade personally. 😉
Enter the trade by checking yourself. ☑️
Do not put more than 2% of your capital at risk! ❌

GBPNZD | New PerspectiveFollowing a 500pips move since my last publication on this pair (see link below for reference purposes); It appears we do have another trading opportunity here on the GBPNZD.
The appearance of a reversal set-up on the 1H time frame coupled with the obvious that the price is currently within a supply zone; we might want to consider a selling opportunity on this one as we anticipate a breakdown/retest of the key level @ 1.94 for confirmation.
Risk Disclaimer:
Margin trading in the foreign exchange market (including commodity trading, CFDs, stocks etc.) has a high risk and is not suitable for all investors. The content of this speculation (including all data) is organized and published by me for the sole purpose of education and assistance in making independent investment decisions. All information herein is for your reference only and I take no responsibility.
You are hereby advised to carefully consider your investment experience, financial situation, investment objective, risk tolerance level, and consult your independent financial adviser as to the suitability of your situation prior to making any investment.
I do not guarantee its accuracy and is not liable for any loss or damage which may result directly or indirectly from such content or the receipt of any instruction or notification therewith.
Past performance is not necessarily indicative of future results.


GBPNZD Down Trend.!#GBPNZD Looking for Sell trade setup as I mentioned in the Chart.!
Keep Supporting LIKE, COMMENT And FOLLOW.!
Thank You.!

GBP/NZDSell: GBP / NZD
SL @ 1.91675
TP @ 1.89610
Max Risk: 2%
(When calculating, do not forget about different spreads from Brokers)
Leave comments or likes to keep our content free and alive.
Have a good week to everyone
It is not an investment recommendation


GBPNZD ShortHey traders, in the coming week we are monitoring GBPNZD for a selling opportunity around 1.895 zone, once we will receive any bearish confirmation the trade will be executed.
Trade safe, Joe.

GBPNZD Down Trend.!#GBPNZD Looking for Sell trade setup as I mentioned in the Chart.!
Keep Supporting LIKE, COMMENT And FOLLOW.!
Thank You.!

Bearish Cypher GBPNZD 4HBearish Cypher spotted on the GBPNZD 4H
Set an aggressive SELL limit order at 1.92068
Stop loss set at 1.24924
Take profit 1 is at 1.91230
Take profit 2 is at 1.90278
If triggered in, I will move TP based on the extreme of the D leg completion
If TP1 is hit I Will roll stop loss to break even for TP2

GBPNZD top-down analysisHello traders, this is the full breakdown of this pair. We will take this trade if all the conditions are satisfied as discussed in the analysis. Smash the like button if you find value in this analysis and drop a comment if you have any questions or let me know which pair to cover in my next analysis.

GBPNZD ShortHey traders, in the coming week we are monitoring GBPNZD for a selling opportunity around 1.89 zone, once we will receive any bearish confirmation the trade will be executed.
Trade safe, Joe.

GBPNZD | BOTTOM OUT?GBPNZD has been in strong bearish trend from the late January of this year. It is trading at important support zone which were reactive in the past (as highlighted in the chart). We are expecting the same from the support as bullish divergence is printed on the chart as well.
Alternatively, breaking below the support will add more pressure in the pair and price can drop to further lows.
Play your levels accordingly.

Short GBPNZDBritish pound still shows weakness against Kiwi. How you can manage this setup depends on you. Bon Voyage
