-0.5% Week | A Tough Reminder: Risk Management is EverythingFirst trade hit 2R , exited early due to the bank holiday.
Next day, I gave it all back. 3 stop-losses. Poor risk management .
I got overconfident after being in profit and paid the price.
Also realized mobile tools (like SL placement on TradingView app) can hurt if not set up right.
Last week was +6% with strict risk rules.
This week? A reminder that trading is 90% mindset and discipline.
Lessons:
• Protect your capital, always.
• Don’t loosen your rules after a win.
• Your edge only works if you follow your plan.
Stay disciplined. Survive the noise. Let your edge play out.
GBPUSD

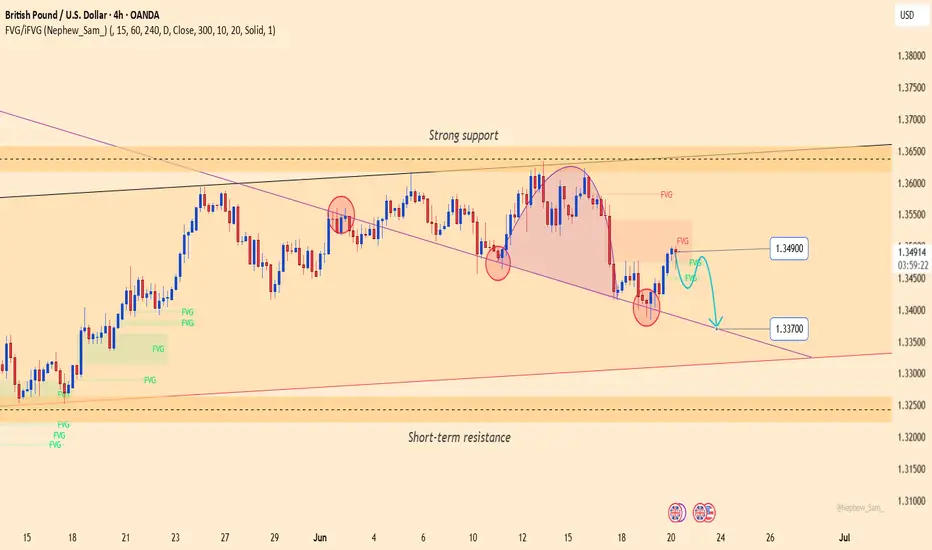
GBPUSD: Bearish pressure persistsGBPUSD is consolidating below a key medium-term resistance zone, with a rounding top and a minor head-and-shoulders pattern forming. The price is currently retesting the Fair Value Gap near 1.34900 — a potential reversal zone if it fails to break higher.
On the fundamental side, the Bank of England's decision to hold interest rates on June 19 disappointed the market. Meanwhile, the US dollar remains supported by safe-haven demand and the Federal Reserve’s hawkish tone, adding further pressure on GBP.
If GBPUSD fails to hold the trendline support near 1.33700, the risk of a deeper decline increases. Both the technical structure and macro fundamentals favor the bears.
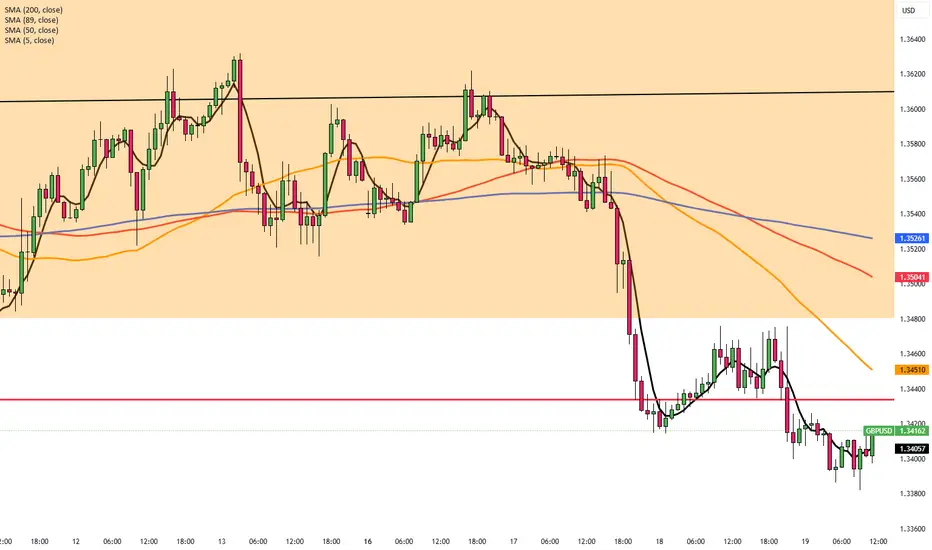
GBPUSD hit its 1D MA50. Perfect buy signal.The GBPUSD pair has been trading within a Channel Up pattern since the January 13 2025 market bottom. Yesterday it hit its 1D MA50 (blue trend-line) for the first time since April 08.
This is the most efficient buy entry as the 1D MA50 has been supporting since the February 13 break-out. Even the 1D CCI turned oversold and rebounded, which is consistent with all bottom buys inside the Channel Up.
The Bullish Leg can extend to as high as +5.05% but due to the presence of the Inner Higher Highs trend-line, we first target 1.3850 (+3.43% rise).
-------------------------------------------------------------------------------
** Please LIKE 👍, FOLLOW ✅, SHARE 🙌 and COMMENT ✍ if you enjoy this idea! Also share your ideas and charts in the comments section below! This is best way to keep it relevant, support us, keep the content here free and allow the idea to reach as many people as possible. **
-------------------------------------------------------------------------------
💸💸💸💸💸💸
👇 👇 👇 👇 👇 👇

AUDUSD and GBPUSD Analysis todayHello traders, this is a complete multiple timeframe analysis of this pair. We see could find significant trading opportunities as per analysis upon price action confirmation we may take this trade. Smash the like button if you find value in this analysis and drop a comment if you have any questions or let me know which pair to cover in my next analysis.

BUY CABLEIn todays session we are monitoring GBPUSD for bullish opportunities. Our buy entry is at 1.34120 and stops are below 1.3380 our target is 1.3500. Use proper risk management and best of luck. Cheers
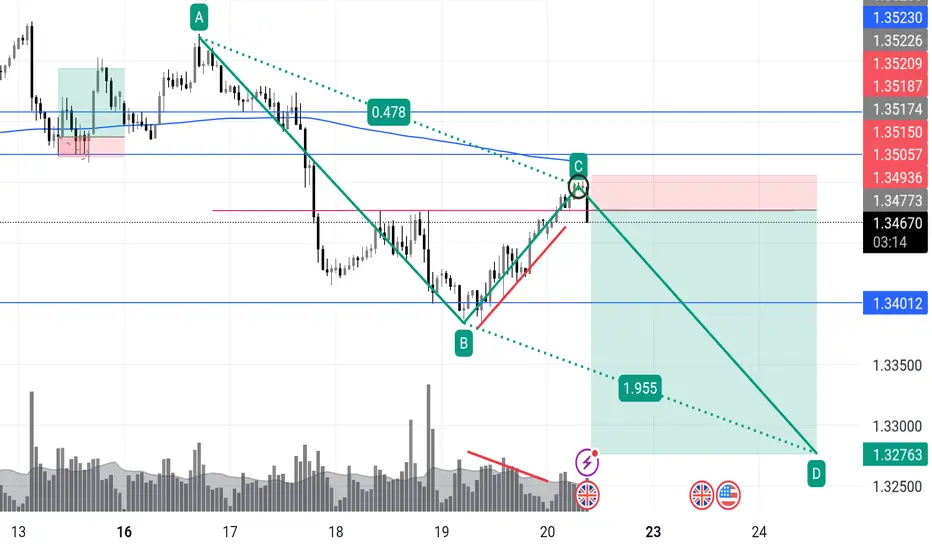
GBPUSD short!Classic Wyckoff upthrust, this is A+
We’ve got a clear AB=CD completion at C, tagging previous support-turned-resistance, while the volume on the climb is drying up (classic clue of passive buyers getting trapped). The channel top + Fibonacci confluence + previous swing zone adds weight.
🔻 Trade Idea:
Entry: 1.3477
Stop: 1.3521 (above wick highs and structure)
Target 1: 1.3401 (break structure)
Target 2: 1.3276 (full measured move / spring's origin)
Risk-Reward: ~3.5R
Volume divergence confirms exhaustion.
Ideal reaction would break through mid-line and sustain under 1.3401.
🔍 Watch For:
Bearish engulfing confirmation on 1h
Volume spike during breakdown = smart money selling
If price lingers above 1.3515, trap invalid
GBPUSD(20250620)Today's AnalysisMarket news:
The Bank of England kept interest rates unchanged at 4.25%, and the voting ratio showed that internal differences were increasing. Traders expect the bank to cut interest rates by another 50 basis points this year.
Technical analysis:
Today's buying and selling boundaries:
1.3439
Support and resistance levels:
1.3526
1.3494
1.3473
1.3406
1.3385
1.3353
Trading strategy:
If it breaks through 1.3473, consider buying, and the first target price is 1.3494
If it breaks through 1.3439, consider selling, and the first target price is 1.3406

GBPUSD H4 I Bearish Reversal Off the Fib confluence Based on the H4 chart, the price is approaching our sell entry level at 1.3502, a pullback resistance that aligns with the 50% Fib retracement and the 127.2% Fib extension, providing a significant level for a potential bearish reversal.
Our take profit is set at 1.3427, a pullback support.
The stop loss is set at 1.3587, a pullback resistance.
High Risk Investment Warning
Trading Forex/CFDs on margin carries a high level of risk and may not be suitable for all investors. Leverage can work against you.
Stratos Markets Limited (tradu.com ):
CFDs are complex instruments and come with a high risk of losing money rapidly due to leverage. 63% of retail investor accounts lose money when trading CFDs with this provider. You should consider whether you understand how CFDs work and whether you can afford to take the high risk of losing your money.
Stratos Europe Ltd (tradu.com ):
CFDs are complex instruments and come with a high risk of losing money rapidly due to leverage. 63% of retail investor accounts lose money when trading CFDs with this provider. You should consider whether you understand how CFDs work and whether you can afford to take the high risk of losing your money.
Stratos Global LLC (tradu.com ):
Losses can exceed deposits.
Please be advised that the information presented on TradingView is provided to Tradu (‘Company’, ‘we’) by a third-party provider (‘TFA Global Pte Ltd’). Please be reminded that you are solely responsible for the trading decisions on your account. There is a very high degree of risk involved in trading. Any information and/or content is intended entirely for research, educational and informational purposes only and does not constitute investment or consultation advice or investment strategy. The information is not tailored to the investment needs of any specific person and therefore does not involve a consideration of any of the investment objectives, financial situation or needs of any viewer that may receive it. Kindly also note that past performance is not a reliable indicator of future results. Actual results may differ materially from those anticipated in forward-looking or past performance statements. We assume no liability as to the accuracy or completeness of any of the information and/or content provided herein and the Company cannot be held responsible for any omission, mistake nor for any loss or damage including without limitation to any loss of profit which may arise from reliance on any information supplied by TFA Global Pte Ltd.
The speaker(s) is neither an employee, agent nor representative of Tradu and is therefore acting independently. The opinions given are their own, constitute general market commentary, and do not constitute the opinion or advice of Tradu or any form of personal or investment advice. Tradu neither endorses nor guarantees offerings of third-party speakers, nor is Tradu responsible for the content, veracity or opinions of third-party speakers, presenters or participants.

Potential bullish rise?The Cable (GBP/USD) has bounced off the pivot which is an overlap support and could rise to the 1st resistance.
Pivot: 1.3403
1st Support: 1.3319
1st Resistance: 1.3517
Risk Warning:
Trading Forex and CFDs carries a high level of risk to your capital and you should only trade with money you can afford to lose. Trading Forex and CFDs may not be suitable for all investors, so please ensure that you fully understand the risks involved and seek independent advice if necessary.
Disclaimer:
The above opinions given constitute general market commentary, and do not constitute the opinion or advice of IC Markets or any form of personal or investment advice.
Any opinions, news, research, analyses, prices, other information, or links to third-party sites contained on this website are provided on an "as-is" basis, are intended only to be informative, is not an advice nor a recommendation, nor research, or a record of our trading prices, or an offer of, or solicitation for a transaction in any financial instrument and thus should not be treated as such. The information provided does not involve any specific investment objectives, financial situation and needs of any specific person who may receive it. Please be aware, that past performance is not a reliable indicator of future performance and/or results. Past Performance or Forward-looking scenarios based upon the reasonable beliefs of the third-party provider are not a guarantee of future performance. Actual results may differ materially from those anticipated in forward-looking or past performance statements. IC Markets makes no representation or warranty and assumes no liability as to the accuracy or completeness of the information provided, nor any loss arising from any investment based on a recommendation, forecast or any information supplied by any third-party.

Potential bullish rise for the Cable?The price has bounced off the support level which is an overlap support that aligns with the 50% Fibonacci retracement and could bounce from this level to our take profit.
Entry: 1.3399
Why we like it:
There is an overlap support level that aligns with the 50% Fibonacci retracement.
Stop loss: 1.3337
Why we like it:
There is a pullback support level that lines up with the 61.8% Fibonacci retracement.
Take profit: 1.3505
Why we like it:
There is a pullback resistance level that aligns with the 50% Fibonacci retracement.
Enjoying your TradingView experience? Review us!
Please be advised that the information presented on TradingView is provided to Vantage (‘Vantage Global Limited’, ‘we’) by a third-party provider (‘Everest Fortune Group’). Please be reminded that you are solely responsible for the trading decisions on your account. There is a very high degree of risk involved in trading. Any information and/or content is intended entirely for research, educational and informational purposes only and does not constitute investment or consultation advice or investment strategy. The information is not tailored to the investment needs of any specific person and therefore does not involve a consideration of any of the investment objectives, financial situation or needs of any viewer that may receive it. Kindly also note that past performance is not a reliable indicator of future results. Actual results may differ materially from those anticipated in forward-looking or past performance statements. We assume no liability as to the accuracy or completeness of any of the information and/or content provided herein and the Company cannot be held responsible for any omission, mistake nor for any loss or damage including without limitation to any loss of profit which may arise from reliance on any information supplied by Everest Fortune Group.

Pound Steady as BoE holds ratesThe British pound is showing limited movement for a second straight day. In the European session, GBP/USD is trading at 1.3435, up 0.18% on the day.
The Bank of England didn't have any surprises up its sleeve as it held rates at 4.25%. This follows a quarter-point cut at last month's meeting. The MPC vote indicated that six members voted to hold while three voted to lower rates. The markets had projected that the vote would be 7-2 in favor of holding rates.
Today's decision to hold rates was widely expected, but that doesn't mean there aren't economic signals which support a rate cut. The UK economy is in trouble and GDP came in at -0.3% in April, its deepest contraction in 18 months.
The weak economy could desperately use a rate cut, but inflation remains stubbornly high and a rate cut would likely send inflation even higher. Annual CPI remained at 3.4% in May, its highest level in over a year.
The geopolitical tensions, most recently the war between Israel and Iran have led to greater economic uncertainty and complicated any plans to lower rates. The BoE is expected to lower rates one or twice in the second half of the year, with the direction of inflation being a key factor in the Bank's rate path.
The Federal Reserve held rates at Wednesday's meeting for a fourth straight time. The Fed noted that inflation remains higher than the target but said the labor market remains strong. President Trump has pushed hard for the Fed to lower rates but Fed Chair Jerome Powell has stuck to his position and repeated on Wednesday that current policy was the most appropriate to respond to the economic uncertainty.

GBPUSD(20250619)Today's AnalysisMarket news:
Fed's June meeting - kept interest rates unchanged for the fourth time in a row, and the dot plot showed two rate cuts this year, but the number of officials who expected no rate cuts this year rose to 7, and the rate cut expectations for next year were cut to 1. Powell continued to call for uncertainty, and the current economic situation is suitable for waiting and watching. He also expects tariff-driven inflation to rise in the coming months.
Technical analysis:
Today's buying and selling boundaries:
1.3432
Support and resistance levels:
1.3507
1.3479
1.3461
1.3403
1.3385
1.3357
Trading strategy:
If the price breaks through 1.3432, consider buying, and the first target price is 1.3461
If the price breaks through 1.3403, consider selling, and the first target price is 1.3385

GBPUSD Analysis todayHello traders, this is a complete multiple timeframe analysis of this pair. We see could find significant trading opportunities as per analysis upon price action confirmation we may take this trade. Smash the like button if you find value in this analysis and drop a comment if you have any questions or let me know which pair to cover in my next analysis.

GBPUSD Bullish continuation pattern supported at 1.3380The GBPUSD currency pair maintains a bullish price action structure, supported by the ongoing rising trend. Current intraday movement appears to be a corrective pullback within a consolidation phase, potentially offering a buying opportunity within the broader uptrend.
Key Technical Levels:
Support (Key Trading Level): 1.3380 (prior consolidation zone)
Additional Support: 1.3340 and 1.3300
Upside Resistance Targets:
1.3480
1.3550
1.3600 (longer-term target)
Bullish Scenario:
A bounce from the 1.3380 support would confirm the continuation of the bullish trend. Sustained upside momentum could then target 1.3480, with further extensions toward 1.3550 and 1.3600 over the medium term.
Bearish Alternative:
A confirmed daily close below 1.3380 would invalidate the bullish outlook and suggest deeper downside retracement. In that case, the next support levels to monitor would be 1.3340 and 1.3300.
Conclusion:
The bias remains bullish while GBPUSD holds above 1.3380. A rebound from this level supports long positions toward higher resistance zones. However, a break and close below 1.3380 would shift the outlook to neutral-to-bearish, favouring further downside correction. Traders should watch price action around 1.3380 for directional confirmation.
This communication is for informational purposes only and should not be viewed as any form of recommendation as to a particular course of action or as investment advice. It is not intended as an offer or solicitation for the purchase or sale of any financial instrument or as an official confirmation of any transaction. Opinions, estimates and assumptions expressed herein are made as of the date of this communication and are subject to change without notice. This communication has been prepared based upon information, including market prices, data and other information, believed to be reliable; however, Trade Nation does not warrant its completeness or accuracy. All market prices and market data contained in or attached to this communication are indicative and subject to change without notice.

GBP-USD Swing Long! Buy!
Hello,Traders!
GBP-USD is trading in an
Uptrend along the strong
Long-term rising support
So after the pair falls down
To retest the rising support
We will be expecting a
Bullish rebound and a move up
Buy!
Comment and subscribe to help us grow!
Check out other forecasts below too!
Disclosure: I am part of Trade Nation's Influencer program and receive a monthly fee for using their TradingView charts in my analysis.

GBPUSD SHORTThe GBP/USD pair has been showing signs of exhaustion after a recent rally, and I'm looking for a potential pullback to enter a short position.
While GBP/USD has shown resilience, the technical and fundamental setup suggests a potential short opportunity on a pullback. Confirmation through price action (e.g., bearish engulfing patterns, break of structure) will be crucial before entering.
BoE in Focus as GBP/USD Nears 1.3410GBP/USD remains under pressure for a third day, trading near 1.3410 in Thursday’s Asian session, as safe-haven demand strengthens the US Dollar amid Israel-Iran tensions. The BoE is expected to hold rates at 4.25% today. UK inflation eased to 3.4% in May from 3.5%, in line with forecasts but still above the 2% target. Markets still price in about 48 basis points of BoE cuts by year-end.
Resistance is seen at 1.3440, while support holds at 1.3260.
GBPUSD IS LOOKING WEAK FOR A HARD SELL OFF SWING TRADEOANDA:GBPUSD Has broken the bullish swing low on 4 Hour time frame with strong sell off bearish candles leaving behind a big bearish imbalances in price. Which extra confirm that price is extremely bearish on 4 Hour time frame.
Now that trend has shifted from bullish trend to a bearish one, am now bearish on GBPUSD.
Bearish shift in market structure that happened on OANDA:EURUSD EURUSD which is a correlating pair with GBPUSD extra confirm this bearish bias on GBPUSD.
likewise also, the Bullish Shift in Market Structure on OANDA:USDCAD USDCAD, which is an opposite correlating pair confirm this sell on GBPUSD.
So, my focus now is selling GBPUSD in every pullback or retest of key bearish levels.
I will update you as the trade develop.

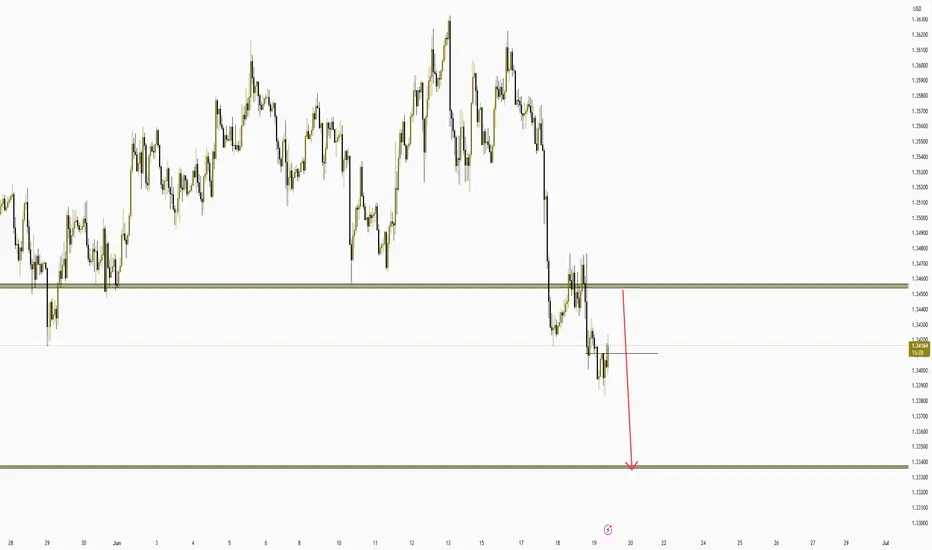
Fundamental Market Analysis for June 19, 2025 GBPUSDEvent to pay attention to today:
14:00 EET. GBP - Bank of England base rate decision
GBPUSD:
GBP/USD remains down for the third consecutive session, trading around 1.34100 in Asian trading on Thursday. The pair is struggling as the US dollar (USD) strengthens amid rising demand for safe-haven assets triggered by escalating tensions between Israel and Iran. In addition, the Bank of England (BoE) is widely expected to leave interest rates unchanged on Thursday.
In the UK, consumer price index inflation fell to 3.4% year-on-year in May, as expected, from 3.5% in April. However, this figure is still well above the BoE's target of 2%. Nevertheless, markets still expect rates to fall by around 48 basis points by the end of the year.
Bloomberg reported on Thursday that ‘US officials are preparing for a possible strike on Iran in the coming days.’ ‘US plans to attack Iran continue to evolve.’ Another Wall Street Journal report suggests that US President Trump approved plans to attack Iran on Tuesday but wanted to see if Tehran would abandon its nuclear programme.
In addition, the dollar was supported by comments from Federal Reserve Chairman Jerome Powell, who said that inflation remains slightly above target and may rise in the future, citing the impact of US President Donald Trump's tariffs.
The US Federal Reserve (Fed) decided at its June meeting on Wednesday, as expected, to leave the base rate unchanged in the range of 4.25-4.50%. The Federal Open Market Committee (FOMC) still forecasts interest rates to fall by about 50 basis points by the end of 2025.
Trading recommendation: SELL 1.34100, SL 1.34300, TP 1.33200

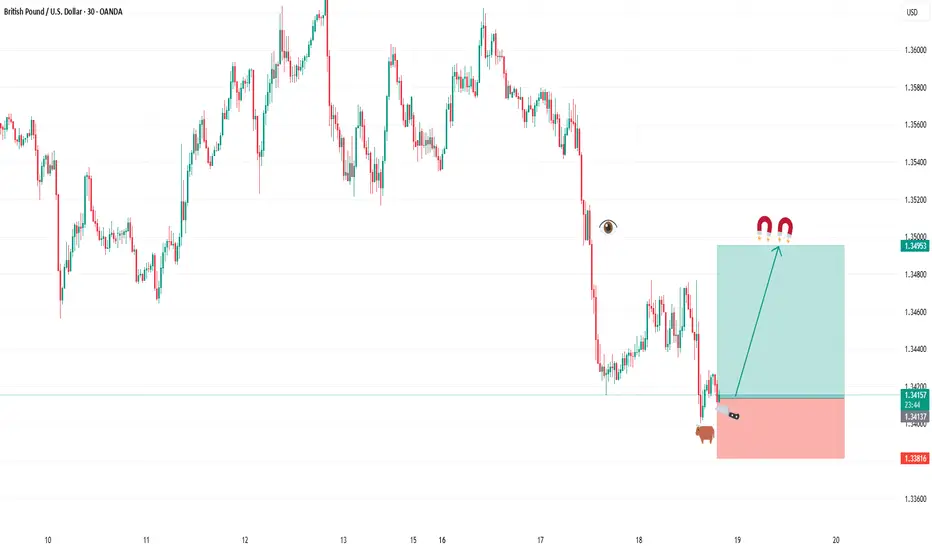
GBP/USD - For FOMC & Fed Interest RateThe GBP/USD pair on the M30 timeframe presents a Potential Buying Opportunity due to a recent Formation of a Channel Pattern. This suggests a shift in momentum towards the upside and a higher likelihood of further advances in the coming hours.
Possible Long Trade:
Entry: Consider Entering A Long Position around Trendline Of The Pattern.
Target Levels:
1st Resistance – 1.3567
2nd Resistance – 1.3682
🎁 Please hit the like button and
🎁 Leave a comment to support for My Post !
Your likes and comments are incredibly motivating and will encourage me to share more analysis with you.
Best Regards, KABHI_TA_TRADING
Thank you.
Disclosure: I am part of Trade Nation's Influencer program and receive a monthly fee for using their TradingView charts in my analysis.

GBPUSD H4 I Bullish RiseBased on the H4 chart analysis, we can see that the price is trading near our buy entry at1.3373 -1.13396, which is a pullback support that aligns with the 50% Fib retracement.
Our take profit will be at 1.3466, which is an overlap resistance
The stop loss will be placed at 1.3320 which is a pullback support below the 61.8% Fib retracement.
High Risk Investment Warning
Trading Forex/CFDs on margin carries a high level of risk and may not be suitable for all investors. Leverage can work against you.
Stratos Markets Limited (tradu.com ):
CFDs are complex instruments and come with a high risk of losing money rapidly due to leverage. 63% of retail investor accounts lose money when trading CFDs with this provider. You should consider whether you understand how CFDs work and whether you can afford to take the high risk of losing your money.
Stratos Europe Ltd (tradu.com ):
CFDs are complex instruments and come with a high risk of losing money rapidly due to leverage. 63% of retail investor accounts lose money when trading CFDs with this provider. You should consider whether you understand how CFDs work and whether you can afford to take the high risk of losing your money.
Stratos Global LLC (tradu.com ):
Losses can exceed deposits.
Please be advised that the information presented on TradingView is provided to Tradu (‘Company’, ‘we’) by a third-party provider (‘TFA Global Pte Ltd’). Please be reminded that you are solely responsible for the trading decisions on your account. There is a very high degree of risk involved in trading. Any information and/or content is intended entirely for research, educational and informational purposes only and does not constitute investment or consultation advice or investment strategy. The information is not tailored to the investment needs of any specific person and therefore does not involve a consideration of any of the investment objectives, financial situation or needs of any viewer that may receive it. Kindly also note that past performance is not a reliable indicator of future results. Actual results may differ materially from those anticipated in forward-looking or past performance statements. We assume no liability as to the accuracy or completeness of any of the information and/or content provided herein and the Company cannot be held responsible for any omission, mistake nor for any loss or damage including without limitation to any loss of profit which may arise from reliance on any information supplied by TFA Global Pte Ltd.
The speaker(s) is neither an employee, agent nor representative of Tradu and is therefore acting independently. The opinions given are their own, constitute general market commentary, and do not constitute the opinion or advice of Tradu or any form of personal or investment advice. Tradu neither endorses nor guarantees offerings of third-party speakers, nor is Tradu responsible for the content, veracity or opinions of third-party speakers, presenters or participants.

GBPUSD I Technical & Fundamental Forecast Welcome back! Let me know your thoughts in the comments!
** GB{USD Analysis - Listen to video!
We recommend that you keep this pair on your watchlist and enter when the entry criteria of your strategy is met.
Please support this idea with a LIKE and COMMENT if you find it useful and Click "Follow" on our profile if you'd like these trade ideas delivered straight to your email in the future.
Thanks for your continued support!Welcome back! Let me know your thoughts in the comments!

Pound recovers as UK CPI edges lowerThe British pound has stabilized on Wednesday. In the European session, GBP/USD is trading at 1.3551, up 0.28% on the day. The US dollar showed broad strength on Tuesday and GBP/USD declined 1.05% and fell to a three-week low.
UK inflation for May edged lower to 3.4% y/y, down from 3.5% in April and matching the market estimate. The driver behind the deceleration was lower airline prices and petrol prices. Services inflation, which has been persistently high, eased to 4.7% from 5.4%. Monthly, CPI gained 0.2%, much lower than the 1.2% gain in April and matching the market estimate.
Core CPI, which excludes food and energy, fell to 3.5% in May, down from 3.8% a month earlier and below the market estimate of 3.6%. Monthly, the core rate rose 0.2%, sharply lower than the 1.4% spike in April and in line with the market estimate. This marked the lowest monthly increase in four months.
The Bank of England will be pleased that core CPI moved lower but the inflation numbers are still too high for its liking. Headline CPI had been below 3% for a year but has jumped well above 3% in the past two months.
BoE policymakers won't have much time to digest today's inflation report as the central bank makes its rate announcement on Thursday. The markets are widely expecting the BoE to maintain the cash rate at 4.25%,
Investors will be keeping a close eye on the meeting, looking for hints of a rate cut later in the year. The UK economy contracted in April and with wages falling and unemployment rising, there is pressure for the BoE to lower rates, but that is risky with inflation well above the BoE's 2% inflation target.
US retail sales slumped in May, falling 0.9% m/m. This was well below the revised -0.1% reading in April and worse than the market estimate of -0.7%. Annually, retail sales fell to 3.3%, down sharply from a revised 5.0%.
Consumers are wary about the economy and anxiety over Trump's tariffs has weighed on consumer spending. If additional key US data heads lower, this will increase pressure on the Federal Reserve to lower interest rates.
GBP/US is putting pressure on resistance at 1.3480. Above, there is resistance at 1.3545
1.3364 and 1.3299 are providing support
