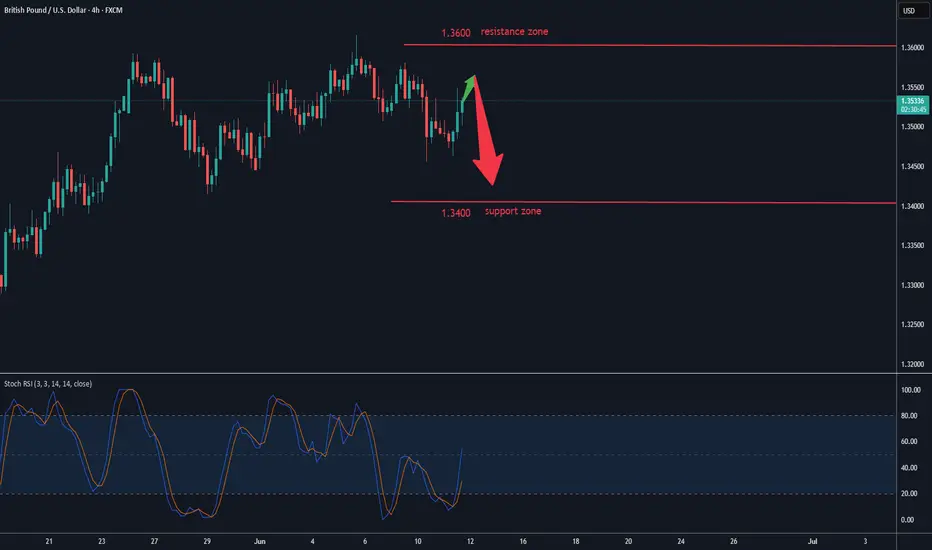
GBPUSD is rising towards the resistance zone of 1.35600GBPUSD is heading towards 1.35600. If the gold price closes around this area, it confirms that the buyers have entered the market. You can set up a BUY signal now with SL placed below the candle wick. After touching 1.356, we can wait for the price reaction and set up a SELL signal again following the sideways border.
Do you agree with our view of buying 1.34900 and SL 1.34600?
Leave a comment
GBPUSD

GBPUSD Bullish Flag breakout supported at 1.3500The GBP/USD currency pair maintains a bullish sentiment, supported by a rising trendline and sustained higher lows. The recent intraday price action suggests a corrective pullback within an overall uptrend, indicative of a consolidation phase rather than a reversal.
Key Support Level: 1.3500
This level aligns with a previous consolidation zone and is acting as a pivotal support. A pullback toward this level could offer a potential buying opportunity, especially if bullish momentum returns.
Upside Targets (on bullish continuation from 1.3500):
1.3610 – Initial resistance from prior swing high
1.3650 – Intermediate resistance level
1.3700 – Long-term target and potential top of the current bullish channel
Bearish Scenario (if 1.3500 fails):
A daily close below 1.3500 would invalidate the current bullish setup, signaling a potential shift in trend. In that case:
Immediate support at 1.3480
Deeper retracement could extend to 1.3450
Conclusion
The broader trend in GBP/USD remains bullish, with the current consolidation viewed as a potential pullback rather than a reversal. The 1.3500 level is critical — a bounce from here could resume the uptrend toward 1.3610 over time. However, a break and close below 1.3500 would weaken the bullish case and open the door to further downside. Traders should monitor price action closely around this key level for confirmation.
This communication is for informational purposes only and should not be viewed as any form of recommendation as to a particular course of action or as investment advice. It is not intended as an offer or solicitation for the purchase or sale of any financial instrument or as an official confirmation of any transaction. Opinions, estimates and assumptions expressed herein are made as of the date of this communication and are subject to change without notice. This communication has been prepared based upon information, including market prices, data and other information, believed to be reliable; however, Trade Nation does not warrant its completeness or accuracy. All market prices and market data contained in or attached to this communication are indicative and subject to change without notice.

GBPUSD - Long after a structural shiftBased off of yesterdays analysis.
We can see we are fast approaching a very nice POI.
Will post below my mark up chart from yesterday so you can see below. Will now be sending most of my day on the 15min TF waiting for our structural shift to the upside.
Let's see how price plays out today.
Don't just dive into the trade. Wait for your structural shift first.
If I can offer any help please do let me know

GBPUSD SHORT FORECAST Q2 W24 D12 Y25GBPUSD SHORT FORECAST Q2 W24 D12 Y25
Professional Risk Managers👋
Welcome back to another FRGNT chart update📈
Diving into some Forex setups using predominantly higher time frame order blocks alongside confirmation breaks of structure.
Let’s see what price action is telling us today!
💡Here are some trade confluences📝
✅Weekly order block
✅15' order block
✅Intraday 15' break of structure
✅Tokyo ranges to be filled
🔑 Remember, to participate in trading comes always with a degree of risk, therefore as professional risk managers it remains vital that we stick to our risk management plan as well as our trading strategies.
📈The rest, we leave to the balance of probabilities.
💡Fail to plan. Plan to fail.
🏆It has always been that simple.
❤️Good luck with your trading journey, I shall see you at the very top.
🎯Trade consistent, FRGNT X

GBP/USD Short Play – Anticipating a Smooth 87-Pip DropTime of Analysis: 9:15 PM (Central US) | Current Price: 1.35736
Key Levels: 1.35268 (First Target) → 1.34918 (Final Target) | Retracement Spike: 1.35500 (NY Session)
A Strategic Short Ahead of London & NY Session Weakness
Based on observed price action and intermarket dynamics, GBP/USD is primed for a controlled descent over the next 12–18 hours, with Tokyo/Sydney sessions laying the groundwork for London’s bearish momentum. Here’s the breakdown:
1. Current Setup & Immediate Catalysts
Bearish Continuation Pattern: The pair has shown subtle rejection near 1.35800 (key intraday resistance), with weakening upward momentum. The initial 30-pip drop from the evening high suggests sellers are testing the waters.
Tokyo/Sydney Session Role: These sessions often consolidate or extend late NY moves. With USD strength creeping in (e.g., Treasury yields firming, risk-off sentiment in Asia), a slow grind toward 1.35268 is likely before London opens.
2. London Session: The Accelerator
European Liquidity Dive: London traders will likely exploit the lack of bullish defense, pushing GBP/USD toward 1.34918. Key factors:
Divergence with EUR: If EUR/GBP rallies, GBP/USD suffers compounded selling.
UK Data Lull: No major catalysts = technicals dominate.
Order Flow Clue: The drop to 1.35268 may trigger stop-loss cascades below 1.35500, fueling the next leg down.
3. New York Session: The Trap Spike
Classic NY Fakeout: After a steady decline, NY traders often "test" liquidity with a quick spike (likely 1.35500) before resuming the trend. This would:
Trap late shorts chasing the breakdown.
Provide a optimal entry for bears targeting sub-1.34900.
Fed Shadow: Any USD strength from hawkish Fed whispers (even without news) could cap rebounds.
Risk Considerations
Bullish Threat: A surprise London headline (e.g., BoE hike chatter) could stall the move, but the technical structure favors downside.
Stop Placement: Initial stops above 1.35950 (pre-9:15 PM swing high) for early entries. Adjust to 1.35780 if entering post-Tokyo open.
-------------------------------------
Final Call
"87 pips or bust." This is a high-probability, slow-burn short with defined targets. Tokyo/Sydney sets the table, London serves the main course, and NY adds the dessert spike before the next leg down.
Projected Timeline:
Next 6h (Tokyo/Sydney): Drop to 1.35268.
London Open (3AM CT): Acceleration to 1.34918.
NY Open (7AM CT): Spike to 1.35500, then resumption of selling.
Trade smart, trade ruthless.

GBPUSD(20250612)Today's AnalysisMarket news:
① The EU hopes that the trade negotiations will be extended beyond the suspension period set by Trump. ② Bessant: As long as "sincerity" is shown in the negotiations, the Trump administration is willing to extend the current 90-day tariff suspension period beyond July 9. ③ Trump will hold multiple bilateral talks during the G7 summit. ④ The total customs revenue of the United States reached a record high of US$23 billion in May, an increase of nearly four times year-on-year. ⑤ Lutnick: One deal after another will be reached.
Technical analysis:
Today's buying and selling boundaries:
1.3525
Support and resistance levels:
1.3627
1.3589
1.3564
1.3486
1.3461
1.3423
Trading strategy:
If the price breaks through 1.3564, consider buying in, the first target price is 1.3589
If the price breaks through 1.3525, consider selling in, the first target price is 1.3486

GBPUSD - Long at some pointVery similar with what we are looking for in relation to EURUSD
Will wait for a mitigation of the demand at lower price. Will wait for an internal structure break before looking to get long.
Will have a nice sleep now and will re-evaluate in the morning.
Caught 2 lovely trades on this today and hopefully I may be able to catch 1 or 2 more before the week is out.
Again, if you have any questions don't be shy to get in touch

Eurusd Buyprice is bullish on the Daily and 4hr tf. on the 1hr it is exiting the Daily demand zone and recently bounced off the 1hr trendline. price is currently around 4hr poi which may help give us fuel to move to the 1hr poi and above targeting next Daily key level.

Bullish bounce off overlap support?GBP/USD is falling towards the support level which is an overlap support that aligns with the 38.2% Fibonacci retracement and could bounce from this level to our take profit.
Entry: 1.3543
Why we like it:
There is an overlap support level that aligns with the 38.2% Fibonacci re4tracement.
Stop loss: 1.3493
Why we like it:
There is a pullback support level that is slightly below the 61.8% Fibonacci retracement.
Take profit: 1.3601
Why we like it:
There is a pullback resistance level.
Enjoying your TradingView experience? Review us!
Please be advised that the information presented on TradingView is provided to Vantage (‘Vantage Global Limited’, ‘we’) by a third-party provider (‘Everest Fortune Group’). Please be reminded that you are solely responsible for the trading decisions on your account. There is a very high degree of risk involved in trading. Any information and/or content is intended entirely for research, educational and informational purposes only and does not constitute investment or consultation advice or investment strategy. The information is not tailored to the investment needs of any specific person and therefore does not involve a consideration of any of the investment objectives, financial situation or needs of any viewer that may receive it. Kindly also note that past performance is not a reliable indicator of future results. Actual results may differ materially from those anticipated in forward-looking or past performance statements. We assume no liability as to the accuracy or completeness of any of the information and/or content provided herein and the Company cannot be held responsible for any omission, mistake nor for any loss or damage including without limitation to any loss of profit which may arise from reliance on any information supplied by Everest Fortune Group.

The British pound's rebound was blockedThe British pound staged a technical rebound after a sharp decline on Tuesday, trading near 1.35 during the North American session. A day earlier, the exchange rate had retreated amid expectations that the Bank of England (BoE) would continue to cut rates twice within the year, triggered by weak UK labor market data. However, on Wednesday, against the backdrop of the US CPI data falling short of expectations, the US Dollar Index weakened, allowing the pound to rebound. Although the exchange rate has regained the 1.35 threshold currently, if UK economic data continues to be weak, the pound may test support levels at 1.34 or lower again.
Humans need to breathe, and perfect trading is like breathing—maintaining flexibility without needing to trade every market swing. The secret to profitable trading lies in implementing simple rules: repeating simple tasks consistently and enforcing them strictly over the long term.
GBPUSD Downward pressure, an usual setup in line with trend
GBPUSD Downward pressure, an usual setup in line with trend
GBPUSD trade ideaFX:GBPUSD
Reason sell:
1) overall bearish
2) candle on trendline rejection
3) spinning top candle signals nearby reversal
4) target previous low

GBPUSD - LongI missed the opportunity yesterday.
However, I've been lucky enough to get involved again as of this morning.
4H orderflow is still bullish so we will still look for the longs until the market tells us otherwise.
If I can help with anything do let me know

GBPUSD ready to jump?GBPUSD after retest of the daily support has got a bounce back to the upside with a momentum as the price already has got rejected back, we may see potential trend continuation. We can spot the double bottom on the lower timeframe from this support and may continue to rise to the resistance. A bullish trade is high probable after confirmation of potential inverted head and shoulder

Fundamental Market Analysis for June 11, 2025 GBPUSDThe GBP/USD pair continues to decline to around 1.34750 during Wednesday's Asian trading session. The pound sterling (GBP) is weakening against the US dollar (USD) due to a weaker UK employment report. Later on Wednesday, attention will shift to the US Consumer Price Index (CPI) for May.
The ILO unemployment rate in the UK rose to 4.6% in the three months to April from 4.5% previously, the British Office for National Statistics said on Tuesday. The figure was in line with expectations. Meanwhile, the change in the number of applicants for unemployment benefits in May was 33,100, compared with -21,200 previously (revised from 5,200), which is below the consensus of 9,500.
In addition, average earnings excluding bonuses in the UK rose 5.2% year-on-year (3M YoY) in April, compared with a revised 5.5% increase in the previous reading. The market forecast was 5.4%. Average earnings including bonuses rose 5.3% over the same period after accelerating to a revised 5.6% in the quarter to March. The data fell short of the forecast of 5.5%.
These figures indicate that the UK labor market is losing momentum under pressure from tax increases and the minimum wage hike by the government. This, in turn, may put some pressure on the pound sterling in the near term. “This gradual slowdown in wage growth may reassure the Bank of England after inflation unexpectedly jumped to its highest level in more than a year last month,” said Paige Tao, an economist at PwC UK.
Trading recommendation: SELL 1.34800, SL 1.35100, TP 1.34100

GBPUSD SHORT FORECAST Q2 W24 D11 Y25GBPUSD SHORT FORECAST Q2 W24 D11 Y25
Professional Risk Managers👋
Welcome back to another FRGNT chart update📈
Diving into some Forex setups using predominantly higher time frame order blocks alongside confirmation breaks of structure.
Let’s see what price action is telling us today!
💡Here are some trade confluences📝
✅Weekly order block
✅15' order block
✅Intraday 15' break of structure
✅Tokyo ranges to be filled
🔑 Remember, to participate in trading comes always with a degree of risk, therefore as professional risk managers it remains vital that we stick to our risk management plan as well as our trading strategies.
📈The rest, we leave to the balance of probabilities.
💡Fail to plan. Plan to fail.
🏆It has always been that simple.
❤️Good luck with your trading journey, I shall see you at the very top.
🎯Trade consistent, FRGNT X

Bearish drop off major resistance?Cable (GBP/USD) has reacted off the pivot which acts as an overlap resistance and could drop to the 1st support which is a pullback support.
Pivot: 1.3506
1st Support: 1.3423
1st Resistance: 1.3586
Risk Warning:
Trading Forex and CFDs carries a high level of risk to your capital and you should only trade with money you can afford to lose. Trading Forex and CFDs may not be suitable for all investors, so please ensure that you fully understand the risks involved and seek independent advice if necessary.
Disclaimer:
The above opinions given constitute general market commentary, and do not constitute the opinion or advice of IC Markets or any form of personal or investment advice.
Any opinions, news, research, analyses, prices, other information, or links to third-party sites contained on this website are provided on an "as-is" basis, are intended only to be informative, is not an advice nor a recommendation, nor research, or a record of our trading prices, or an offer of, or solicitation for a transaction in any financial instrument and thus should not be treated as such. The information provided does not involve any specific investment objectives, financial situation and needs of any specific person who may receive it. Please be aware, that past performance is not a reliable indicator of future performance and/or results. Past Performance or Forward-looking scenarios based upon the reasonable beliefs of the third-party provider are not a guarantee of future performance. Actual results may differ materially from those anticipated in forward-looking or past performance statements. IC Markets makes no representation or warranty and assumes no liability as to the accuracy or completeness of the information provided, nor any loss arising from any investment based on a recommendation, forecast or any information supplied by any third-party.

GBP-USD Bearish Breakout! Sell!
Hello,Traders!
GBP-USD made a bearish
Breakout of the rising support
Which is a resistance now and
The breakout is confirmed
So we are bearish biased
And we will be expecting
A further bearish move down
Sell!
Comment and subscribe to help us grow!
Check out other forecasts below too!
Disclosure: I am part of Trade Nation's Influencer program and receive a monthly fee for using their TradingView charts in my analysis.

Potential bearish breakout?GBP/USD is reacting off the support level which is an overlap support that aligns with the 38.2% Fibonacci retracement and could drop from this level to our take profit.
Entry: 1.3501
Why we like it:
There is an overlap support level that lines up with the 38.2% Fibonacci retracement.
Stop loss: 1.3535
Why we like it:
There is an overlap resistance level that lines up with the 61.8% Fibonacci retracement.
Take profit: 1.3450
Why we like it:
There is a pullback support level.
Enjoying your TradingView experience? Review us!
Please be advised that the information presented on TradingView is provided to Vantage (‘Vantage Global Limited’, ‘we’) by a third-party provider (‘Everest Fortune Group’). Please be reminded that you are solely responsible for the trading decisions on your account. There is a very high degree of risk involved in trading. Any information and/or content is intended entirely for research, educational and informational purposes only and does not constitute investment or consultation advice or investment strategy. The information is not tailored to the investment needs of any specific person and therefore does not involve a consideration of any of the investment objectives, financial situation or needs of any viewer that may receive it. Kindly also note that past performance is not a reliable indicator of future results. Actual results may differ materially from those anticipated in forward-looking or past performance statements. We assume no liability as to the accuracy or completeness of any of the information and/or content provided herein and the Company cannot be held responsible for any omission, mistake nor for any loss or damage including without limitation to any loss of profit which may arise from reliance on any information supplied by Everest Fortune Group.

GBP/USD eases off highs again after poor UK dataAfter an initial tumble to just shy of 1.3450 in response to this morning’s disappointing UK jobs and wages print, the pound staged a spirited recovery, climbing back to a high of 1.3536. However, that rebound appears to be fading, with sterling once again drifting lower as the US dollar finds its footing across the board.
The underwhelming labour market data has bolstered expectations for a Bank of England rate cut in August, with a second move potentially on the cards in November, should incoming data allow. With rate cut probabilities on the rise, the pound’s four-month rally could be running out of steam.
June remains in positive territory for GBP/USD, which raises the prospect of a fifth consecutive monthly gain. But that run may be living on borrowed time. Any further deterioration in UK data—or even a modest pick-up in risk appetite favouring the dollar—could well tip the scales back in favour of the greenback.
From a technical standpoint, cable is beginning to look somewhat top-heavy. The key support zone between 1.3430 and 1.3450 has held up thus far, but a clean break below this region would mark a bearish shift in sentiment. Should that occur, a retreat towards the low 1.30s could swiftly come back into play.
By Fawad Razaqzada, market analyst with FOREX.com

GBPUSD – Holding the Uptrend, Eyeing Resistance BreakoutThe GBPUSD pair continues to respect a well-defined ascending channel on the H4 chart. Each time price retraces to the lower boundary, buying pressure has consistently stepped in. Currently, price is hovering near the channel’s lower edge and the EMA89 – forming a technical support area around 1.35370. If this zone holds, there is a strong potential for a rebound toward the resistance zone near 1.36100–1.36300, which has rejected price twice before.
From a news perspective, markets are awaiting the U.S. CPI report tomorrow. If inflation data comes in weaker, expectations for the Fed to cut interest rates will increase, putting pressure on the USD and allowing GBP to extend gains. Additionally, the Bank of England is expected to maintain a more hawkish stance due to persistent domestic inflation – which further supports the pound’s upward momentum.
Watching the EMA and lower channel boundary is key. If a clear bullish signal forms at this zone, a trend-following long strategy could carry a high probability of success.

$Gold Fills the Gap – Is a Bullish Bounce Toward $3350 Next?By examining the gold chart on the 4-hour timeframe, we can see that in last week’s analysis, the price successfully hit all four targets: $3338, $3332, $3326, and $3317, and finally closed on Friday at $3309. This move delivered over 390 pips of return, and I hope you made the most out of it!
Now, let’s move on to the latest gold analysis: As you can see, today gold dropped to the $3294 zone, finally filling the liquidity gap previously marked on the chart. Currently, gold is trading around $3315, and I expect further bullish movement toward the $3330 area as the first upside target.
After that, we should closely watch the $3332–$3352 zone for a potential corrective reaction.
There are more details in this analysis that I’ll share soon — with your support!
THE MAIN TA :

DeGRAM | GBPUSD broke the channel📊 Technical Analysis
● Pullback stalled exactly on the purple trend-support (≈1.348) and the channel mid-line after a false break of the upper wedge, preserving the sequence of higher-lows since May.
● Price is basing inside the 1.337-1.353 support strip; reclaim of 1.3530 would invalidate the bearish trap and open the next channel-median / April swing at 1.3590, while the lower rail at 1.3250 guards the up-trend.
💡 Fundamental Analysis
● UK April wage growth held at 5.7 % y/y, keeping BoE tightening bias alive, while softer US CPI expectations cool Treasury yields—narrowing the rate gap and underpinning sterling.
✨ Summary
Long 1.337-1.348; confirmation above 1.353 targets 1.3590, stretch 1.3700. View void on an H4 close below 1.3250.
-------------------
Share your opinion in the comments and support the idea with a like. Thanks for your support!
