GBPJPY UPDATE!!Good day traders, I am back again with an update and this time it's on GBP/JPY. On the 1st of June I posted a setup but I mentioned that I will explain it later because I will be able to make my point clearer and easy to understand.
When this setup was posted I had that daily order block in mind, only because I needed to see it revisit the order block for the last time before price could make a run for that internal liquidity resting inside an unfilled FVG(BISI). We can also use that thought as confluence when looking for short term reversals or partial exits. Just by taking a look on the chart I posted again I will put it in the description below, you can see in the sell side of the chart we have a lot of equal lows and ICT teaches us that price looks for relative lows/equal lows and old lows.
On the daily TF price is currently inside a bearish order block and what we do not wanna see is price going over the wick of that wick of a candle that was booked on the 29th of May. We are also inside the premium zone of the wick meaning we can expect to run from there to our objectives below. As always my first objective is always the internal liquidity and that is only because that internal liquidity are my LTF | Highs/Lows.
On the 4H price is inside a balanced price range again that's in my favour meaning I have to note it. ICT teaches that we always wanna trade towards the direction where all our PD arrays are lining up and in this case, it's in the sellside, I believe we are in the starting phase of ICT's sell model.
My name is Teboho Matla but you...you don't know me yet!!
GBPUSD

GBPUSD: Weekly Overview 9th of June 2025GDP m/m is in this week! Take this under consideration. Any significant bearish surprise for this announcement means a possible break of the bullish channel.
******************************************
The indicated levels are determined based on the most reaction points and the assumption of approximately equal distance between the zones.
Some of these points can also be confirmed by the mathematical intervals of Murray.
You can enter with/without confirmation. IF you want to take confirmation you can use LTF analysis, Spike move confirmation, Trend Strength confirmation and ETC.
SL could be placed below the zone or regarding the LTF swings.
TP is the next zone or the nearest moving S&R, which are median and borders of the drawn channels.
*******************************************************************
Role of different zones:
GREEN: Just long trades allowed on them.
RED: Just Short trades allowed on them.
BLUE: both long and short trades allowed on them.
WHITE: No trades allowed on them! just use them as TP points

NQ tumbles?Good day traders, I don't know why but I get a bit scared when it comes to analyzing NQ. I always doubt myself with it.
On the weekly TF price is trading inside an order block and for the past two weeks price has visited the order block two times. In the two times that price revisited the order block it failed to close above the midpoint indicating the strength of the order block, going into the new week I am going to use the discount zone of the OB+ as my resistance.
On the daily TF before I say much, THERE IS A GAP, and price did not trade to it since opening high on the 12th May. That gap is my target and I want to see price go and fill that volume imbalance as ICT calls it.
Still on the daily TF...when you read price for past two weeks on NQ, you'll quickly come to a realization that price has been expanding higher since Tuesday 3rd June, but expanding to where?...well liquidity resting above the high of the candle booked on the 29th of May.
Now on the 4 hour TF things are opening up and price is becoming clearer and it goes to show the importance of multi time frame analysis. The lows of Tuesday and Thursday make the relative equal lows that are shown on the chart. The internal liquidity shown below is my short term target or TP1. The red triangle represents that 4H inverse FVG and once price is trading below the inverse any movement inside that inverse should show weakness!

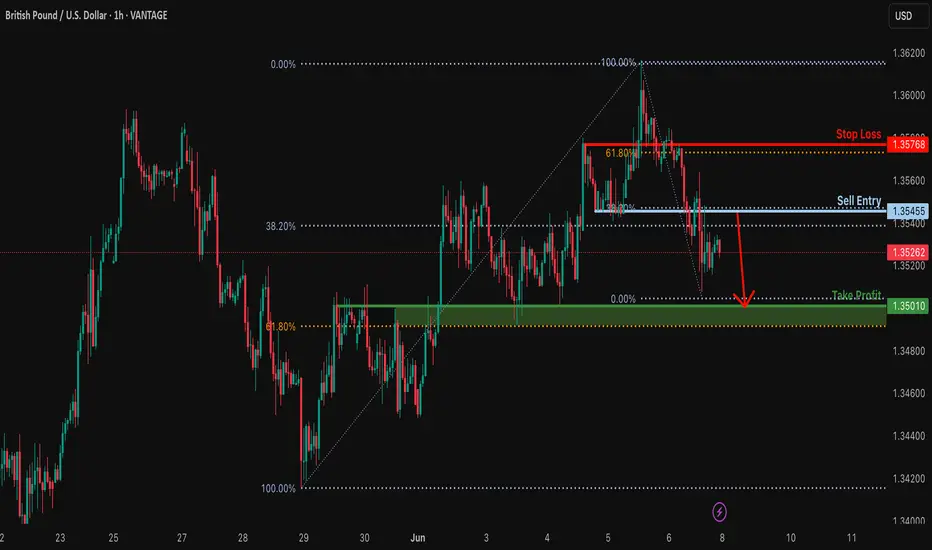
Potential bearish drop?GBP/USD is rising towards the resistance level which is an overlap resistance that lines up with the 38.2% Fibonacci retracement and could drop from this level to our take profit.
Entry: 1.3545
Why we like it:
There is an overlap resistance that aligns with the 48.2% Fibonacci retracement.
Stop loss: 1.3576
Why we like it:
There is a pullback resistance level that lines up with the 61.8% Fibonacci retracement.
Take profit: 1.3501
Why we like it:
There is an overlap support level that is slightly above the 61.8% Fibonacci retracement.
Enjoying your TradingView experience? Review us!
Please be advised that the information presented on TradingView is provided to Vantage (‘Vantage Global Limited’, ‘we’) by a third-party provider (‘Everest Fortune Group’). Please be reminded that you are solely responsible for the trading decisions on your account. There is a very high degree of risk involved in trading. Any information and/or content is intended entirely for research, educational and informational purposes only and does not constitute investment or consultation advice or investment strategy. The information is not tailored to the investment needs of any specific person and therefore does not involve a consideration of any of the investment objectives, financial situation or needs of any viewer that may receive it. Kindly also note that past performance is not a reliable indicator of future results. Actual results may differ materially from those anticipated in forward-looking or past performance statements. We assume no liability as to the accuracy or completeness of any of the information and/or content provided herein and the Company cannot be held responsible for any omission, mistake nor for any loss or damage including without limitation to any loss of profit which may arise from reliance on any information supplied by Everest Fortune Group.
GBPUSD - Technical analysis 2HGood morning, traders, dear TradingView. It's Nika.
I want to share this trading idea, for a reason we have very important resistance level breakout!
I think the price of this pair will continue growing and will reach level 1.37097!
So some of you can just open long now, or wait and enter after a little correction.
Thank you.
Have a profitable day.

Skeptic | This Week's Most Profitable Setups: Gold, Forex & SPX!hey, traders, it’s Skeptic ! 😎 Our last watchlist was straight fire, racking up some sweet profits with tons of setups. This week’s looking just as juicy, so stick with me to catch these killer opportunities! 🚖 Welcome to my Weekly Watchlist, where I lay out the markets I’m trading with active triggers—forex pairs, commodities, and CFD indices. No FOMO, no hype, just pure reasoning to keep your trades sharp. Let’s jump in! 📊
DXY (Dollar Index)
Let’s kick off with DXY, ‘cause getting this right makes analyzing other indices and pairs a breeze. After multiple failed attempts to break support at 98.8 , it’s still ranging. This is a monthly support, so confirmation of a break needs to come on a monthly or at least weekly chart. Personally, I’m betting it’ll bounce from here. A break above 99.36 gives early confirmation of a rise, but the real deal is breaking resistance at 100 —then you can short USD pairs like EUR/USD . If 98.8 gives way, look for longs, but this monthly zone is tough, so expect some chop! 😬
EURX
EURX seems to be in a weak upward channel. A break above 1063 could push us to 1071 . On the flip side, breaking the channel’s midline at 1058 might drag us to the floor or even support at 1049 . So, our EURX game plan is clear.
Watchlist Breakdown
Let’s hit the watchlist, starting with XAU/USD (Gold ).
Triggers here are tricky, but I cloned last week’s downward channel and placed it above—this trick often gives us solid setups. If we bounce off the channel’s floor, a break above resistance at 3340 opens a long. For shorts, I don’t have a trigger yet since the market’s already dumped. If we form a 1-hour range, a break below its floor could trigger a short targeting 3249 or the previous channel’s midline.
Now, XAG/USD (Silver)
—no triggers this week. Our long trigger from last week’s analysis at 33.68 smashed it, spiking 8%! 🎉 That’s a lock even Bitcoin traders would drool over, but in Skeptic Lab :)
Next, EUR/USD.
The long trigger is set at a break above resistance at 1.14555 , which lines up with the DXY support break I mentioned. Heads-up: this trade won’t be easy. Reduce risk ‘cause we’re in for a big fight at this level—wild swings and tight stop losses get hunted fast. Stay sharp! 😤
GBP/USD Update
My GBP/USD long got stopped out, so let’s break it down. I went long after a resistance break, with crazy uptrend momentum and RSI hitting overbought (which I see as a long confirmation). Everything looked dope except my stop loss placement. The prior move was so sharp that my stop had to be wide, tanking my R/R. It hit the box ceiling target but then dumped, nailing my stop. Lesson? Either jump in before the main momentum or let the move play out and skip it. Mid-move entries with big stops? Recipe for pain...
SPX 500
Our SPX 500 long trigger from breaking the box ceiling already fired and seems to have pulled back. My target’s 6128.55 , and my open position has a stop loss below 5952.51. If you missed last week’s trade, a new trigger could be a 1-hour resistance break at 6014.20 . If you’re already long, no need to double up.
Final Note
my max risk per trade is 1%, and I suggest you stick to that or lower. I’m cooking up a Money management guide soon, diving deep into why it’s the key to outpacing 90% of traders and boosting your odds of consistent profits. Stay tuned! 🚨 No FOMO, and have an awesome week!
💬 Let’s Talk!
If this watchlist lit a spark, hit that boost—it means a ton! 😊 Got a pair or setup you want me to tackle? Drop it in the comments. Thanks for rolling with me—keep trading smart! ✌️

"Continue to maintain strength"The GBP/USD trended higher in a volatile manner this week, rising 0.5% on a weekly basis and demonstrating relatively robust performance among major currencies. The UK's exemption from Trump's newly imposed steel and aluminum tariffs provided support for the British pound, with market sentiment remaining relatively optimistic. Analysts noted that the UK's immunity to Trump's steel and aluminum tariffs constitutes a positive factor for the GBP, but next week's employment data will be pivotal. A rise in the unemployment rate for April could weaken the pound's upward momentum. The market holds a positive view on the Bank of England's (BoE) cautious monetary policy stance, believing it will help the GBP maintain its strength in the short term.
Humans need to breathe, and perfect trading is like breathing—maintaining flexibility without needing to trade every market swing. The secret to profitable trading lies in implementing simple rules: repeating simple tasks consistently and enforcing them strictly over the long term.

GBPUSD - Very InterestingWith NFP creating massive volatility on Friday this pair is a bit messy.
We have however created an internal structure shift on the 15min timeframe to the downside lower the HTF order flow still being bullish
This could be a case of get what we can to the downside until we hit the HTF demand and look to get long.
As you can see I am already trying to forecast ahead of what could potentially happen with this pair as when it gets to certain levels and there are reactions it will come as no surprise.
If I can be of assistance to anybody please don't hesitate to message.

Bitcoin plummets!!Good day traders, I am back with yet another update on BTC/USD. My last update on bitcoin what I was expecting price to do unfortunately did not happen as price was very weak, I had a FVG(SIBI) that I really wanted price to revisit and the two price levels that make up the SIBI are 107752 and 107149.
Now that both our sellside liquidity were taken does that mean price is now gonna look for the buyside liquidity? My honest opinion is I don't think because I said 97k is insight and I believe it can still happen and it will according to my HTF perspective.
On the daily TF we have clear sight of relative highs that we wanna see price take and that might happen today but my short term objective is the high that was booked on Tuesday. That Tuesday's candlestick has a very large wick and from my time learning with ICT's content, wicks contain a lot of price data that can be used either for entries or exits.
4H- Here we had a shift in market structure lower on Thursday but price has been bullish ever since the shift happened. On this respective TF we have equal highs too, and ICT teaches us to always focus our attention on them mainly because price looks for liquidity and imbalances on the 4 hour TF...should we look closely on the left of our screens or chart, there is an order block from the wick I mentioned above. Again what are the rules of an order block?..
FROM TOMORROW PRICE WILL START TO PLUMMET!!

GBPUSDGBPUSD needs some more downside before a further push up towards 1.365 level.
Disclosure: We are part of Trade Nation's Influencer program and receive a monthly fee for using their TradingView charts in our analysis.

GBPUSDThe major trend for GBP/USD remains bullish. A retracement on the Daily timeframe has completed. This is a good opportunity to enter a long position at the marked zone. Place your Take Profit and Stop Loss levels at the nearest support and resistance (SNR) zones.

GBPUSDHI
According to our style, we should wait for the formation of a pivot to confirm the bullish trend.

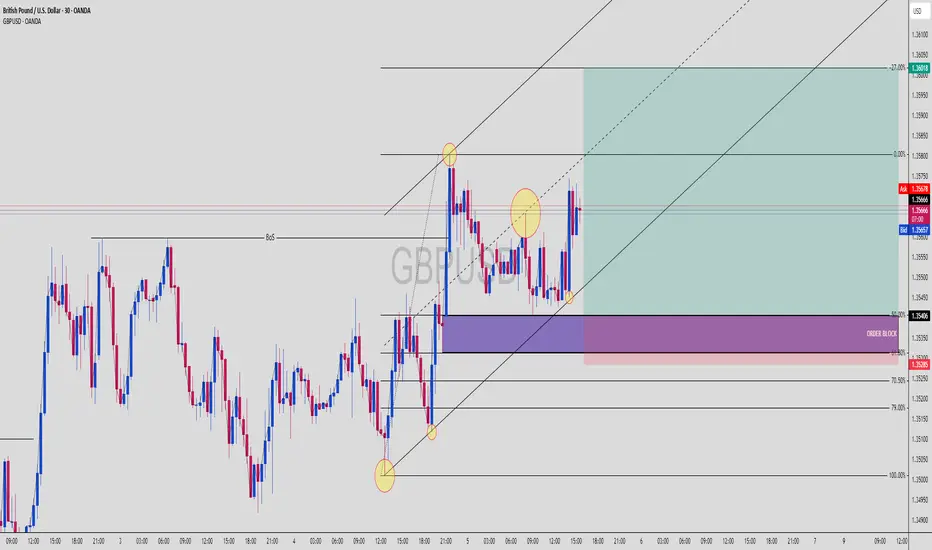
GBPUSD Buy Setup! BoS + OB + 61.8–79% Fib + Trend Channel ComboGBPUSD | 30-Min Chart – High Probability Long Setup Identified
GBPUSD is showing bullish intent after a clear Break of Structure (BoS) and now offers a high-confluence buy opportunity. This setup combines Smart Money Concepts with classical technical analysis for a sniper-grade entry.
🔍 Trade Breakdown:
📈 Break of Structure (BoS):
Price broke previous highs with strong bullish momentum.
Confirmed market intent shift from ranging to bullish.
📐 Fibonacci Confluence:
Price retraced perfectly into the 61.8% – 79% Fib zone from the latest bullish impulse.
These golden ratio levels align with an institutional Order Block (OB) and ascending trendline — high confluence entry.
🟣 Order Block Zone (OB): 1.35285 – 1.35406
The last bearish candle before bullish BoS — a clean demand zone.
OB sits within the Fib retracement zone and overlaps a mid-trendline tap.
📐 Fibonacci Levels (Swing Low to High):
61.8% = 1.35285
70.5% = ~1.35190
79% = ~1.35075
This is the institutional kill zone — OB + 61.8–79% retracement = precision buy levels.
🟡 Liquidity Sweep + Reaction:
Price swept liquidity below short-term lows and tapped the OB with a sharp bullish reaction.
Candle confirmation + lower wick shows strong rejection from Smart Money.
🧭 Projected Move:
Targeting a move toward the -27% Fib extension at 1.36018
Trendline and internal structure support bullish continuation
🔵 Projected Path:
Sweep ➝ OB/Fib confluence tap ➝ strong bullish continuation into premium territory
🧠 Chart Ninja Entry Plan:
🔹 Entry Zone: 1.35285 – 1.35406 (OB + 61.8–70.5% Fib)
🔻 SL Below: 1.35000 (beneath OB & key structure low)
📈 Target: 1.36018 (-27% Fib extension)
⚖️ RRR: 1:3+ — sniper entry with institutional precision
💬 Ninja Wisdom:
Smart Money isn’t buying breakouts — they buy retracements into OB zones with precision.
Combine OB + Fib + channel = institutional roadmap.
Let price come to you. Let retail chase. 🥷💸
📍 Save this GBPUSD setup before it hits the next impulse wave
🗣️ Drop your thoughts – are you buying this OB too?
👣 Follow @ChartNinjas88 for more institutional-grade setups daily
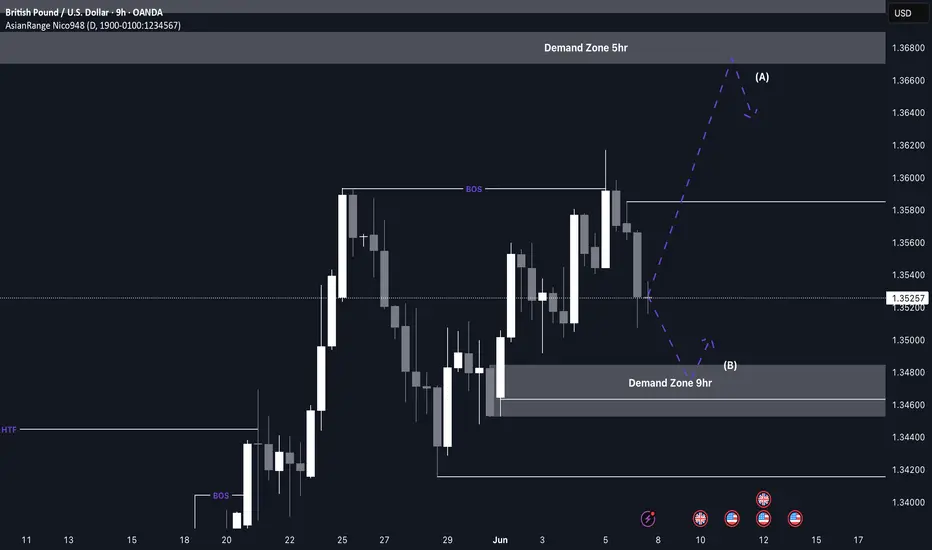
GBP/USD Buys from 1.34800 This week’s analysis focuses on capitalising on the strong bullish structure forming on GU. After a clear break of structure to the upside, price has been forming consistent higher highs and higher lows.
From this move, a key Point of Interest has been left around the 1.34800 level, which aligns with a clean 9H demand zone. As price now needs to retrace after the recent bullish push, this 9H zone becomes a likely area for accumulation and a potential continuation rally.
Confluences for GU Buys:
- GU has been very bullish overall on the higher timeframes
- The 9H demand zone caused the latest break of structure to the upside
- There’s plenty of liquidity and imbalance above that needs to be taken
- The DXY is moving bearish, supporting GU upside
P.S. If price pushes higher before retracing, it may enter a premium supply zone, where I’ll be watching for any significant reaction. Either way, patience is key — don’t hesitate to wait for your setup to fully form.
Wishing you a focused and profitable trading week!
GBP_USD SWING BREAKOUT|SHORT|
✅GBP_USD was trading in an
Uptrend along the rising support
But now this support is broken
And the breakout is confirmed
So we are bearish biased
And we will be expecting a
Further bearish move down
SHORT🔥
✅Like and subscribe to never miss a new idea!✅
Disclosure: I am part of Trade Nation's Influencer program and receive a monthly fee for using their TradingView charts in my analysis.

GBP-USD Local Long! Buy!
Hello,Traders!
GBP-USD made a bearish
Breakout of the rising support
So we are bearish biased mid-term
But locally the pair will soon
Hit a horizontal support
So we will be expecting a
Rebound and a local move up
Buy!
Comment and subscribe to help us grow!
Check out other forecasts below too!
Disclosure: I am part of Trade Nation's Influencer program and receive a monthly fee for using their TradingView charts in my analysis.

GBPUSD - ShortLooking at a key supply area on the higher timeframe of GBPUSD
We now have a structural shift to the downside on the 1H TF that has left an unmitigated OB with a level of inducement.
Pending order will be set on this pair @ 1.35676
We will see how the market plays out around this area
Peace

Gold Rejected Below $3370 — Eyes on Lower Demand Zones! (READ)By examining the gold chart on the 4-hour timeframe, we can see that after our previous analysis, the price climbed to $3388, giving us nearly 150 pips of return. However, gold was rejected from that level and failed to hold above $3370, eventually dropping below $3360.
Currently, gold is trading around $3348, and we may likely see further decline toward lower levels. The potential downside targets are $3338, $3332, $3326, and $3317.
Key demand zones to watch are:
→ $3327
→ $3311
→ $3298–$3300
→ $3278
Please support me with your likes and comments to motivate me to share more analysis with you and share your opinion about the possible trend of this chart with me !
Best Regards , Arman Shaban

GBPUSD: Will Keep Growing! Here is Why:
The recent price action on the GBPUSD pair was keeping me on the fence, however, my bias is slowly but surely changing into the bullish one and I think we will see the price go up.
Disclosure: I am part of Trade Nation's Influencer program and receive a monthly fee for using their TradingView charts in my analysis.
❤️ Please, support our work with like & comment! ❤️

GBPUSD Approaches Key Resistance: Watch for Bearish ReversalGBPUSD pair is trading within a clearly defined ascending channel on the 1-hour chart, showing a short-term bullish structure. However, this bullish move appears corrective within a broader consolidation range capped near the 1.3590 resistance zone.
🔍 Technical Breakdown:
Current Price: 1.35535
Immediate Resistance: 1.35885–1.35929 (previous highs and psychological level)
Support Levels:
Trendline support near 1.3530
Horizontal support: 1.34282, 1.34176
Structure:
Price has formed a bullish flag breakout and is now approaching key resistance.
A new higher high is anticipated toward 1.3590, but this level has repeatedly rejected price in the past.
The projected path indicates a potential liquidity grab above 1.3590 followed by a sell-off toward 1.3420–1.3410 area, aligning with a trendline break scenario.
Bearish Scenario:
A strong rejection from the 1.3590 zone, especially if accompanied by bearish divergence or a strong candle close, could trigger a shift back down to the 1.3417–1.3428 support zone.
This would confirm a short-term top and potential retracement toward lower liquidity zones.
📊 Fundamental Backdrop:
USD-side:
Recent U.S. labor market strength (e.g. ADP report and low jobless claims) supports a hawkish bias, favoring USD upside.
However, Fed policymakers remain cautious due to trade tensions and tariff uncertainty. This has injected short-term volatility into USD pairs.
GBP-side:
UK economic data has been mixed, with GDP growth forecasts under scrutiny.
BoE policymakers are dovish, emphasizing weak productivity and wage pressures, making the pound vulnerable to downside catalysts.
📌 Conclusion:
Watch for a potential bull trap near 1.3590, followed by a bearish reversal toward 1.3420–1.3410 if momentum weakens and sellers step in. This would complete the expected technical leg down and align with broader risk sentiment if dollar strength returns.

Fundamental Market Analysis for June 6, 2025 GBPUSDThe GBP/USD pair is trading near 1.3570 with little movement ahead of the US (US) labor market data.
The US Dollar Index (DXY), which measures the value of the US Dollar against six major currencies, is trading above around 98.80 at the time of writing. The upcoming US non-farm payrolls data for May is expected to add 130,000 jobs, down from April's 177,000. The unemployment rate is also expected to remain unchanged at 4.2%.
Weekly initial jobless claims rose to 247,000, above the 235,000 expected, U.S. Labor Department data showed. ADP US private sector employment data released on Thursday showed a 37,000 increase in May versus a 60,000 increase (revised from 62,000) recorded in April, well below market expectations of 115,000.
GBP/USD is gaining support as the Pound Sterling (GBP) finds support amid rising risk sentiment in the United Kingdom (UK) markets following US President Donald Trump's executive order signed on Tuesday. British exporters still face the previous 25 percent tariff rate as Trump granted the UK temporary relief from the US' stiff 50 percent tariffs on steel and aluminum.
Trading recommendation: SELL 1.3500, SL 1.3600, TP 1.3300

GBPUSD Trading Analysis ### 1. Overall Trend & Market Context
- Bullish Momentum: GBPUSD is in a strong bullish trend, driven by DXY weakness (U.S. Dollar Index declining) and GBP strength. Key factors include:
- Fundamental Drivers:
- UK manufacturing contraction (less severe than expected) and rising housing prices.
- U.S. dollar weakness due to manufacturing slowdown (ISM PMI at 48.5), trade tensions, and fiscal concerns.
- Fed policy uncertainty (rates likely to remain unchanged post-May cut).
- Technical Drivers: Higher lows and higher highs on the 4-hour chart, indicating trend continuation.
### 2. Key Technical Levels & Patterns
- Support Zones:
- 1.3490–1.3500: A critical support area (pullback retracement, 61.8% Fibonacci level).
- 1.34420: Stop-loss level for long positions (below the liquidity pocket).
- Resistance Levels:
- 1.3580: Target for bullish breakout.
- 1.37370: Next major resistance (1:2 risk-reward setup).
- Patterns:
- Bullish Flag: Breakout above key resistance (1.3430) followed by consolidation.
- Broadening Wedge: High volatility pattern with widening highs/lows; potential for breakout (bullish or bearish).
- Bullish Engulfing: Confirmed entry after breaking key support/resistance.
### 3. Trading Opportunities
- Buy Zones:
- 1.3490–1.3500: Entry on breakout from consolidation range (1.3500).
- 1.35260: Buy limit for a liquidity hunt below minor intraday lows.
- Take Profit:
- 1.3580 (first resistance) and 1.37370 (measured move target).
- Risk Management:
- Stop-loss at 1.34420 (below support).
- 1:2 risk-reward ratio for long positions.
### 4. Key Risks & Considerations
- Bearish Scenarios:
- Failure to hold above the breakout zone (1.3500).
- Pressure from resistance at 1.3580.
- Return to consolidation range, delaying the upside move.
- Volatility: Broadening wedge patterns may fake out traders, emphasizing the need for strict risk management.
### 5. Fundamental Outlook
- GBP Strength: UK economic data (housing, manufacturing) supports GBP.
- USD Weakness: U.S. manufacturing slowdown, trade tensions, and fiscal concerns weigh on the dollar.
- Fed Policy: Markets expect rate cuts to continue, further pressuring USD.
### 6. Final Notes & Disclaimers
Stay disciplined, manage risk, and let the market confirm your trades. 📈
*Disclaimer: This is for educational purposes only. Trading involves risk; ensure you understand the risks before trading.*

Bullish continuation?The Cable (GBP/USD) is falling towards the pivot, which is an overlap support and could rise to the 1st resistance.
Pivot: 1.3507
1st Support: 1.3420
1st Resistance: 1.3644
Risk Warning:
Trading Forex and CFDs carries a high level of risk to your capital and you should only trade with money you can afford to lose. Trading Forex and CFDs may not be suitable for all investors, so please ensure that you fully understand the risks involved and seek independent advice if necessary.
Disclaimer:
The above opinions given constitute general market commentary, and do not constitute the opinion or advice of IC Markets or any form of personal or investment advice.
Any opinions, news, research, analyses, prices, other information, or links to third-party sites contained on this website are provided on an "as-is" basis, are intended only to be informative, is not an advice nor a recommendation, nor research, or a record of our trading prices, or an offer of, or solicitation for a transaction in any financial instrument and thus should not be treated as such. The information provided does not involve any specific investment objectives, financial situation and needs of any specific person who may receive it. Please be aware, that past performance is not a reliable indicator of future performance and/or results. Past Performance or Forward-looking scenarios based upon the reasonable beliefs of the third-party provider are not a guarantee of future performance. Actual results may differ materially from those anticipated in forward-looking or past performance statements. IC Markets makes no representation or warranty and assumes no liability as to the accuracy or completeness of the information provided, nor any loss arising from any investment based on a recommendation, forecast or any information supplied by any third-party.
